


Unlocking Market Secrets: High-Probability Trading Techniques for Bitcoin Perpetual Futures
Bitcoin perpetual futures trading offers an exhilarating frontier for those looking to capitalize on the dynamic cryptocurrency market. With 24/7 access, the ability to profit from both rising and falling prices, and the amplification of gains through leverage, it's a powerful tool. However, achieving a consistently high win rate in this inherently volatile environment requires more than just understanding basic indicators. It demands a sophisticated grasp of market behavior, integrated analytical skills, and a disciplined approach to BTC futures trading. This Bitcoin Perpetual Futures Tutorial will guide you through strategic techniques to help you truly decipher market signals and enhance your trading edge.
I. The Cornerstone of High-Probability Trading: Trend Identification and Following
The most fundamental principle in any market is that "the trend is your friend." Identifying and trading in the direction of the prevailing trend significantly increases your odds of success. Trends represent the dominant market force and inertia; attempting to trade against them, while occasionally profitable, carries significantly higher risk and is generally not conducive to a high win rate.
- Discerning the Trend: A Multi-Timeframe Perspective
A common pitfall for traders is focusing solely on a single timeframe. To truly understand market momentum, you should first assess the broader trend using larger timeframes (e.g., daily, 4-hour charts), which helps establish your macro bias. Only then should you zoom into shorter timeframes (e.g., 1-hour, 15-minute) to pinpoint precise entry and exit points within that overarching trend.
For instance, if Bitcoin is clearly in an uptrend on the daily chart (consistently making higher highs and higher lows), your primary focus on smaller timeframes should be on finding long opportunities during pullbacks, rather than trying to short against the primary trend.
-
Price Action is the Rawest Signal
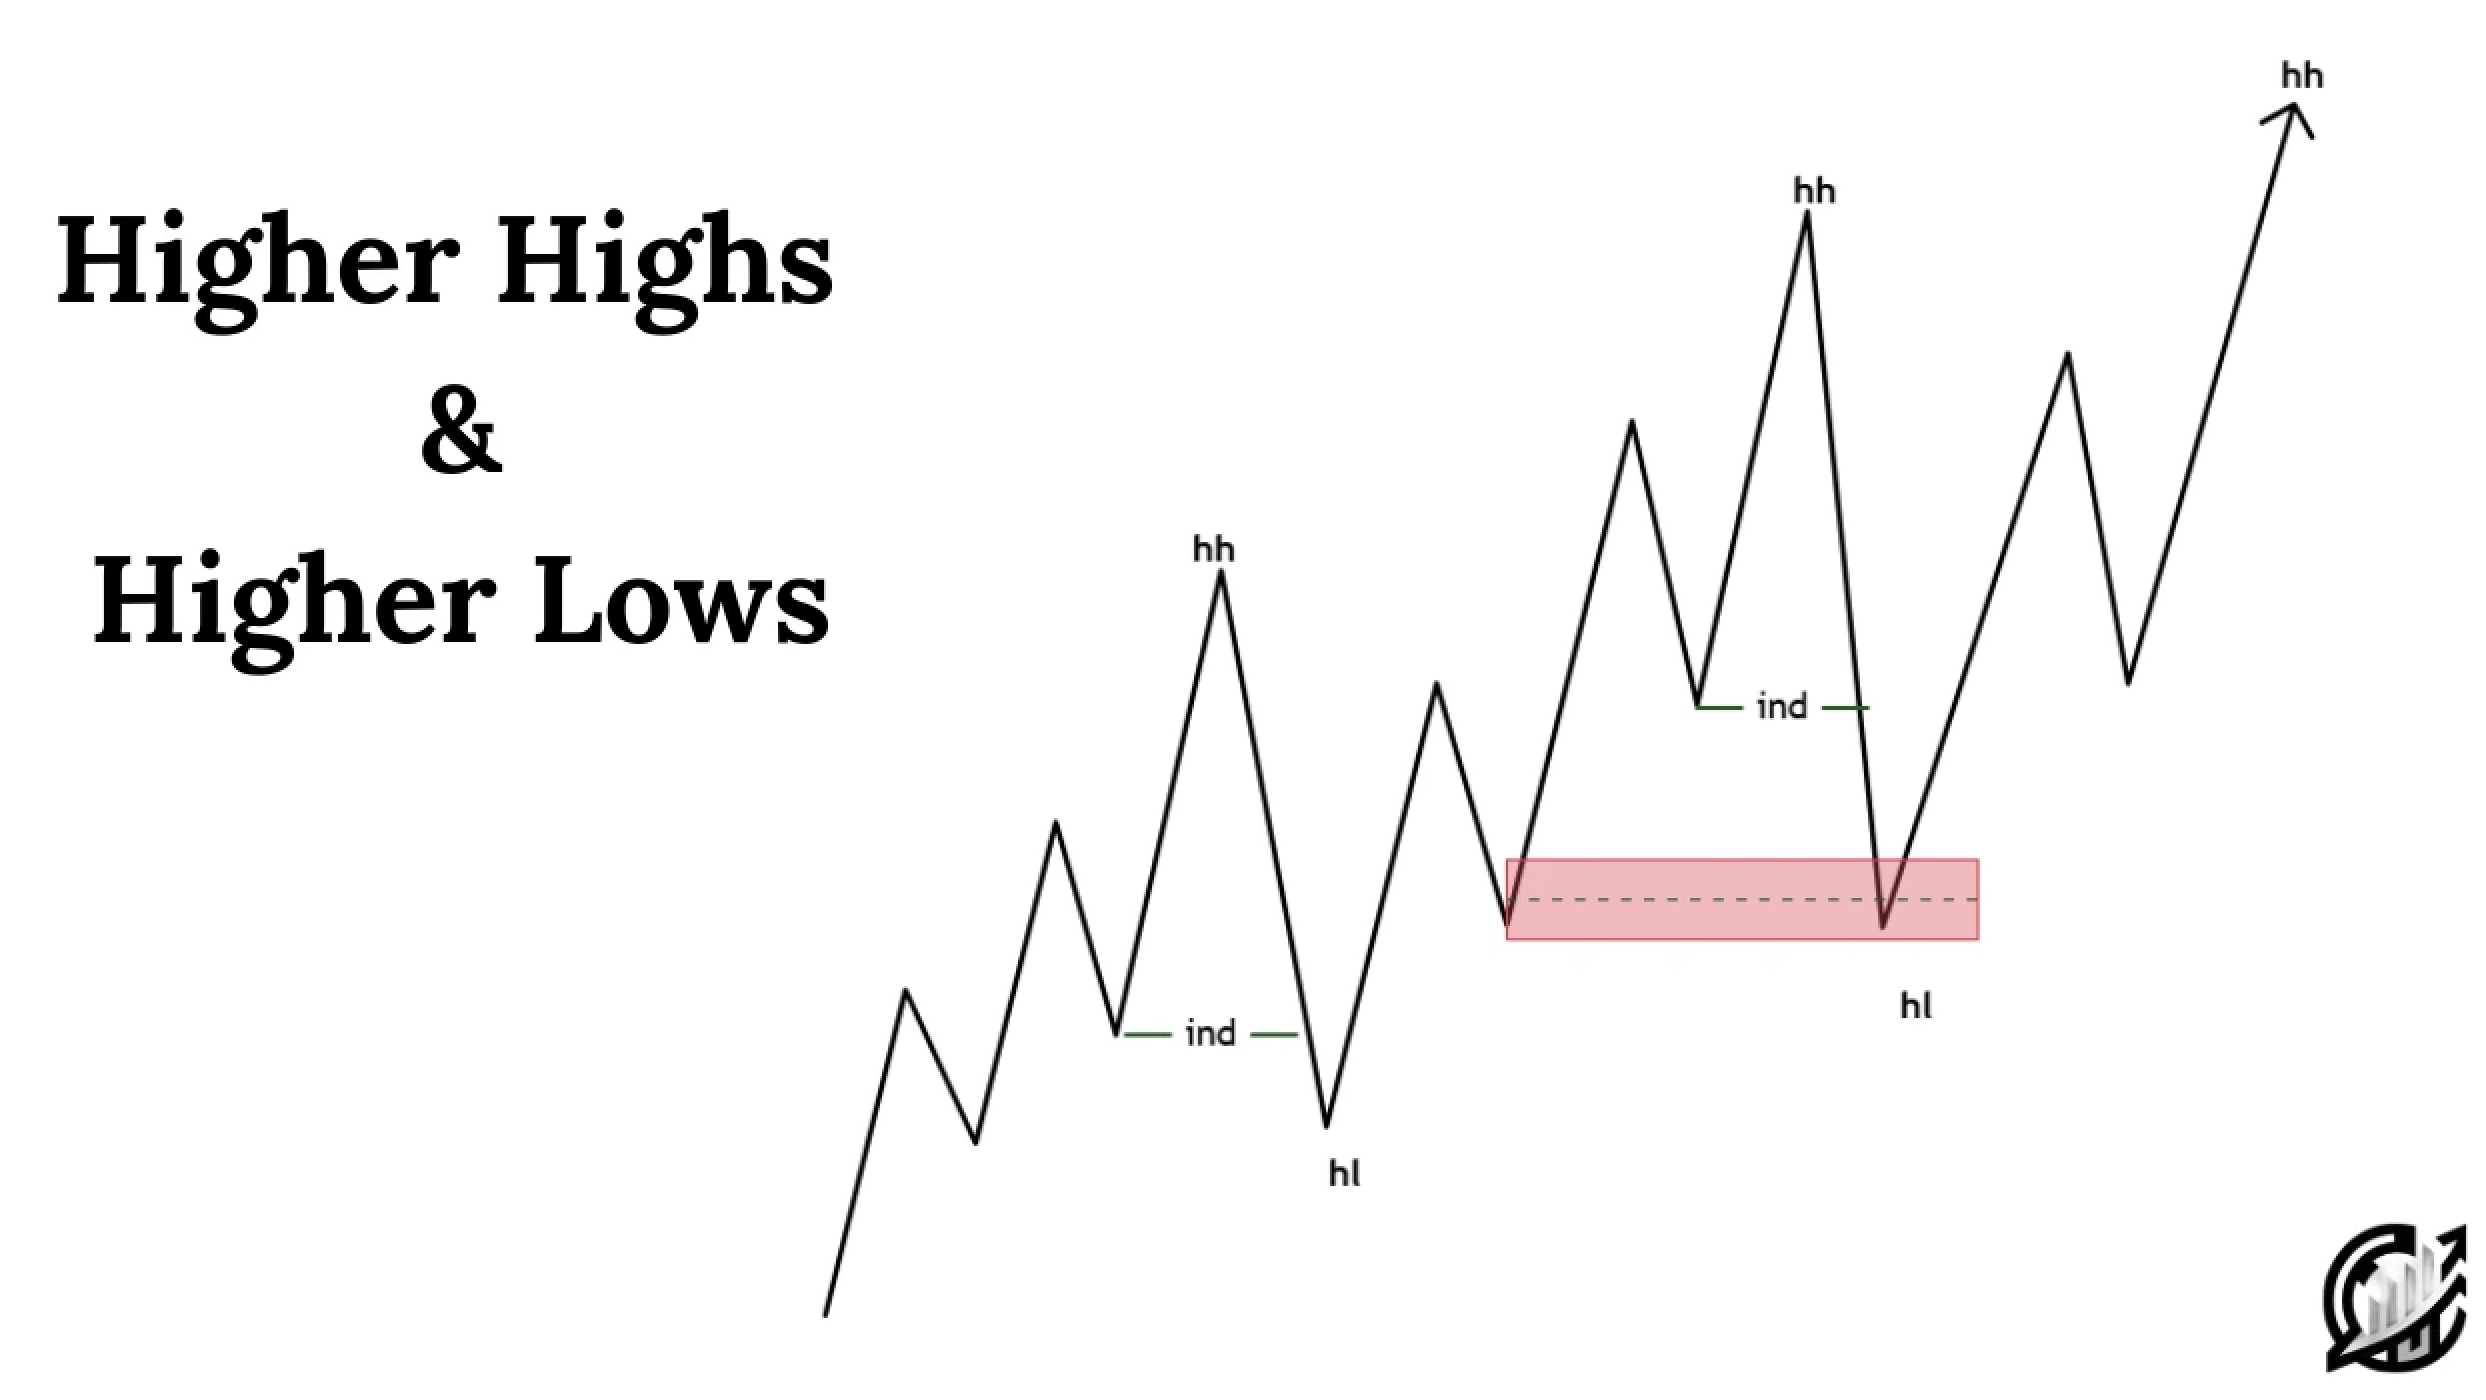
Image: Writo-Finance
The most direct indicators of a trend come from price action itself. In an uptrend, prices will consistently form Higher Highs (HH) and Higher Lows (HL). Conversely, in a downtrend, you'll observe Lower Highs (LH) and Lower Lows (LL). A break in these established structures often signals a potential trend shift or a move into a consolidation phase.
-
Moving Averages (MAs) as Trend Filters
Moving Averages are powerful visual aids for trend identification and confirmation. For an uptrend, shorter-period MAs (e.g., 20-period) will typically be positioned above longer-period MAs (e.g., 50-period, 200-period) and be sloping upwards. The opposite holds true for a downtrend. A cross-over of these MAs (e.g., a "golden cross" where a short MA crosses above a long MA) can indicate a potential trend reversal or strengthening of the existing trend.
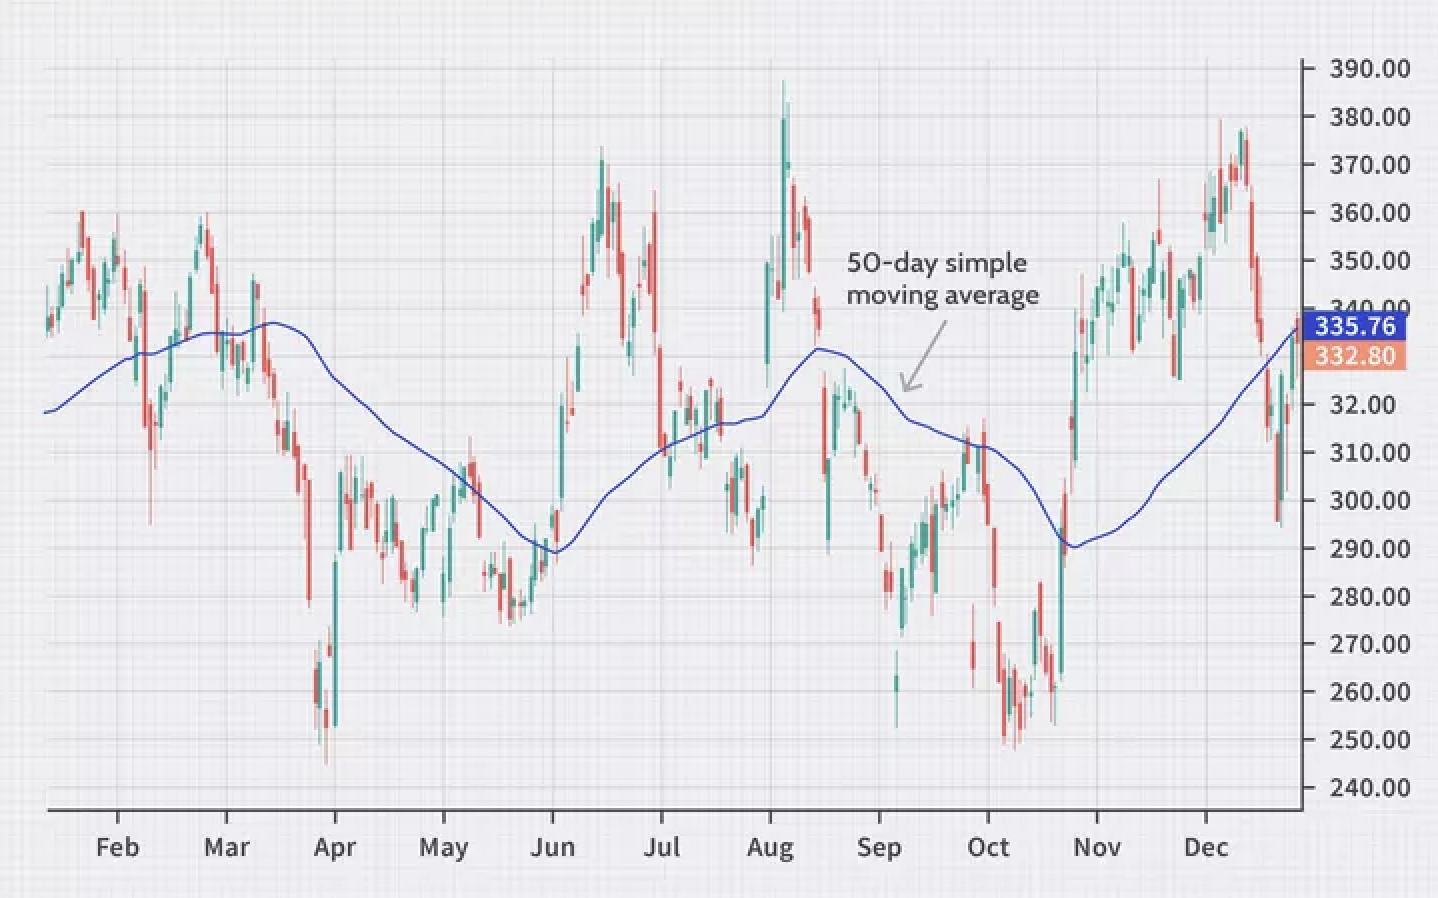
Image: Investopedia
Once a trend is identified, high-probability entry points often occur during healthy pullbacks or retracements within that trend.
- In an Uptrend: Wait for price to pull back to a key support area (e.g., previous resistance turned support, a major moving average, or a Fibonacci retracement level). Look for bullish candlestick patterns (like a Hammer or Bullish Engulfing) or a bounce confirmation before entering a long position.
- In a Downtrend: Similarly, wait for price to rally back to a key resistance area (e.g., previous support turned resistance, a major moving average, or a Fibonacci retracement level). Look for bearish candlestick patterns (like a Shooting Star or Bearish Engulfing) or rejection confirmation before entering a short position.
II. The Core of High-Probability Trading: Identifying and Utilizing Key Price Zones
Market price movements are not random; certain historical price levels or zones frequently act as battlegrounds between buyers and sellers. These Support and Resistance (S/R) levels are crucial for building high-probability trading strategies in BTC perpetual futures.
-
Understanding S/R: Areas of Supply and Demand Imbalance
- Support: A price level where buying interest is strong enough to prevent the price from falling further, often leading to a rebound. Historical lows, gaps, and significant psychological round numbers (e.g., $70,000 for BTC) frequently act as support.
- Resistance: A price level where selling interest is strong enough to halt an advance and potentially push the price lower. Historical highs, gaps, and psychological round numbers often serve as resistance.
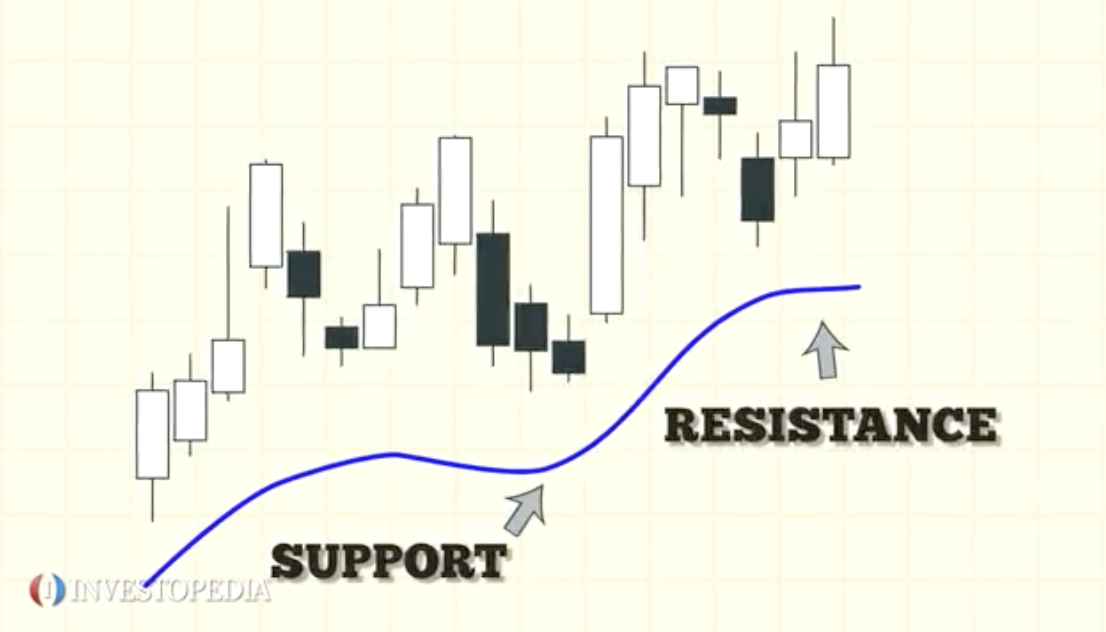
Image: Investopedia
-
Practical Application: Drawing and Validating S/R
- Accurate Identification: Draw S/R levels based on multiple price touches or reaction points on your chart. Consider using zones rather than single lines to account for market noise. The more times price respects a particular zone, the stronger and more reliable it is.
- Role Reversal Principle: A critical concept in S/R. Once a resistance level is decisively broken, it often transforms into a new support level. Conversely, a broken support level can become new resistance. This "flip" often provides high-probability entry points upon a retest of the newly flipped S/R zone.
- Volume Confirmation for S/R: Volume is an invaluable tool for validating S/R strength and potential breakouts.
[At Support] A bounce off support with increasing buying volume indicates strong demand at that level.
[At Resistance] A rejection from resistance accompanied by increasing selling volume suggests strong supply.
[Breakouts] A genuine breakout (above resistance or below support) should ideally be accompanied by a significant surge in trading volume. A "fakeout" (a false breakout) often occurs on low volume, signaling that the move lacks conviction and could reverse.
III. Validating High-Probability Setups: Volume and Momentum Confirmation
While price action and S/R levels are foundational, integrating other indicators helps confirm the reliability of your trading signals and reduces the chances of falling into traps.
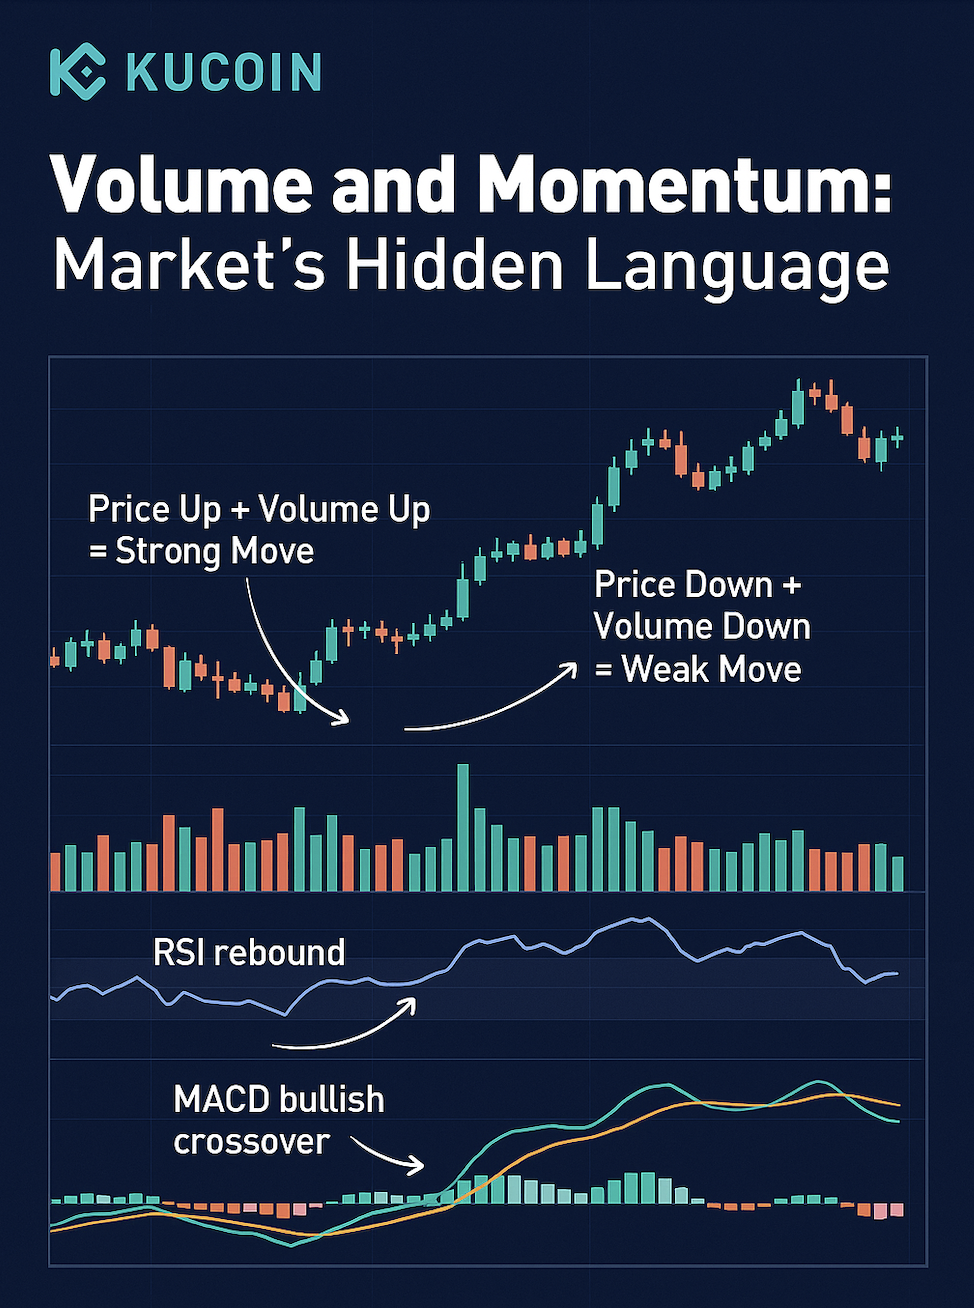
Volume: The Market's Conviction Meter
Volume offers profound insight into the strength and conviction behind price movements. In a healthy uptrend, upward price moves should be accompanied by increasing volume, while pullbacks should see decreasing volume. This confirms robust buying interest and weak selling on corrections.
Conversely, for a downtrend, strong volume on downward moves and weak volume on rallies indicates a healthy bearish trend. Beyond trend confirmation, volume is vital for validating breakouts. A true breakout from a range or S/R level demands a significant increase in volume, confirming that major market participants are committing to the new direction. A low-volume "breakout" is a critical warning sign.
Additionally, volume divergence, where price makes a new high (or low) but volume fails to follow, often suggests waning momentum and hints at a potential impending reversal.
Momentum Oscillators: RSI and MACD
Momentum indicators like the Relative Strength Index (RSI) and Moving Average Convergence Divergence (MACD) can confirm the strength of a trend, identify overbought/oversold conditions, and signal potential divergences.
- RSI: Readings above 70 indicate overbought conditions (potential for pullback/reversal), while readings below 30 indicate oversold conditions (potential for bounce/reversal). However, in strong trends, RSI can remain in overbought/oversold territory for extended periods; use it in conjunction with other signals.
- MACD: The crossing of the MACD line over its signal line can be used as a buy or sell signal. More importantly, divergence between price and MACD (e.g., price makes a new high but MACD makes a lower high) often indicates weakening momentum and a potential trend reversal, offering high-probability counter-trend opportunities or warnings.
For detailed information, please refer to Trading 101: Combining The MACD and RSI Indicators To Trade Cryptos Effectively >>>
IV. Holistic Approach: Combining Techniques for Optimal Entries
The highest probability trades emerge not from relying on a single indicator, but from the confluence of multiple signals aligning across different analytical tools. This integrated approach allows for a more robust trading plan.
-
Establish the Dominant Trend: Use larger timeframes and MA systems.
-
Identify Key Support and Resistance Zones: Plot these on your chart, recognizing their potential role reversal.
-
Wait for Price to Approach a Key Zone: Be patient; don't chase trades.
-
Look for Confluence:Does price action at the S/R level confirm your bias (e.g., bullish candlestick at support in an uptrend)?Is there volume confirmation (e.g., increased buying volume on a bounce from support)?Are momentum indicators aligning (e.g., RSI bouncing from oversold territory, MACD bullish cross)?Consider a retest of a broken S/R level for a higher-probability entry.
-
Define Your Risk: Before entering, identify your stop-loss level (the price where your trade idea is invalidated). This is non-negotiable.
-
Set Profit Targets: Identify the next logical resistance/support level as your take-profit target, ensuring a favorable risk-to-reward ratio (ideally 1:2 or better).
V. The Platform for Execution: Tools and Features
To effectively implement these high-probability techniques in BTC perpetual futures, choosing a feature-rich and reliable trading platform is paramount. Look for platforms that offer advanced charting tools with customizable indicators, deep liquidity to ensure efficient order execution, and a variety of robust order types, including market, limit, stop-loss, and conditional orders, to manage your positions precisely. Transparent funding rates are also important for managing holding costs over time.
For those ready to explore BTC perpetual futures and apply these strategies, you can find a comprehensive trading interface on our website here: https://www.kucoin.com/futures/trade/XBTUSDCM