
Trading 101: Combining The MACD and RSI Indicators To Trade Cryptos Effectively in 2026
Introduction
As the crypto market matures in 2026, momentum-based trading strategies have become increasingly important due to the rise of algorithmic trading, AI-powered trading bots, and high-frequency volatility around macroeconomic and geopolitical events. Traders are no longer relying on a single indicator alone. Instead, combining momentum indicators like the Relative Strength Index (RSI) with trend-following indicators such as the Moving Average Convergence Divergence (MACD) has become a widely adopted strategy for identifying high-probability setups across Bitcoin, Ethereum, altcoins, and meme coin markets.
The MACD and RSI combination remains especially popular among crypto traders because it helps filter out false signals during volatile market cycles. Whether trading spot markets or crypto futures, traders often use this double-confirmation strategy alongside volume analysis, support and resistance zones, and candlestick structures to improve risk management and trade timing.
Moving Average Convergence Divergence (MACD)
MACD is a trend indicator. The construction of the MACD indicator is based on the difference between two exponential moving averages (EMAs).
With the default settings of the MACD, you can create the MACD line and the signal line.
MACD Line = 12-Day Simple Moving Average (EMA) – 26-Day Simple Moving Average (EMA)
Signal Line = 9 Days Single Moving Average (EMA) of the MACD Line
Of course, with the advent of the internet and technology, all these calculations occur in the back-end of your trading platform. Here are the rules for trading MACD.
MACD settings: use the following MACD default settings:
- Fast EMA:12
- Slow EMA: 26
- Smoothed: 9 (signal line)
Long Trade Setup with MACD
- The MACD crosses above the signal line.
- The MACD histogram crosses above the zero line.
- Go long when the MACD crosses over its signal line, but only when the subsequent candle is bullish.
Short Trade Setup with MACD
- The MACD crosses below the signal line.
- The MACD histogram crosses below the zero line.
- Sell when the MACD crosses below its signal line, but only when the subsequent candle is bearish.
In crypto markets, MACD signals tend to work best on higher timeframes such as the 4-hour, daily, and weekly charts because lower timeframes can generate excessive noise during periods of high volatility. Many professional traders also combine MACD crossovers with trading volume spikes and key breakout levels to confirm market momentum before entering a position.
During strong bull markets, the MACD may remain above the zero line for extended periods, while prolonged bearish phases can keep the indicator below zero for weeks or even months. Understanding broader market context is therefore critical when interpreting MACD signals in crypto trading.
The Relative Strength Index (RSI)
As the name suggests, the RSI is used to determine the momentum (i.e., strength) of a trend. The indicator is made up of a line that oscillates between 0 and 100. Typically, when the RSI is above 70, the market is regarded as overbought, but it is said to be oversold when it’s below 30.
The RSI captures the strength of price movement relative to time and the momentum of the rise or fall of a market movement. The Relative Strength Index provides information about whether a market is in the overbought zone or the oversold zone.
- A market is defined as ‘overbought’ when it is above 70 on the scale of values, which means that an end to an uptrend would be expected.
- On the other hand, a market is defined as ‘oversold’ if it is below 30 on the scale of values, which means that an end to a downward trend would be expected.
- A value above 50 indicates that the strength of the buyers predominates, so prices rise; a value below 50 indicates that the sellers dominate and that prices fall accordingly.
The RSI indicator has a value scale from 0 to 100 and refers to the ratio of an average price increase to an average price decline. These averages are calculated like the exponential moving average before the relative strength is converted into an index that fluctuates between 0 and 100.
In highly volatile crypto markets, the RSI can remain in overbought or oversold territory much longer than traders initially expect. This is especially common during parabolic rallies driven by market hype, ETF-related news, meme coin speculation, or large-scale institutional inflows.
Because of this, experienced traders often avoid using RSI as a standalone reversal indicator. Instead, they combine RSI readings with trend analysis, liquidity zones, and market structure confirmation before making trading decisions.
Why MACD and RSI Still Matter in the 2026 Crypto Market
Despite the emergence of AI-driven trading systems and automated market-making algorithms, MACD and RSI remain two of the most widely used technical indicators in crypto trading. This is because both indicators help traders simplify complex market behavior into measurable momentum and trend signals.
In 2025 and 2026, the crypto market has experienced multiple volatility events triggered by Bitcoin ETF inflows, interest rate expectations, geopolitical uncertainty, and rapid meme coin rotations. During these periods, traders increasingly relied on momentum confirmation strategies to avoid emotional trading and false breakout setups.
For example, when Bitcoin experiences sudden price expansion after major macroeconomic announcements, traders often monitor whether RSI strength aligns with MACD trend continuation before entering leveraged positions. This helps reduce the risk of chasing short-term market noise.
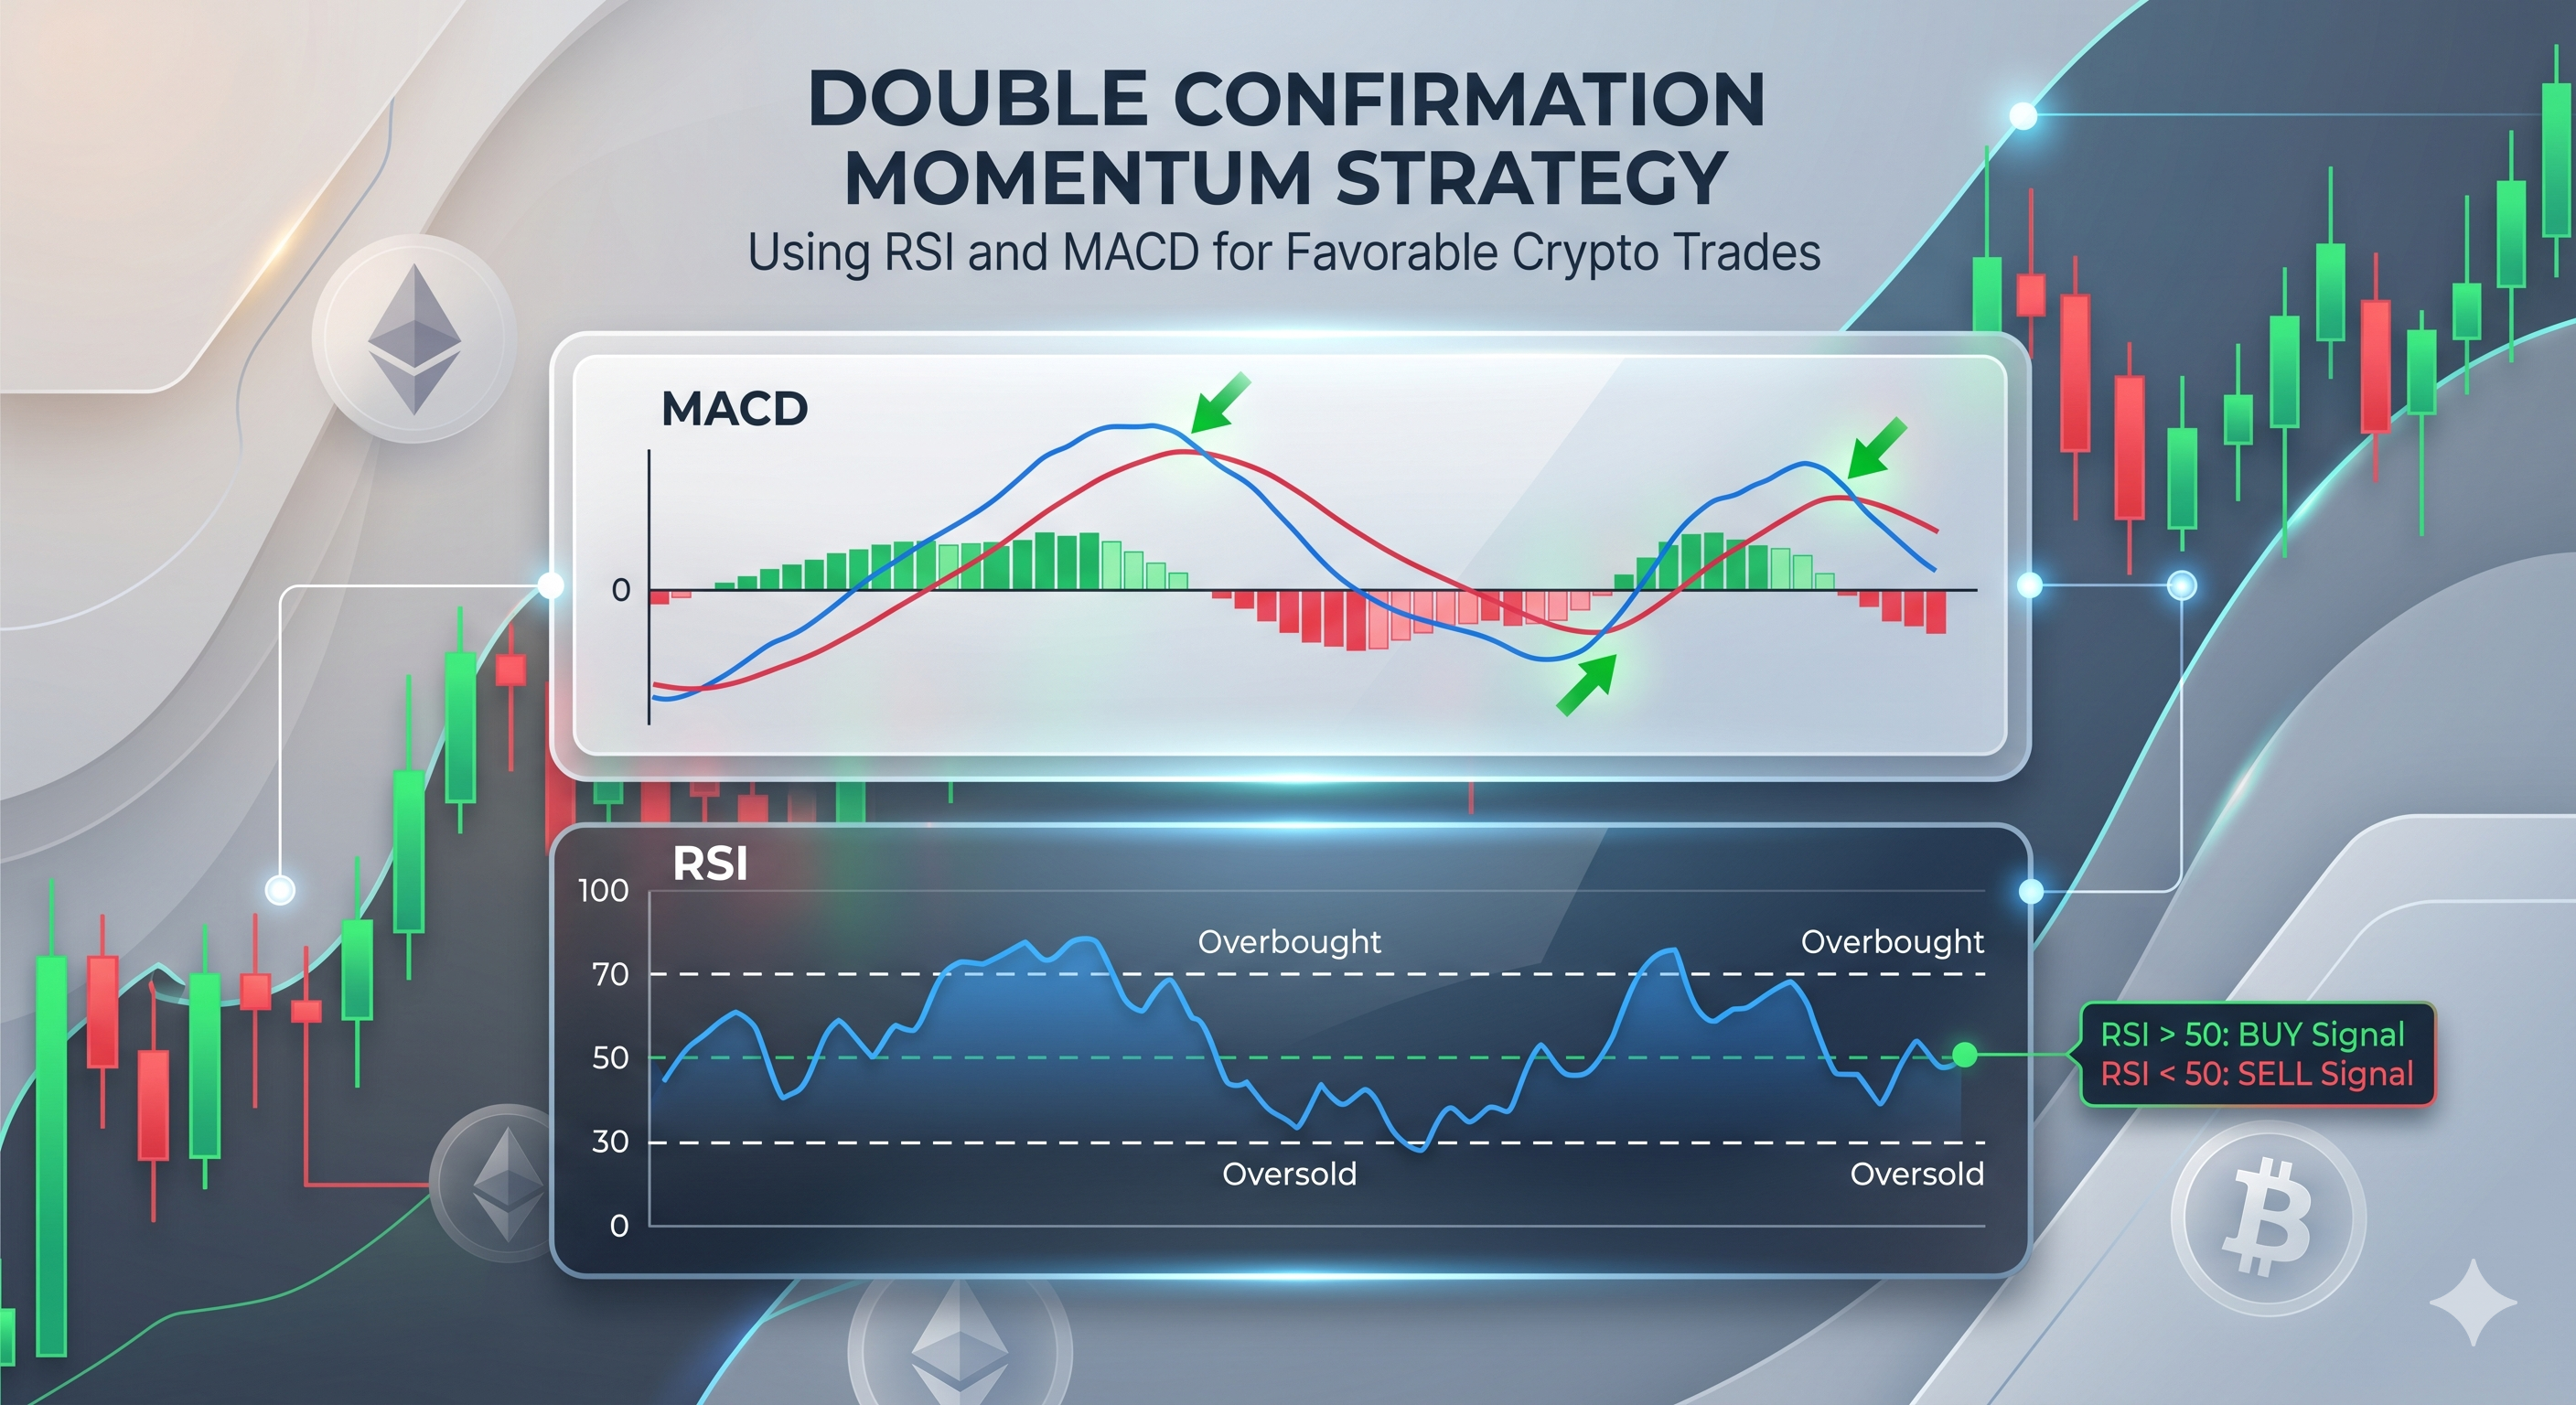
Double Confirmation Momentum Strategy Using RSI and MACD Indicators
Traders can use both the RSI and the MACD to set up a trade. When combining RSI and MACD, one waits for both indicators to give a trading signal. Here’s the general rule of thumb when using this trading strategy. The RSI gives a trading signal when the RSI line is moved away from the overbought or oversold area. The MACD gives the trading signal when the short-term MACD line intersects the long-term signal line.
The position is closed as soon as the RSI returns to an extreme range and the MACD lines cross each other again.
Buy Signal
With the RSI and MACD, the buy signal is generated when:
- The RSI has crossed above 50. It shows that the bullish momentum is picking up.
- The MACD histogram crosses above the 0-level, and the MACD line crosses above the signal line.
- Close the position when the RSI reaches 70.
As you can see in the Ethereum (ETH) price-chart, all the rules we discussed above were respected by the market and we can see a favorable market movement.
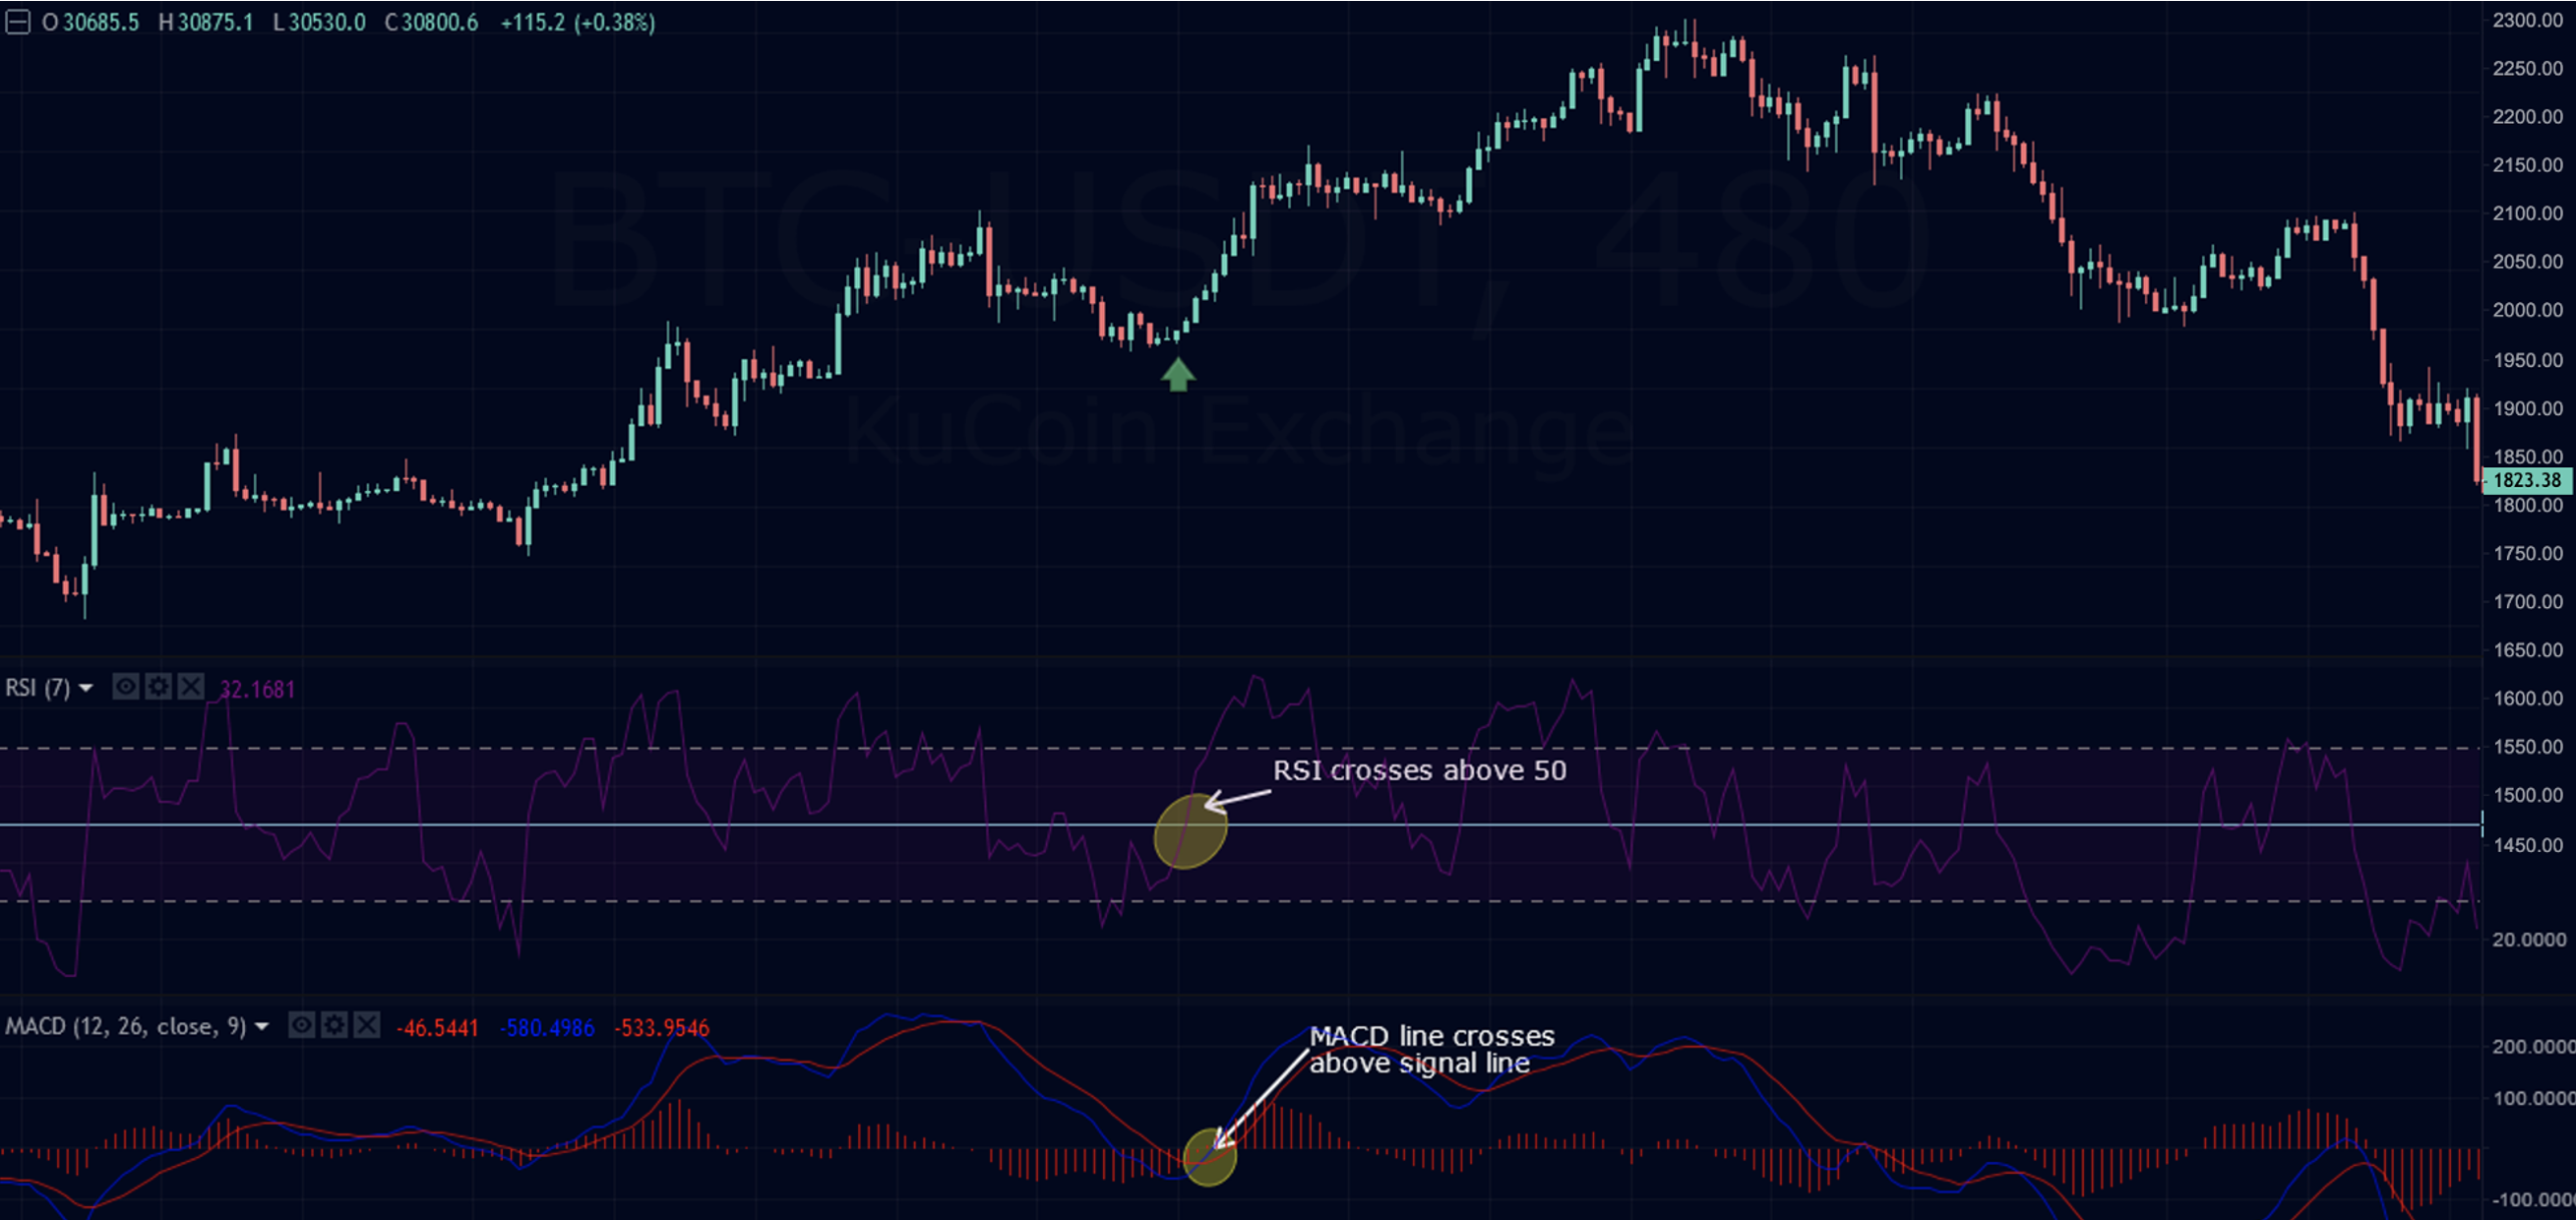
Double Confirmation Buy-Signal Example on the Ethereum Price Chart | Source: ETH/USDT
Sell Signal
With the RSI and MACD, the sell signal is generated when:
- The RSI has crossed below 50. It shows that the bearish momentum is picking up.
- The MACD histogram crosses below the 0-level, and the MACD line crosses below the signal line.
- Close the position when the RSI reaches 30.
From the below Bitcoin price chart, we can see the RSI line dropping below 50 while the histograms in MACD dropped below zero at the same time. Also, we can see the MACD line crossing below the signal line which is a clear sell signal.
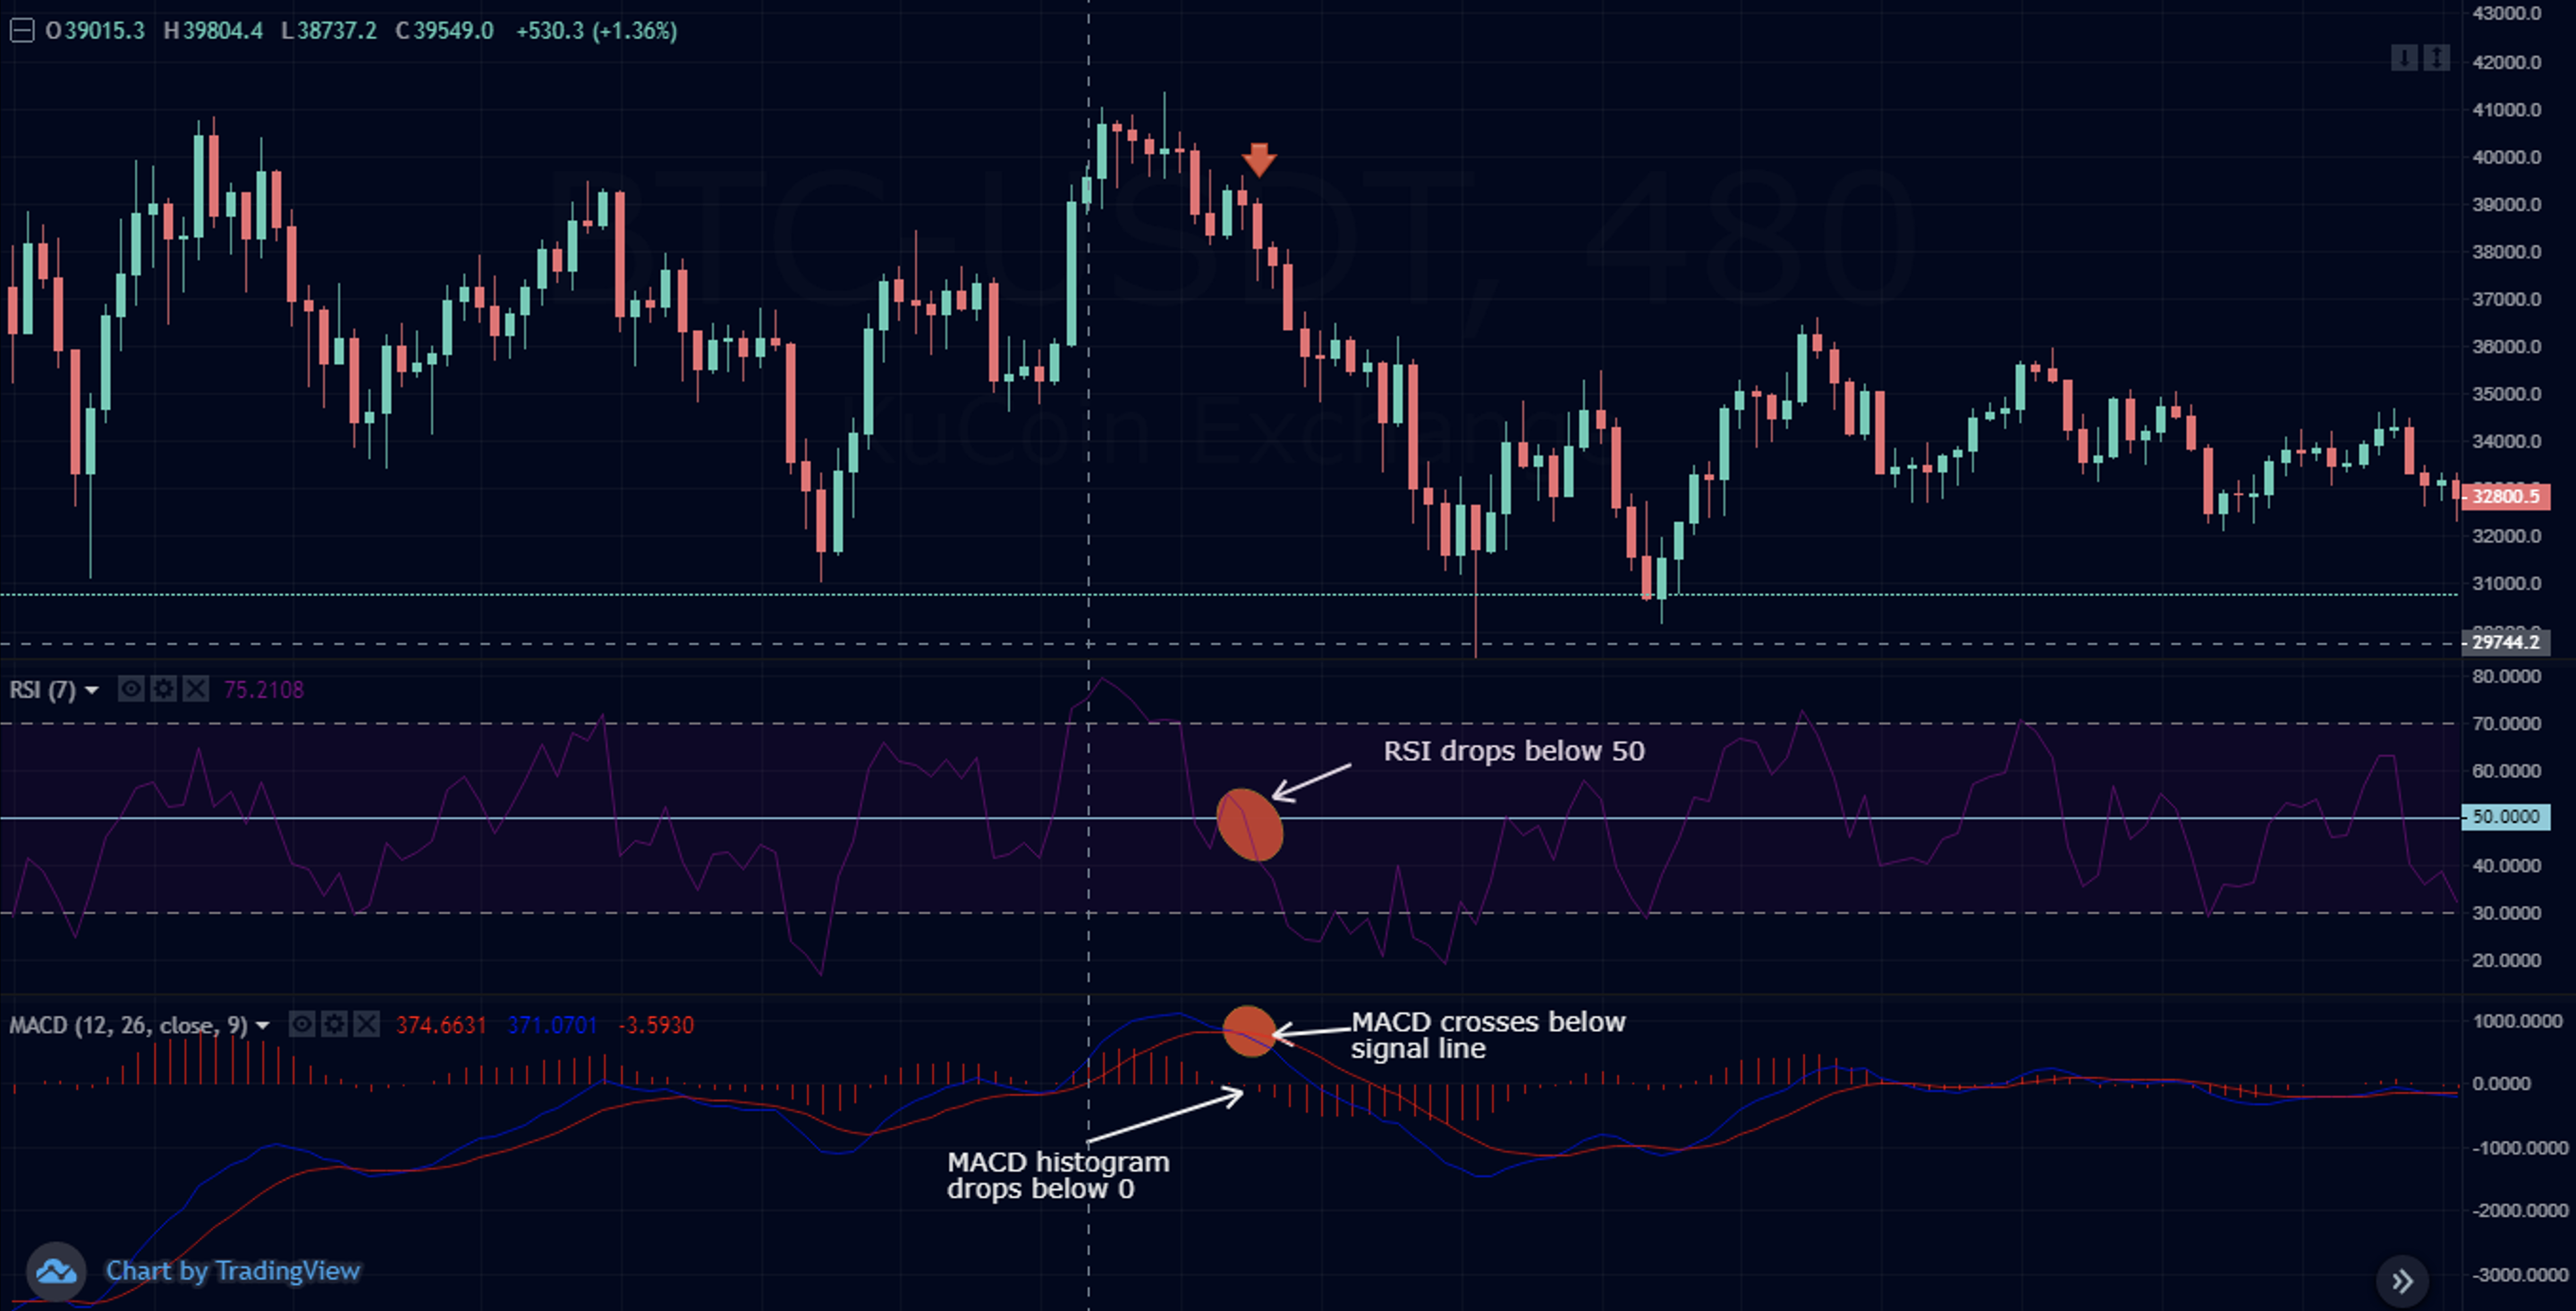
Double Confirmation Sell-Signal Example on the Bitcoin Price Chart | Source: BTC/USDT
Risk Management When Using RSI and MACD
While combining RSI and MACD can improve trade confirmation, no indicator setup guarantees success in every market condition. Crypto markets remain highly volatile, and sudden liquidity events can invalidate technical signals within minutes.
To reduce risk, traders often use stop-loss orders, position sizing strategies, and predefined risk-reward ratios when trading with RSI and MACD signals. It is also important to avoid overtrading during highly emotional market environments, especially around major news events, token unlocks, or unexpected liquidation cascades.
Many traders additionally combine RSI and MACD with support and resistance analysis, moving averages, Fibonacci retracement levels, and on-chain metrics to build a more comprehensive trading strategy.
Conclusion
The combination of MACD and RSI continues to be one of the most effective and beginner-friendly momentum trading strategies in the crypto market. By combining trend direction with momentum confirmation, traders can better identify potential entry and exit opportunities while reducing exposure to false signals.
However, successful trading requires more than simply following indicators. Modern crypto traders should also consider market structure, trading volume, macroeconomic events, and risk management before opening positions. No technical indicator works perfectly in isolation, especially in fast-moving crypto markets.
As the digital asset industry evolves in 2026, traders increasingly rely on multi-indicator strategies, AI-powered analytics, and advanced charting tools to navigate volatility more efficiently. Whether you are trading Bitcoin, Ethereum, or emerging altcoins, understanding how RSI and MACD interact can help improve your overall trading discipline and market awareness.
FAQs
What is the best RSI setting for crypto trading?
The default 14-period RSI remains the most widely used setting in crypto trading because it balances responsiveness and reliability. However, short-term traders may use lower settings such as RSI 7 for faster signals, while swing traders often prefer RSI 21 to reduce market noise.
Is MACD better than RSI for identifying crypto trends?
MACD is generally better for identifying trend direction and momentum shifts, while RSI is more effective for detecting overbought and oversold conditions. Many crypto traders combine both indicators together to improve signal confirmation and reduce false entries.
Can RSI and MACD be used for Bitcoin and altcoin trading?
Yes. RSI and MACD are commonly used across Bitcoin, Ethereum, and altcoin markets. These indicators can help traders analyze momentum, trend continuation, and potential reversals across spot and futures trading markets.
Which timeframe works best for RSI and MACD in crypto trading?
Many traders prefer using RSI and MACD on higher timeframes such as the 4-hour, daily, and weekly charts because signals tend to be more reliable than on lower timeframes. Lower timeframes may generate more false signals during periods of high market volatility.
Are RSI and MACD enough for successful crypto trading?
No technical indicator guarantees profitability on its own. Traders often combine RSI and MACD with support and resistance analysis, volume indicators, candlestick patterns, and risk management strategies to improve decision-making in volatile crypto markets.