
Trading 101: Introduction To Crypto Chart Patterns
Introduction
Today, digital assets are no longer viewed as a niche investment class, but as a rapidly maturing financial ecosystem supported by institutional adoption, spot Bitcoin ETFs, stablecoin expansion, AI-powered trading tools, and growing global regulatory clarity. Despite periods of volatility, crypto trading activity remains strong as traders continue seeking opportunities across Bitcoin, altcoins, memecoins, AI tokens, DeFi assets, and emerging narratives. This phenomenon has lured the world into the crypto market space in some way or the other. We have seen millions of new addresses (both Bitcoin & major altcoins) being registered and significant growth in the trading volume.
Among the many ways to participate in the crypto economy — including HODLing, staking, lending, yield farming, and mining — crypto trading remains one of the most active and potentially profitable approaches. Trading involves buying and selling digital assets to capitalize on price movements, and one of the most widely used methods for identifying these opportunities is technical analysis.
Pattern trading is a core component of technical analysis and remains highly popular among crypto traders in 2026. By learning how to identify and interpret chart patterns, traders can better understand market psychology, anticipate potential breakouts or reversals, and improve their trade execution. In modern crypto markets, where volatility can rapidly shift between trending and range-bound conditions, chart patterns continue to serve as valuable tools for navigating uncertainty.
In this educational series, we explore some of the most reliable and widely used crypto chart patterns. This article covers the fundamentals of crypto chart patterns, why traders use them, the major pattern categories, and the advantages and limitations of pattern-based trading.
What Are Crypto Chart Patterns?
Many novice crypto traders get confused between crypto chart patterns and the typical candlestick patterns. The fundamental difference between the former and the latter is the number of candles involved in forming a pattern. Previously, we have discussed the continuation and reversal candlestick patterns where one to four candles are involved. But in a crypto chart pattern, many candles are involved. This number can range between 20 candles to 200 candles and sometimes beyond that as well.
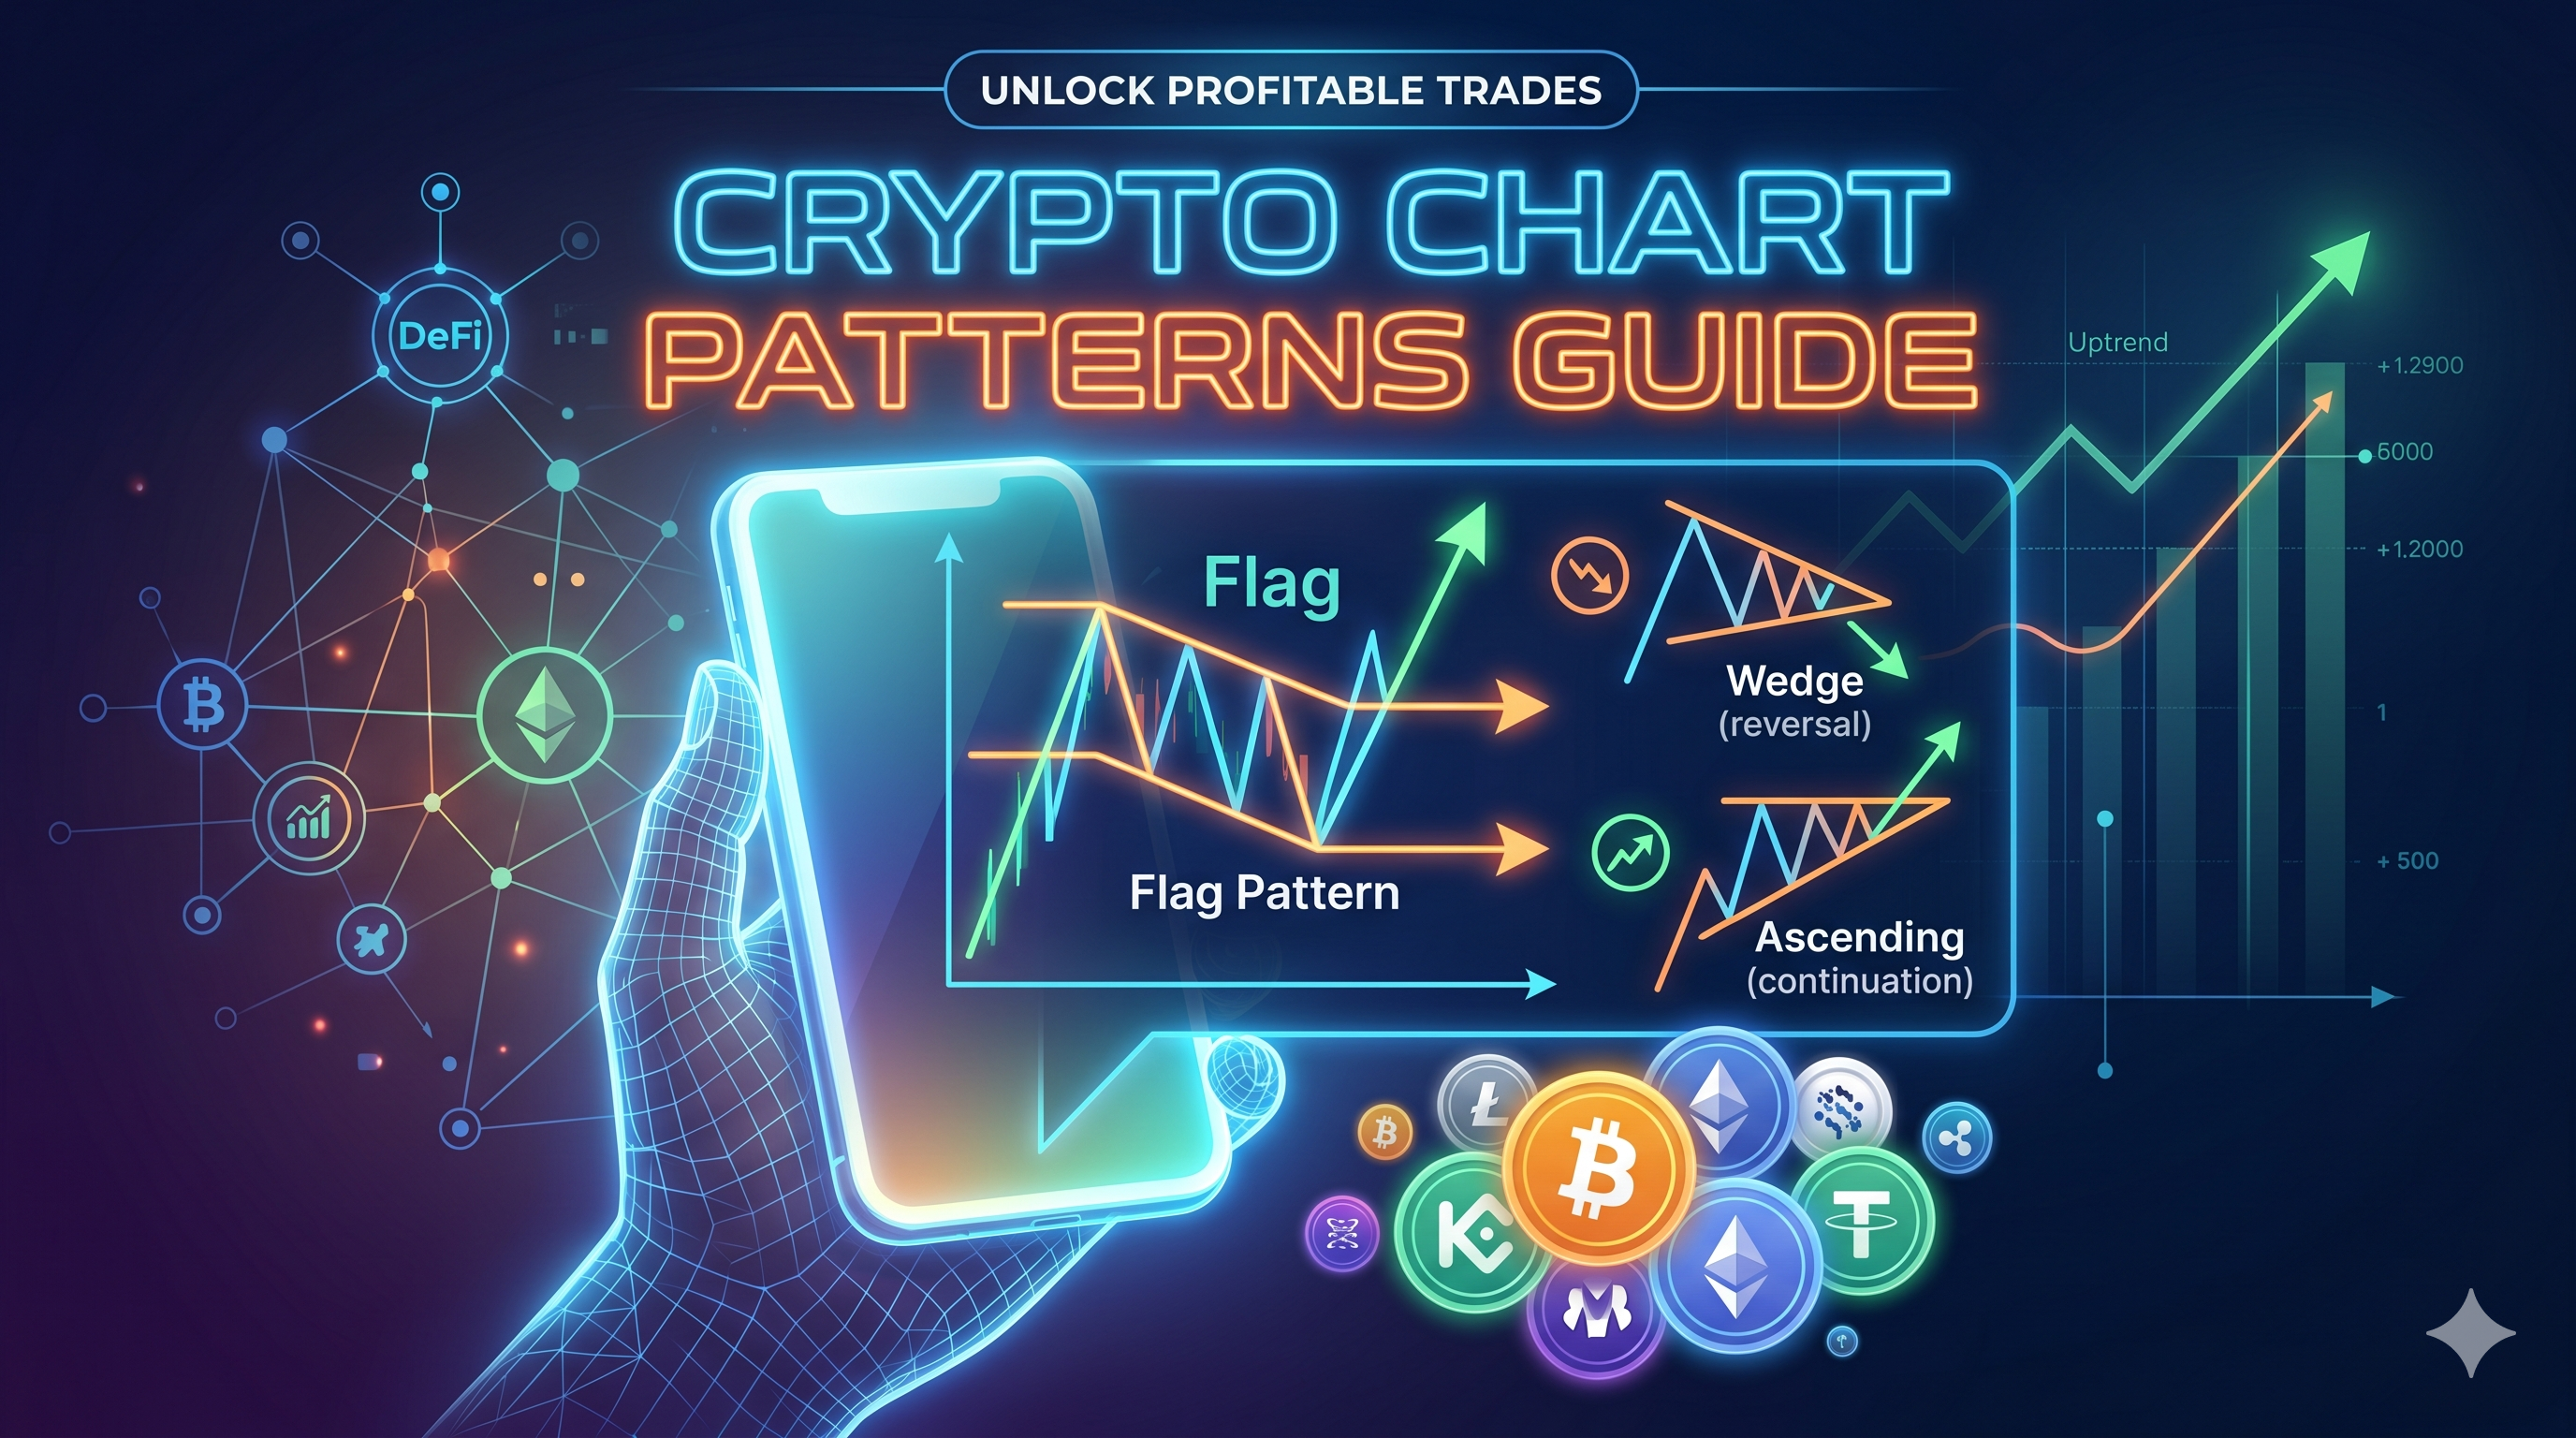
The price of any crypto asset moves in three different stages - Trends, Ranges & Channels. While the price moves in these three market states, technical traders have identified certain patterns on the price charts that resemble the things we see in our daily life. One best example of this could be the Flag pattern This pattern is formed when a group of candlesticks combines to form a flag-like structure.
After rigorous back-testing, many professional traders across the globe have certified the validity of these patterns and assigned certain rules for each of them to be valid. Following these rules in pattern trading is essential, and if you fail to do so, there is a strong chance of facing significant losses.
The Purpose of Using Crypto Chart Patterns
According to expert opinions, recognizing and perfectly trading a chart pattern can yield way more profits in crypto trading than any other method. Using fundamental analysis for crypto trading would only make sense for swing traders. It is impossible for day traders and scalpers to trade the markets using crypto fundamentals as the time frames are too short. Chart patterns can be found in any trading timeframe. Be it 15 min, 4 hours, or daily time frame; we can find and trade these patterns to make instant profits.
Also, these patterns help crypto traders in determining the strength of an existing trend during critical market movements while helping them decide market entries and exits. Patterns make things easy for novice crypto traders as they help them understand the future direction of the price. Along with this, a deeper understanding of the reason behind any pattern formation will help you in differentiating a real and a false breakout when it occurs. More about this will be discussed in the upcoming articles in this series.
Crypto Chart Pattern Types
Crypto chart patterns are classified into three different types based on their impact on the crypto asset's price after their appearance. They are:
- Trend Continuation Patterns
- Trend Reversal Patterns
- Neutral Patterns
As the name suggests, the formation of a trend continuation pattern in a crypto asset implies that the existing trend will continue. Likewise, the appearance of a trend reversal pattern means the existing trend is weakened, and a reversal can be expected soon. If this pattern occurs in an uptrend, there is stable infrastructure now where you can short cryptos. Trading the neutral patterns is tricky. The development of these kinds of patterns on a price chart indicates that the price might go in any direction. Therefore, we must be cautious while trading the Neutral Patterns.
Popular Chart Patterns You Must Know
Trend Continuation Patterns
Trend Reversal Patterns
Neutral Patterns
Note: A detailed explanation of the patterns mentioned above and how to identify and trade them will be discussed in individual articles of each of the patterns. So keep watching this space - KuCoin blog.
Conclusion
As simple as they sound, pattern trading skill is the most appropriate example of “easy to learn but difficult to master.” It is important to dedicate a significant amount of time to learning a pattern, knowing its rules, applying them on a demo account in different timeframes, and on different asset classes. The more you are closer to mastering these patterns, the more confident you will be while trading them and dismissing any possible fake-outs. Stay tuned for more articles on reliable crypto chart patterns and how to trade them. All the best!
FAQs
Are crypto chart patterns reliable?
Crypto chart patterns can be useful tools for identifying potential market trends and trading opportunities, but they are not guaranteed predictors of future price movements. Their reliability often depends on market conditions, trading volume, confirmation signals, and proper risk management. Many traders combine chart patterns with technical indicators such as RSI, MACD, moving averages, and volume analysis for better accuracy.
Can beginners use crypto chart patterns?
Yes. Crypto chart patterns are commonly used by beginner traders because they provide a visual way to understand market behavior. However, beginners should first learn the rules of each pattern, practice on demo accounts, and avoid relying solely on patterns without using risk management strategies.
Which timeframe is best for chart pattern trading?
Chart patterns can appear on nearly every timeframe, including 15-minute, 1-hour, 4-hour, daily, and weekly charts. Shorter timeframes are often used by day traders and scalpers, while higher timeframes are generally preferred by swing traders and long-term investors because they may provide more reliable signals.
What causes false breakouts in crypto trading?
False breakouts happen when the price briefly moves above or below a chart pattern before reversing direction. Common causes include:
-
Low market liquidity
-
Sudden news events
-
Whale manipulation
-
Weak trading volume
-
High market volatility
Traders often wait for candle close confirmations and volume increases before entering trades to reduce the risk of false breakouts.
Are chart patterns useful in Bitcoin trading?
Yes. Chart patterns are widely used in Bitcoin trading as well as altcoin trading. Since Bitcoin often influences the broader crypto market, many traders closely monitor Bitcoin chart formations to anticipate market-wide sentiment changes.
What is the difference between chart patterns and candlestick patterns?
Candlestick patterns are usually formed using one to four candles and focus on short-term price action signals. In contrast, chart patterns are larger market structures formed over many candles and often indicate broader trend continuation or reversal setups.
Can AI trading bots recognize crypto chart patterns?
Yes. Many modern AI-powered trading systems and algorithmic trading bots can automatically detect chart patterns using machine learning and technical analysis algorithms. However, even AI-based systems are not always accurate and still require proper risk controls and market monitoring.
Where can I analyze crypto chart patterns?
Traders can analyze crypto chart patterns using advanced charting platforms such as TradingView. KuCoin users can access professional TradingView-powered charts directly through KuCoin for technical analysis and trading.