


What Is VWAP and How to Use It in Practice: A Trader’s Guide
Having a reliable benchmark for price and volume can make the difference between guesswork and informed strategy. Whether you trade equities, forex, or cryptocurrencies, understanding how price interacts with volume helps you assess not just where a market is, but where it is being supported or rejected. One tool traders rely on for this is VWAP, Volume Weighted Average Price. Unlike a simple moving average that treats all price points equally, VWAP weighs them by trading volume.
This gives a more accurate reflection of the true average price participants are paying throughout a trading session. Institutional traders, algorithms, and execution desks use VWAP not only to understand market action but also to guide entry and exit decisions. By blending price and volume into one metric, VWAP becomes both a benchmark for performance and a tactical indicator in live trading scenarios.
Thesis statement: VWAP is a volume‑weighted price benchmark that helps traders identify fair value, assess institutional involvement, and improve trade execution decisions both intraday and over multi‑period strategies.
What VWAP Means: Price Weighted by Volume, Not Time
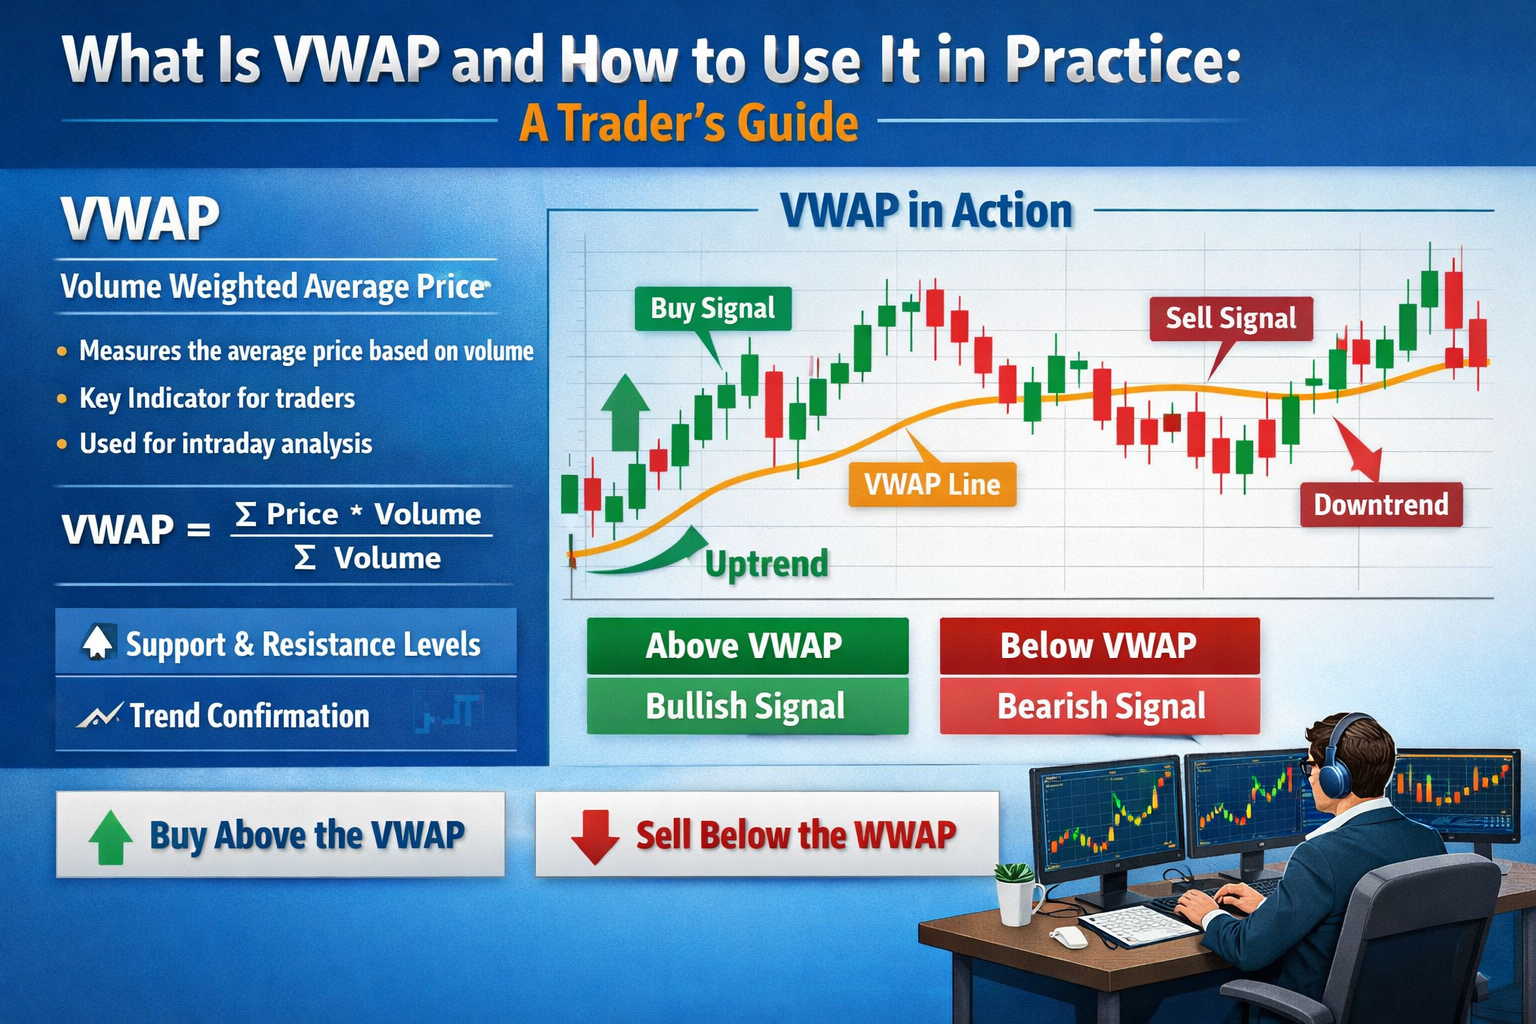
VWAP stands for Volume Weighted Average Price, and it measures the average price of a security weighted by the amount of volume traded at each price level over a specific period, usually a single trading session. The mathematical concept is simple: prices at which more shares are traded matter more to the average than prices at which fewer shares change hands. This differs from time‑based averages like the Simple Moving Average (SMA), where every price point is treated equally regardless of volume.
In practice, VWAP calculates the total traded value (price × volume at each transaction) divided by the total traded volume across the time window. The result is a single line that often acts like a gravity point for price in active markets. Because institutions and algorithmic traders frequently use VWAP as a benchmark for trade execution, price tends to oscillate around this line, especially during the first half of a session.
Traders watching VWAP are essentially asking: “At what price did most of the trading actually occur?” Unlike raw price data, which can be skewed by small volume spikes, VWAP gives you a real picture of where real money changed hands and how price relates to that liquidity footprint during the day.
How VWAP Is Calculated: A Step‑by‑Step Walkthrough
VWAP’s calculation may look intimidating at first, but its logic is intuitive once broken down. The basic idea is to cumulate volume‑adjusted price over time and divide it by the total volume.
Let’s walk through the calculation conceptually:
-
At each trade interval, multiply the typical price (often taken as “close” or the actual trade price) by the traded volume during that interval. This gives you the dollar volume for each period.
-
Sum up these dollar volumes cumulatively for all intervals up to the current point.
-
Sum the volumes cumulatively over the same intervals.
-
Divide total dollar volume by total volume to get the VWAP line for that point in time.
In formula form:
VWAP = (Σ (Price × Volume)) ÷ Σ Volume
Because this is cumulative over a defined period (usually the trading day), VWAP resets at the start of the next session in intraday analysis. In some platforms, you can also configure it to the session you care about, first 30 minutes, last hour, or multi‑day ranges.
Here’s how it works with a simple example:
-
Trade 1: 100 shares traded at $10 → dollar volume = $1,000
-
Trade 2: 200 shares traded at $10.50 → dollar volume = $2,100
-
Cumulative volume = 300 shares
-
Cumulative dollar volume = $3,100
-
VWAP = $3,100 ÷ 300 = ~$10.33
That $10.33 reading isn’t just an average price — it’s the price weighted where most trading volume happened. For intraday traders, that’s a valuable reference point for real market behavior, not just a simple mathematical average.
Using VWAP as a Trend Filter: Reading Market Sentiment
One of the most practical uses of VWAP in active trading is as a trend filter. Price relative to VWAP provides insight into market sentiment:
-
Price above VWAP suggests a bullish session, buyers are willing to pay higher prices on higher volume.
-
Price below VWAP suggests a bearish session, sellers are dominating near heavier volume areas.
Because VWAP is weighted by volume, it captures both price direction and participation intensity. This makes it more informative than static price lines alone. Many traders use it to determine whether they want to be long, short, or neutral during the trading session.
VWAP’s influence is especially strong early in the session when volume is concentrated. If price crosses above VWAP after an opening range, it often signals buyers are taking control. Conversely, breakdowns below VWAP can indicate sellers are asserting dominance.
Professional execution desks often use VWAP as a performance benchmark, they try to execute large orders at prices better than VWAP because buying above (or selling below) it signals worse execution relative to the weighed market average.
This performance‑based use reinforces the indicator’s strength: institutional traders use it as a reference, and retail or algorithmic traders use it as a sentiment barometer. The more traders that respect VWAP levels, the more self‑reinforcing it becomes as meaningful support or resistance within a session.
Entry and Exit: How Traders Use VWAP to Make Decisions
VWAP can serve as a decision filter to time entries and exits. Here’s how traders commonly use it in practice:
Trend‑Following Entries
Many intraday traders look for price crossing VWAP to confirm trend direction:
-
Bullish entry: price pulls back to VWAP and rejects lower, then moves higher.
-
Bearish entry: price rallies to VWAP, fails, and resumes downward movement.
These setups assume that if price respects the VWAP as support (above) or resistance (below), the dominant volume‑weighted sentiment will carry price further in that direction.
Confirmation and Confluence
VWAP works best in combination with other indicators like:
-
Moving averages
-
Volume bands
-
Momentum oscillators
-
Support/resistance zones
For example, an entry signal becomes more reliable if price crosses above VWAP and a short‑term moving average confirms the trend.
Exit Targets
Because VWAP represents a volume‑weighted fair value point for the day, traders sometimes use it to take partial profits:
-
If you entered long above VWAP and price starts falling toward it, you may choose to lock in gains.
-
If price rallies significantly above VWAP, you may scale out as it approaches upper volume concentration zones.
Traders also use VWAP bands (similar to Bollinger Bands) to map expected range expansion and contraction around the VWAP line, helping define exit zones with more precision.
VWAP in Algorithmic and Institutional Trading
While retail traders use VWAP for directional insight and execution timing, institutional and algorithmic trading desks treat VWAP as a core execution benchmark.
Large funds often distort markets if they execute blocks without coordination. To avoid this, execution algorithms are designed to slice large orders into smaller pieces and time them relative to VWAP. The goal is simple: execute at an average price better than VWAP over the trading session, which signals less market impact and smarter execution.
Many brokerage execution tools now offer “VWAP‑matching” algorithms that automatically pace trades based on real‑time volume. If more volume is coming through a specific timeframe, these algos execute faster; if volume dries up, execution slows, always seeking to track VWAP rather than chase price.
This institutional usage has significant implications for retail traders too: because VWAP is widely used as an internal benchmark, price action often “gravitates” toward it, creating reactive support and resistance zones. That’s part of why price tends to oscillate around VWAP: algorithms and desks are executing against it, making it a self‑fulfilling level.
VWAP in High‑Frequency and Algorithmic Trading
VWAP is particularly valuable in high-frequency trading (HFT) and algorithmic trading because it provides a volume‑weighted benchmark to pace executions and minimize market impact. HFT firms often split large orders into thousands of micro‑orders, timing them relative to VWAP to avoid pushing the price against themselves. For instance, if a desk wants to buy a million shares, executing all at once could spike the price.
By monitoring VWAP, algorithms distribute orders intelligently, targeting an average execution price better than the daily VWAP. This approach reduces slippage, the difference between expected and actual execution price, which can amount to significant savings on large trades. In crypto markets, VWAP is used similarly by bots to ensure trades align with liquidity patterns and prevent front-running by other algorithms.
Because VWAP resets each session, HFT firms constantly recalibrate their strategies to align with real-time volume distribution. Importantly, using VWAP in algorithmic systems also creates a feedback loop: the more algorithms use VWAP as a reference, the more price tends to oscillate around it, reinforcing its role as a dynamic support and resistance line. Traders seeking to replicate institutional execution can observe VWAP movements to anticipate where algorithms might act and plan entries or exits accordingly.
Multi‑Session VWAP: Tracking Trends Beyond a Single Day
While standard VWAP calculations reset daily, multi-session or cumulative VWAP allows traders to observe price-volume relationships over longer periods, such as several days or weeks. This is particularly useful for swing traders or those managing larger positions who need a broader context than intraday VWAP provides. Multi-session VWAP is calculated by cumulatively adding price × volume and dividing by cumulative volume across sessions, creating a rolling benchmark that highlights dominant price levels where most trading has occurred.
Traders use this to identify longer-term support and resistance zones: prices near multi-session VWAP may indicate institutional accumulation or distribution areas. For example, if a stock has consistently bounced above a three-day VWAP, this level can act as a strong buying zone, while repeated rejections below it signal bearish sentiment. Multi-session VWAP is particularly useful in volatile markets or when news events skew intraday price movements; it smooths out noise and provides a volume-weighted “anchor” for decision-making.
In practice, traders may combine multi-session VWAP with other technical analysis tools, like Fibonacci retracements or Bollinger Bands, to confirm trade setups. By tracking VWAP across sessions, traders gain a more strategic perspective on market behavior, aligning entries and exits with where real trading volume has historically concentrated, not just where price has briefly spiked.
Limitations and Common Pitfalls When Using VWAP
VWAP is a powerful tool, but it isn’t without limitations:
1. Intraday Focus Only
VWAP is typically calculated for a single session, meaning it resets each day. Using it as a long‑term trend gauge without adjustment can be misleading.
2. Volume Profiles Can Mislead
If volume is heavily front‑loaded or skewed by specific market events early in the session, VWAP can reflect an atypical distribution and may lag true sentiment shifts.
3. Not Useful Alone
VWAP works best in confirmation with momentum, volatility, and support/resistance measures. Using it as a sole entry signal increases false signals.
4. Futures, Crypto, and After‑Hours
VWAP calculation methods may differ on platforms depending on whether pre‑market, post‑market, or multi‑session data is incorporated. This inconsistency can affect signals unless you configure the VWAP settings carefully.
Seasoned traders learn to interpret VWAP contextually, as one piece of the execution and sentiment puzzle, not a standalone truth.
Real‑World Example: Using VWAP in a Live Trade Scenario
Imagine a stock opens with heavy volume and gapping higher on news. As the session begins, price rallies but then pulls back toward VWAP. A trader watching VWAP sees that the price:
-
Touches VWAP and stalls
-
Fails to break below it with significant volume
-
Starts to rally again as volume picks up
This sequence suggests volume‑weighted buying pressure is in control. The trader enters long with a stop just below VWAP, reasoning that if price drops below the volume‑weighted average, bearish sentiment is increasing.
Throughout the session, the trader:
-
Monitors price relative to VWAP
-
Scales out partial profits when price exceeds defined thresholds above VWAP
-
Uses VWAP breaches as stop‑loss cues
This type of disciplined approach, blending execution discipline with trend assessment, can help manage risk and tilt odds in a trader’s favor.
FAQs
1. What does VWAP stand for?
VWAP stands for Volume Weighted Average Price, a price benchmark that incorporates volume into the average.
2. Is VWAP only for day trading?
VWAP is most effective intraday, though some extended or multi‑session VWAP methods exist.
3. How does VWAP differ from moving averages?
VWAP weights price by volume, while moving averages weight all prices equally over time.
4. Can VWAP be used in crypto?
Yes, VWAP applies to any tradable market where volume and price data exist, including stocks, crypto, and futures.
5. Does VWAP replace other indicators?
No, it works best in conjunction with trend and momentum indicators.
6. Why do institutions care about VWAP?
It’s a core execution benchmark, trading better than VWAP generally signals effective order execution with minimal market impact.
Disclaimer
This content is for informational purposes only and does not constitute financial or investment advice. Trading carries risk. Please do your own research (DYOR).