

Stablecoin Market Cap Drops $7.7 Billion in June 2026: Largest Decline in 4 Years as Trading Volume Hits Record $1.79 Trillion
2026/07/28 15:15:00
Introduction
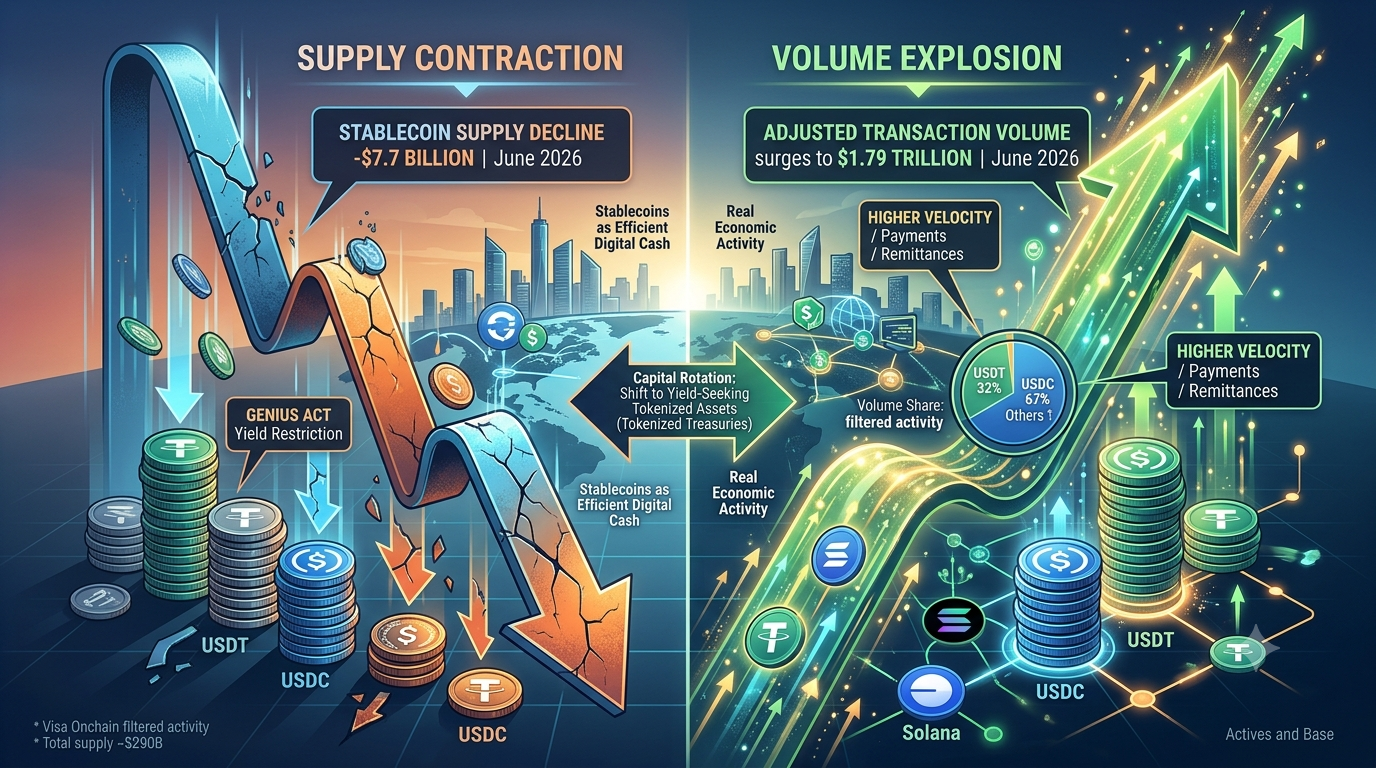
Stablecoin market capitalization fell by $7.7 billion in June 2026, the steepest monthly decline since the Terra collapse in 2022, while adjusted trading volume surged to an all-time high of $1.79 trillion. According to data from early July 2026, total stablecoin supply dropped from a May peak near $300 billion to around $290 billion.
At the same time, real economic activity measured by adjusted transaction volume jumped 63 percent month-over-month and 125 percent year-over-year. This divergence highlights a shift away from idle holdings toward active payments and yield-seeking alternatives after the GENIUS Act restricted interest on payment stablecoins.
What Caused the Largest Stablecoin Market Cap Drop in Four Years?
The $7.7 billion contraction in June 2026 stemmed primarily from regulatory changes that eliminated yield on payment stablecoins and redirected capital into higher-yielding tokenized products. In mid-July 2026, the decline represented the largest dollar drop since May 2022 and the biggest percentage retreat (roughly 3 percent from the May peak) since 2023.
Tether’s USDT led the reduction, falling from approximately $190 billion to $184 billion. Circle’s USDC declined from near $80 billion levels in some tallies to around $74 billion. Combined, these two assets accounted for the bulk of the outflow. The GENIUS Act of 2025, which took full effect in subsequent rulemaking through 2026, prohibits permitted payment stablecoin issuers from paying interest or yield solely for holding the tokens. Holders responded by moving idle balances into tokenized U.S. Treasury funds that continue to offer yields near 4 percent.
Tokenized Treasury products expanded rapidly during the same period. According to data referenced in July 2026 reports, the category grew from about $11 billion in March to nearly $16 billion. Circle’s USYC overtook BlackRock’s BUIDL in size, while JPMorgan-linked products recorded monthly gains exceeding 80 percent in some months. This rotation reduced the circulating supply of pure payment stablecoins without indicating a loss of confidence in the assets themselves.
Market observers noted that the drop remained modest compared with the 26 percent collapse seen in 2022. Supply simply reallocated rather than exited the broader crypto ecosystem.
Why Did Stablecoin Trading Volume Reach a Record $1.79 Trillion in June 2026?
Adjusted stablecoin transaction volume hit $1.79 trillion in June 2026 because real-world payment and settlement activity accelerated even as total supply contracted. Visa Onchain Analytics, which filters out bot traffic, internal exchange transfers, and other non-economic movements, recorded the figure as a new monthly high, surpassing the previous record of $1.78 trillion set in February 2026. The total rose 63 percent from May’s $1.1 trillion and 125 percent from roughly $795 billion in June 2025.
USDC captured the majority of this activity. According to Visa data released in early July 2026, Circle’s stablecoin accounted for approximately $1.21 trillion, or 67 percent of adjusted volume. USDT followed with about $576 billion, or 32 percent. PayPal’s PYUSD registered a distant third place at $2.42 billion. Over the first half of 2026, USDC’s share of adjusted volume reached roughly 70 percent while USDT held near 25 percent, reversing earlier dominance patterns.
Higher velocity explained the volume surge. Stablecoin turnover reached about six times per month—double the rate recorded two years earlier. Visa’s quarterly calculations showed even higher annualized figures of 13.56 turns, far exceeding the 1.65 turns typical of U.S. M1 money supply. Networks such as Solana and Base processed large shares of USDC transfers, supporting faster and cheaper settlement for payments, remittances, and on-chain finance.
First-half 2026 adjusted volume totaled $8.82 trillion, underscoring sustained demand for stablecoins as transactional rails rather than static stores of value.
How Does the GENIUS Act Influence Stablecoin Holdings and Activity?
The GENIUS Act drives both the market-cap contraction and the volume expansion by clarifying the role of payment stablecoins as pure transactional instruments. Enacted in July 2025 and implemented through OCC proposed rules in early 2026, the law restricts issuers from offering interest or yield on payment stablecoins. It also establishes reserve and licensing requirements that favor regulated entities.
As a result, holders no longer leave large balances idle in USDT or USDC expecting returns. Instead, they rotate into tokenized Treasury funds that pass through government yields while remaining on-chain. This movement lowers measured market capitalization of traditional stablecoins yet increases their transactional usefulness. Issuers and platforms compete on payment speed, cost, and integration rather than yield.
Analysts from Citigroup and others project that payment-driven adoption could still lift total stablecoin market capitalization toward $1.9 trillion by 2030, provided regulatory clarity continues to support institutional use. The June 2026 data already shows the early effects of this transition: lower idle supply paired with higher genuine activity.
What Do Higher Stablecoin Turnover Rates Signal for Market Health?
Elevated turnover rates demonstrate that stablecoins function increasingly as working capital rather than speculative parking spots. A monthly turnover of six times means each dollar of supply supports six dollars of economic activity. Visa’s adjusted metrics confirm that a growing portion of this activity involves deposits, withdrawals, cross-border transfers, and settlements rather than pure trading churn.
Compared with traditional banking measures, the difference is stark. U.S. M1 turns over far more slowly. The contrast positions stablecoins as efficient digital cash for global users who value speed and low fees. USDC’s rising volume share further indicates institutional preference for regulated, fully reserved tokens on high-throughput chains.
These patterns reduce concerns that the market-cap drop signals systemic weakness. Capital remains inside the broader digital-asset ecosystem, simply moving to instruments better suited for yield while payment stablecoins handle the transactional layer.
How Are USDT and USDC Performing Differently Amid the Shift?
USDT retains the largest market capitalization while USDC dominates transactional volume. At the end of June 2026, USDT still held the majority of total stablecoin supply near the $184 billion level. USDC, however, processed roughly two-thirds of adjusted activity.
This divergence reflects different user bases. USDT continues to serve as the primary trading pair on many centralized and decentralized venues, especially outside the United States. USDC benefits from stronger regulatory alignment under frameworks such as the GENIUS Act, deeper integration with traditional finance, and higher activity on chains favored by institutions and payment applications.
Both assets remain fully backed and redeemable at par according to their issuers’ disclosures. The June data simply shows specialization: USDT for liquidity depth and USDC for high-velocity payments.
Join KuCoin 9th Anniversary Trading Campaign
KuCoin is celebrating its 9th anniversary with a special platform campaign filled with exclusive rewards, trading activities, and limited-time offers. Don’t miss the chance to participate and enjoy the benefits as the exchange marks nine years of growth and innovation. Visit the official campaign page now:

Conclusion
June 2026 delivered a clear dual signal for the stablecoin sector. Market capitalization recorded its largest monthly drop in four years at $7.7 billion as the GENIUS Act’s yield prohibition pushed idle capital into tokenized Treasuries. Simultaneously, adjusted trading volume reached a record $1.79 trillion, driven by genuine payment and settlement demand and led by USDC’s 67 percent share. Higher turnover rates confirm that stablecoins are evolving into efficient transactional tools rather than static holdings. USDT continues to anchor overall supply while USDC powers most of the activity.
The rotation into yield-bearing on-chain products has not undermined confidence; it has refined the market structure. Looking ahead, continued regulatory clarity and institutional adoption remain the primary drivers of long-term growth. Traders and users monitoring these trends can access the liquidity and tools needed to navigate the changing landscape through platforms that support both major stablecoins and related digital assets.
FAQs
What was the exact size of the stablecoin market-cap decline in June 2026?
The total market capitalization fell by $7.7 billion in June 2026, marking the largest single-month drop since the Terra event in 2022.
Did the market-cap drop indicate a loss of confidence in stablecoins?
No. Capital rotated into tokenized Treasury funds offering yield near 4 percent after the GENIUS Act prohibited interest on payment stablecoins; the assets themselves retained full reserves and redemption capability.
How much did tokenized Treasuries grow during this period?
Tokenized Treasury products expanded from roughly $11 billion in March 2026 to nearly $16 billion by June, with Circle’s USYC surpassing BlackRock’s BUIDL in size according to contemporaneous reports.