
Bullish Harami Candlestick: Structure and Interpretation Guide
2026/03/10 15:12:01
Key Takeaways
-
Sentiment Shift: The bullish harami indicates that selling momentum is stalling. The containment of the smaller "baby" candle within the larger "mother" candle suggests that bears are losing control and "buy-the-dip" demand is rising.
-
Context is Crucial: This pattern only carries technical weight at the end of a prolonged downtrend or at key psychological support levels. In a sideways or "choppy" market, it is often a false signal of indecision rather than a reversal.
-
Confirmation Over Anticipation: Successful trading requires waiting for a third "confirmation" candle and a surge in trading volume. Entering a trade before the price breaks above the first candle's high significantly increases the risk of a false breakout.
What is Bullish Harami Pattern?
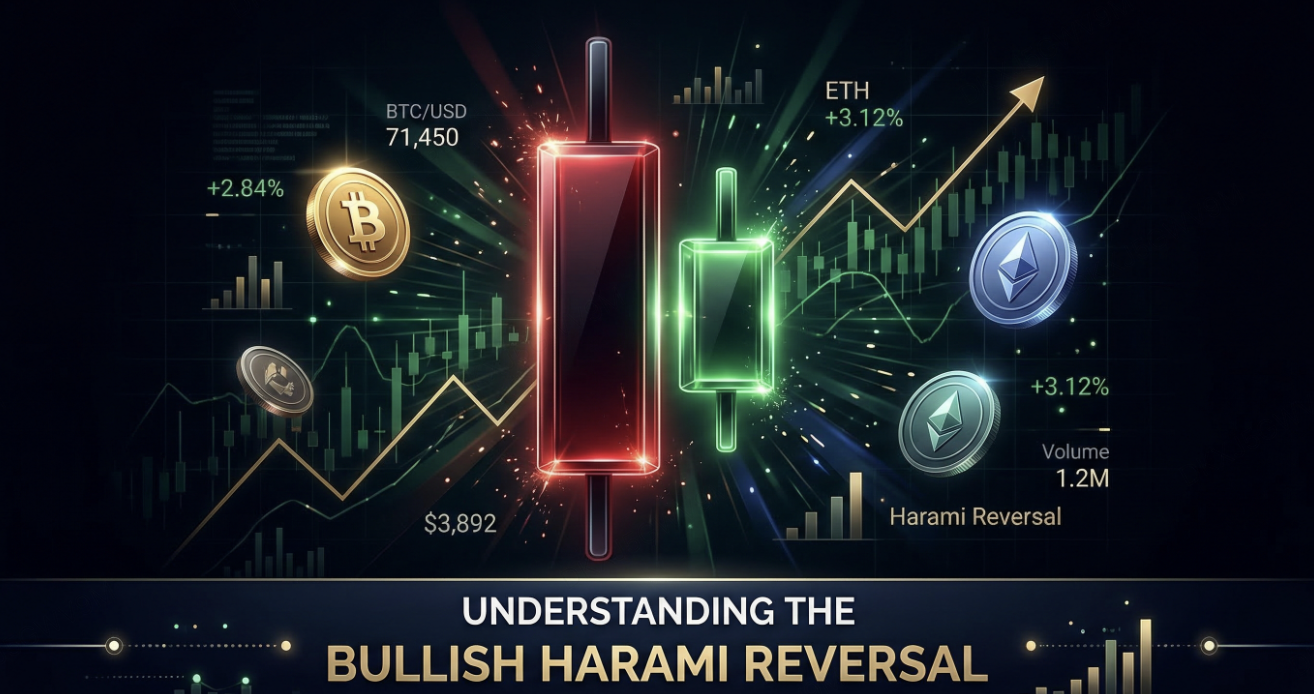
The bullish harami is a two-day reversal candlestick pattern that signals a potential shift from a downtrend to an uptrend. In the context of the volatile crypto market, this pattern occurs when a large red (bearish) candle is followed by a much smaller green (bullish) candle, the body of which is completely "contained" within the vertical range of the previous candle's body.
From a technical analysis perspective, the bullish harami indicates that selling pressure is exhausting and the bears are losing their grip on price action. Traders often view this as a "pregnant" formation—the literal translation of the Japanese word harami—suggesting that a new bullish trend is being born. To increase the reliability of this signal on our exchange charts, it is essential to look for the pattern at established support levels and wait for a confirmation candle to close higher on the following day.
What the Bullish Harami Signals About Market Behavior
The bullish harami is a powerful two-bar reversal pattern that signals a potential shift from a bearish downtrend to a new bullish cycle. In the fast-paced crypto market, this pattern is characterized by a large-bodied red (bearish) candle followed by a significantly smaller green (bullish) candle that is completely "contained" within the body of the previous day’s candle.
This formation indicates a sharp deceleration in selling momentum; as the bears fail to push prices lower than the previous open, it suggests that "buy-the-dip" sentiment is beginning to outweigh sell-side liquidity. To maximize the accuracy of the bullish harami on our exchange charts, traders should look for this pattern at key psychological support levels or in oversold territory. When confirmed by an increase in trading volume on the following candle, the bullish harami serves as a vital early-warning sign for investors looking to enter a long position before a trend reversal gains full steam.
Where the Bullish Harami Pattern Becomes Meaningful
In the high-volatility environment of a crypto exchange, a bullish harami only gains true technical significance when it appears at the terminal end of a prolonged downtrend. This two-candle reversal pattern consists of a large "mother" bearish candle followed by a smaller "baby" bullish candle completely contained within the previous body.
The bullish harami becomes a high-probability trade signal when it aligns with established horizontal support levels or psychological price floors. When the market "gaps up" or opens within the previous candle's body and fails to make a new law, it signals that sell-side liquidity is drying up. To satisfy strict SEO and technical requirements, traders should look for a surge in trading volume on the second day as a confirmation of the bullish harami, suggesting that the momentum is shifting from distribution to accumulation before a potential trend reversal.
How to trade in Bullish Harami Pattern
Trading the bullish harami on a crypto exchange requires a disciplined approach to confirm that the downtrend has truly exhausted. Because this pattern represents a contraction in volatility, successful traders do not enter a position on the second candle alone; instead, they wait for high-volume confirmation to ensure the reversal is valid.
Step-by-Step Trading Strategy:
-
Step 1: Identify the Trend: Locate a bullish harami only after a sustained move to the downside or at a major psychological support level (e.g., a previous "all-time high" support).
-
Step 2: Check the "Containment": Ensure the second candle (the "baby") is entirely within the body of the first large red candle (the "mother"). In the crypto market, this signals that sell-side liquidity is drying up.
-
Step 3: Wait for Confirmation: Place a "Buy Stop" order just above the high of the first candle in the bullish harami formation. A close above this level confirms the shift in momentum.
-
Step 4: Set Risk Parameters: To protect against volatility, set a stop-loss order slightly below the low of the first bearish candle.
-
Step 5: Monitor Volume: Look for an increase in buying volume on the confirmation candle to validate that the bullish harami is attracting new market participants.
Bullish Harami vs Other Reversal Patterns
While many traders confuse various bottoming signals, the bullish harami is distinct due to its specific "contained" structure. Understanding how it differs from similar formations like the bullish engulfing or the piercing line is essential for accurate market analysis.
Bullish Harami vs. Bullish Engulfing
In an engulfing pattern, the second candle "swallows" the first, signaling an aggressive breakout. Conversely, the bullish harami features a smaller second candle contained entirely within the previous bearish "mother" candle, signaling a contraction in volatility and a potential pause in selling pressure.
Bullish Harami vs. Piercing Line
A piercing line must close at least 50% into the previous red candle’s body. The bullish harami is more conservative; it represents a "inside day" where the price stays within the prior range, suggesting the bears have lost the momentum to create new lows.
Market Psychology
While an engulfing pattern is a loud "buy" signal, the bullish harami is a subtle hint of trend exhaustion. In the crypto markets, this often occurs at key support levels where sell-side liquidity is drying up, preparing the ground for an upward reversal.
Common Misinterpretations of Bullish Harami
The bullish harami is frequently misunderstood by novice traders, leading to premature entries in volatile crypto markets. To maintain a high success rate on an exchange platform, it is vital to distinguish a true reversal from a temporary consolidation or a continuation of a bearish trend.
Ignoring the Trend Context
The most common mistake is identifying a bullish harami in a sideways or "choppy" market. For this pattern to be meaningful, it must appear at the bottom of a clear downtrend. Without the preceding bearish momentum, the "containment" of the second candle is merely a sign of market indecision rather than a reversal signal.
Lack of Volume Confirmation
Traders often overlook the importance of trading volume. A bullish harami on low volume suggests that the "buy-the-dip" interest is weak. A valid trend shift requires a noticeable surge in volume on the third (confirmation) candle to prove that buyers are stepping in to absorb sell-side liquidity.
Confusing Shadows with Bodies
For a textbook bullish harami, the body of the second candle must be contained within the body of the first. Many incorrectly include the "wicks" or "shadows" in this calculation. In the crypto space—where long wicks are common due to liquidations—focusing strictly on the candle bodies is essential for accurate technical analysis.
Bullish Harami and Essential Risk Awareness
Integrating a bullish harami into your trading strategy requires more than just pattern recognition; it demands a rigorous approach to risk management. While this two-day reversal signal indicates that selling pressure is cooling off, it is not a guarantee of a trend shift. In the high-leverage environment of crypto trading, a bullish harami must be treated as a "setup" rather than a definitive "buy" signal.
Managing Risk with the Bullish Harami
-
Avoid Over-Leveraging: Because the bullish harami represents a period of price consolidation, volatility can remain high. Ensure your position size accounts for potential "wicking" below the pattern's support.
-
The "Mother" Candle Stop-Loss: A standard risk mitigation technique is to place a stop-loss order just below the low of the first (bearish) candle. If the price breaks this level, the bullish harami is invalidated, signaling that the bears still control the market.
-
Confirmation is Key: To reduce the risk of "false breakouts," wait for a third candle to close above the midpoint of the first candle. Entering a trade prematurely—before the bullish harami is confirmed by volume—increases exposure to sudden market reversals.
-
Contextual Risk: Always cross-reference the pattern with broader market sentiment. A bullish harami appearing during a global market crash carries much higher risk than one appearing at a tested historical support level.
The bullish harami is a two-day reversal candlestick pattern that serves as an early-warning signal for a potential trend shift in the cryptocurrency markets. By identifying a small bullish candle nested within a large bearish one, traders can spot the transition from distribution to accumulation. However, because crypto markets are prone to high volatility and "wicking," the pattern must be validated by secondary indicators like horizontal support, high trading volume, and price confirmation. When combined with strict risk management—such as avoiding over-leverage and setting clear stop-losses—the bullish harami becomes a powerful tool for identifying high-probability entry points at the end of a market cycle.
See why millions of traders choose the People’s Exchange—create your KuCoin account in under 60 seconds. Sign Up Now!
FAQs
-
What does "Harami" mean in trading?
"Harami" is the Japanese word for "pregnant." In technical analysis, the pattern is so named because the large bearish candle (the mother) appears to "carry" the smaller bullish candle (the baby) within its vertical range.
-
How does a Bullish Harami differ from a Bullish Engulfing pattern?
A bullish engulfing pattern occurs when the second candle completely "swallows" the first, signaling an aggressive breakout. A bullish harami is a more subtle signal where the second candle is smaller and contained, representing a contraction in volatility and trend exhaustion.
-
Does the second candle in a Bullish Harami have to be green?
While the second candle is ideally green (bullish) to show buying interest, the most critical factor is that its body is completely contained within the body of the previous bearish candle. However, a green second candle provides a much stronger reversal signal.
-
Where should I set my stop-loss when trading a Bullish Harami?
A common risk management practice on crypto exchanges is to place a stop-loss order slightly below the low of the first (large red) candle. If the price drops below this level, the pattern is invalidated.
-
Can I trade the Bullish Harami on any timeframe?
Yes, but the pattern is generally considered more reliable on longer timeframes (such as 4H or Daily charts). On shorter timeframes, "market noise" and high crypto volatility can lead to frequent false signals.
Disclaimer: The information on this page may have been obtained from third parties and does not necessarily reflect the views or opinions of KuCoin. This content is provided for general informational purposes only, without any representation or warranty of any kind, nor shall it be construed as financial or investment advice. KuCoin shall not be liable for any errors or omissions, or for any outcomes resulting from the use of this information. Investments in digital assets can be risky. Please carefully evaluate the risks of a product and your risk tolerance based on your own financial circumstances. For more information, please refer to our Terms of Use and Risk Disclosure.