

Trading 101: Understanding Different Candlestick Patterns While Trading Cryptos in 2026 (Part 2)
Introduction
Crypto markets are known for their volatility, making technical analysis an essential skill for traders seeking to identify profitable entry and exit points. Among the many tools available, candlestick reversal patterns remain one of the most widely used methods for spotting potential shifts in market momentum before major price movements occur. As algorithmic trading, AI-driven market analysis, and high-frequency trading continue to evolve in the crypto sector in 2026, understanding how reversal signals work across multiple timeframes has become even more important for both beginner and advanced traders.
Unlike continuation patterns that suggest an existing trend will persist, reversal candlestick patterns indicate that the current market direction may be losing strength and preparing for a shift. These formations often appear during periods of market exhaustion, profit-taking, or sudden changes in investor sentiment. When combined with trading volume, support and resistance levels, RSI divergence, and broader market conditions, reversal patterns can provide traders with higher-probability setups in the fast-moving crypto market.
In this guide, we will explore some of the most reliable bullish and bearish reversal candlestick patterns used in crypto trading today, including how traders interpret them and how they can be applied to modern digital asset markets.
Trend Reversal Patterns
Trend reversal patterns essentially indicate the end of the current trend and the formation of a new (opposite) trend. A reversal pattern formed during an uptrend implies that the trend is about to reverse and that the crypto-asset price might go down soon. Likewise, a reversal pattern formed in a downtrend indicates that the price might go up. Reversal patterns are usually developed when the bulls run out of steam in an uptrend or when bears lose their momentum in a downtrend.
Therefore, as soon as these patterns appear, the established trend will cease, and the coin’s price will travel in a different direction as new momentum arises from the other side. Now let’s discuss a few notable trend reversal patterns that crypto technical traders are using.
Hammer
The hammer is a single-stick bullish reversal pattern that appears at the bottom of a downtrend. Hammer typically forms when the crypto asset's opening price and closing price remain almost the same in a given time period. The basic structure of a hammer pattern consists of a candle with a shadow more than twice its body.
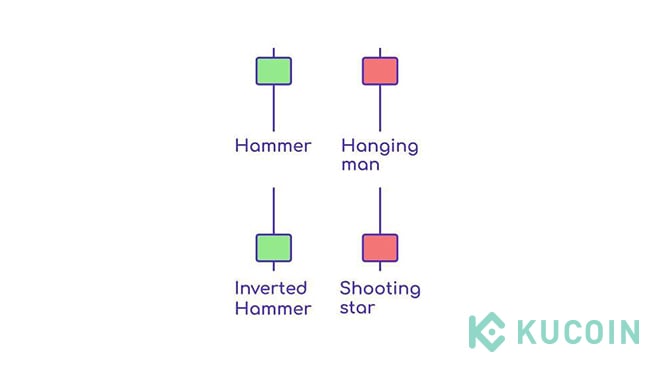
Another variation of the bullish hammer is the inverted hammer candlestick that signals a bullish reversal. As the name suggests, the candlestick formed is an inverted hammer, with a long upper wick and a small body. In the below BNB price chart, we can see the formation of the hammer and the subsequent reversal of the trend.
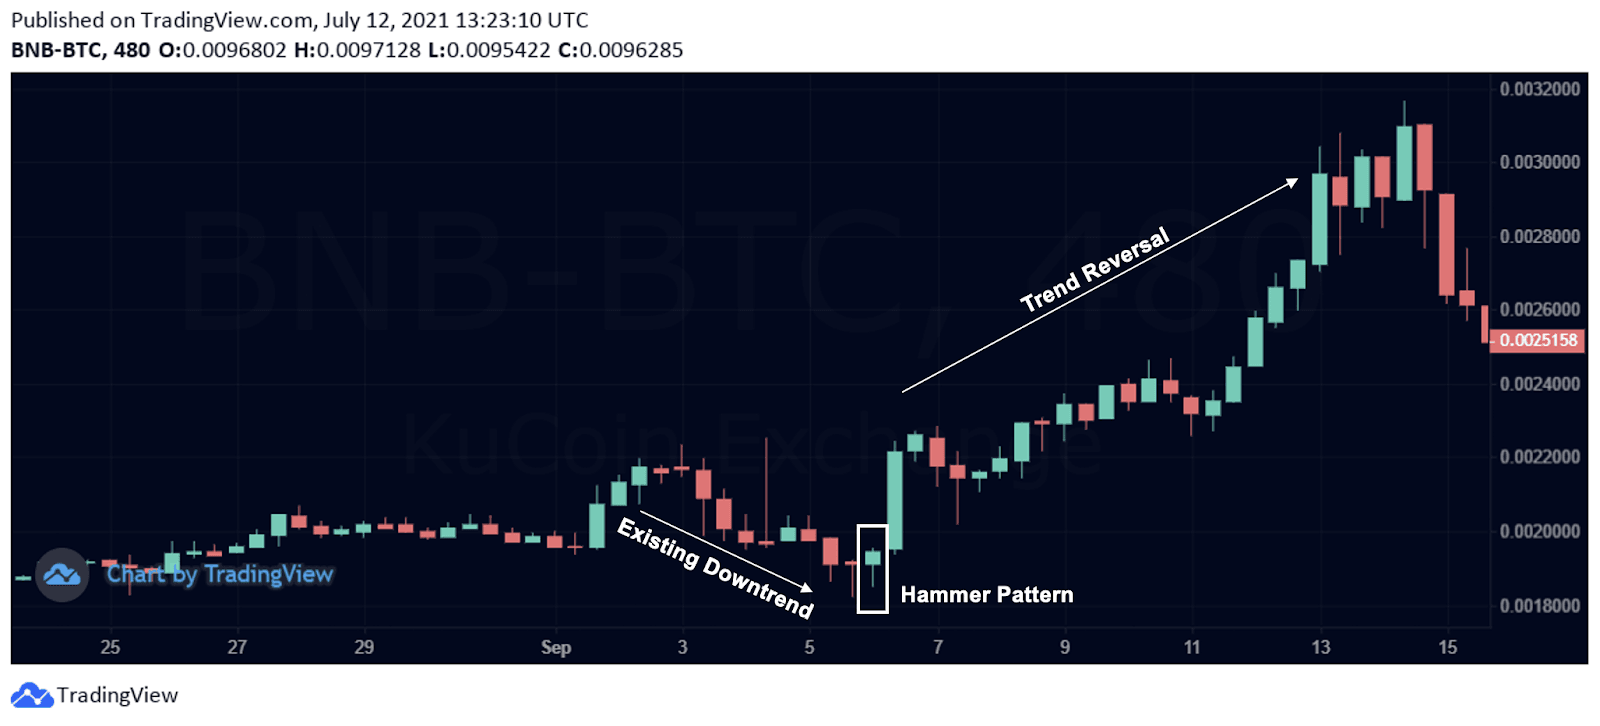
Hammer Candlestick on Binance Coin Price Chart | Source: BNB/BTC
Trading Hammer Patterns With Volume Confirmation
Modern crypto traders rarely rely on hammer candlestick patterns alone. In today’s market environment, volume confirmation has become a critical component when validating bullish reversals. A hammer accompanied by a noticeable increase in trading volume often indicates stronger buyer participation and a higher probability of trend reversal.
Many traders also combine hammer formations with technical indicators such as the Relative Strength Index (RSI) or Moving Average Convergence Divergence (MACD). For instance, a hammer appearing while RSI enters oversold territory can strengthen the bullish case for a potential rebound.
Additionally, traders increasingly monitor Bitcoin dominance and macroeconomic news events when trading reversal setups, as sudden volatility triggered by Bitcoin ETF flows, Federal Reserve policy changes, or stablecoin liquidity shifts can temporarily invalidate candlestick signals.
Spinning Top
A spinning top is a single candlestick pattern with a short body vertically centered between long upper and lower shadows. The formation of this pattern represents indecisiveness in the market. It means that either buyers or sellers could establish a clear trend, and the market could go either way.
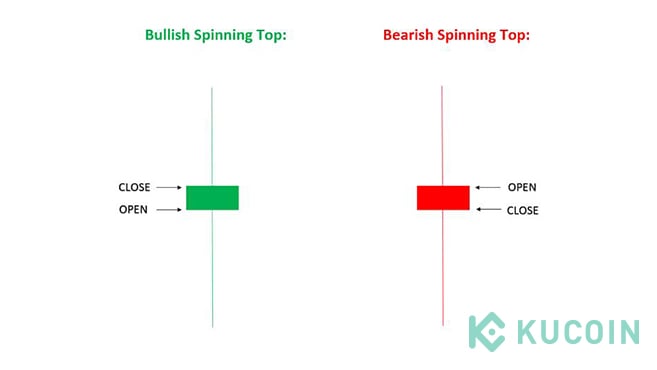
Spinning tops often may signal a significant trend reversal. If this pattern occurs at the top of an uptrend, it signifies that bulls are losing momentum, and the trend may reverse. Similarly, a spinning top at the bottom of a downtrend could signal that bears are losing momentum, and bulls are ready to take over.
In the below Ripple (XRP) chart, we can see the formation of a Spinning Top candlestick pattern at the top of an uptrend indicating a clear trend reversal.
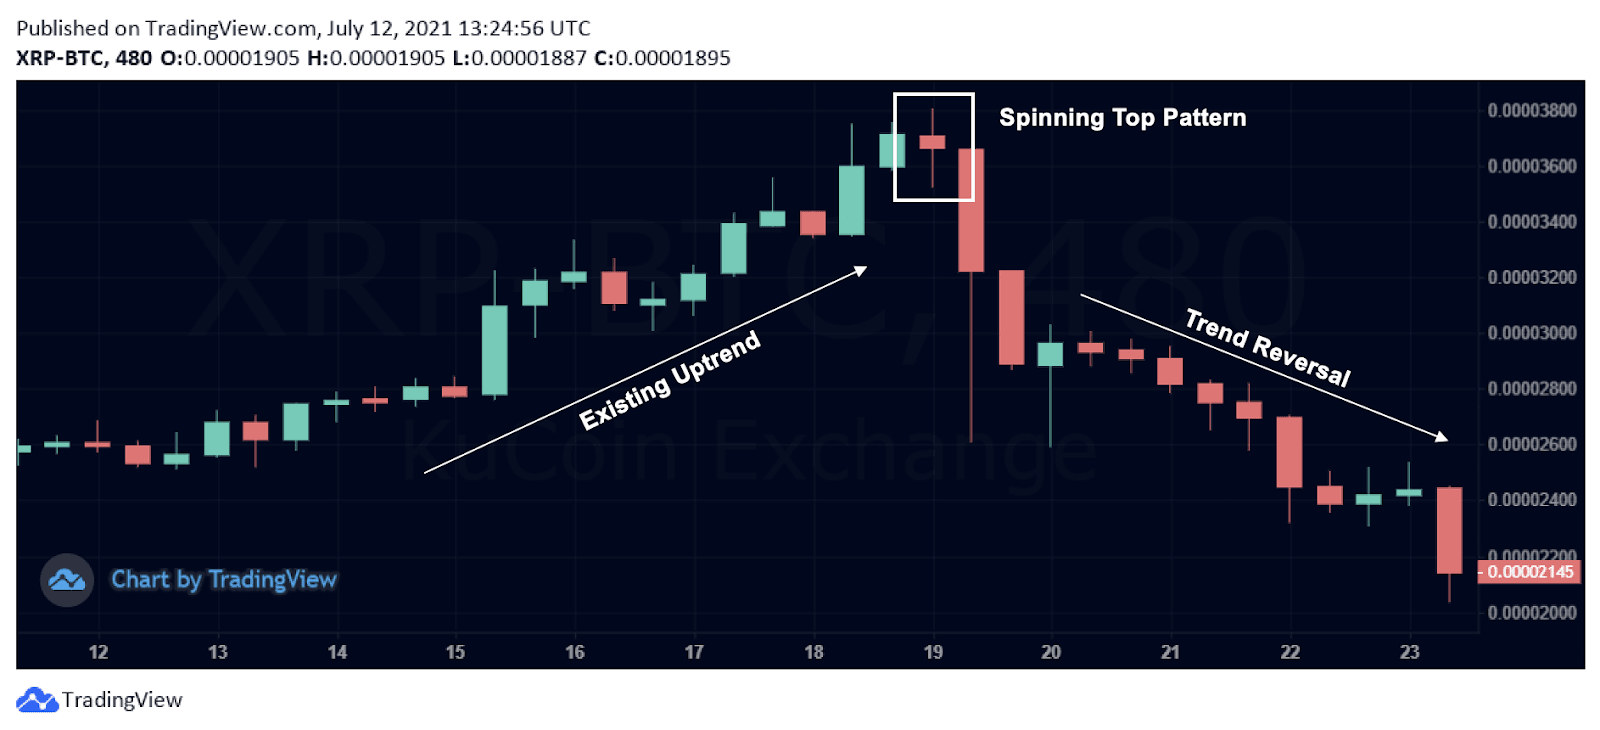
Spinning Top Candlestick on XRP Price Chart | Source: XRP-BTC
Doji
The word "Doji" is derived from a Japanese term that means "mistake." It is a candlestick pattern that looks like a cross with a minute difference between the opening and closing prices. A Doji candle is formed when the buyers try to drive the prices up while sellers renounce the higher price and push it back down simultaneously. As a standalone candle, a Doji is a sign of high indecision in the market, but it can be a sign of an impending reversal when considered along with the prevailing trend.
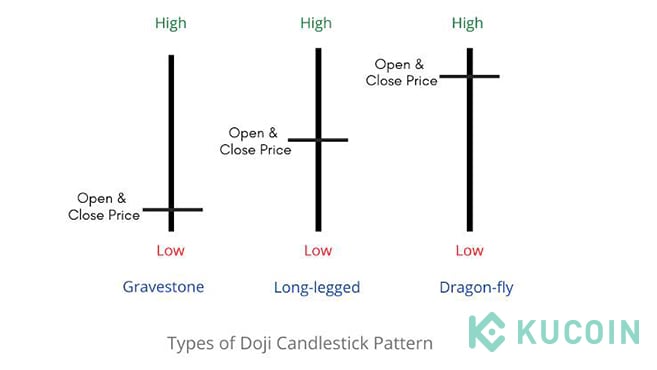
In the below Ethereum chart, we can find the appearance of Doji reversing the prevailing market trend.
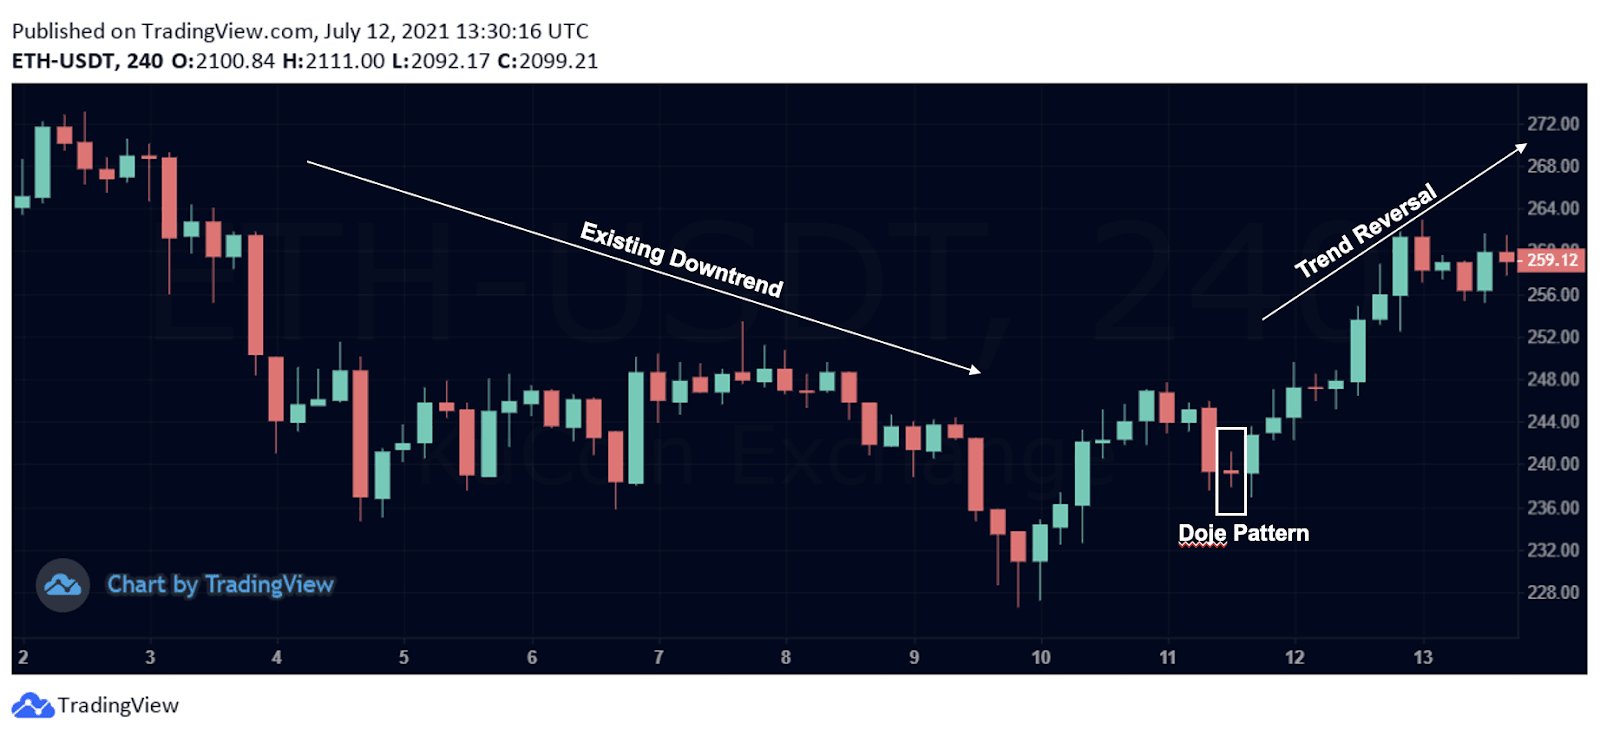
Doji Candlestick on Ethereum Price Chart | Source: ETH-USDT
Double Tops and Double Bottoms
A double top is a bearish reversal pattern that forms only during an uptrend. The pattern is characterized by two consecutive peaks in price lying on the same horizontal level, resembling an 'M' shape. The double bottom pattern is essentially a mirror reflection of the double top pattern. While the double tops are formed during a strong uptrend, the double bottom is formed in a downtrend. Two consecutive valleys characterize the pattern on the price chart lying on the same horizontal level. A double bottom accompanied by increasing trade volume indicates a bullish reversal.
We can see the trend reversing after forming a double top pattern on the Matic price.
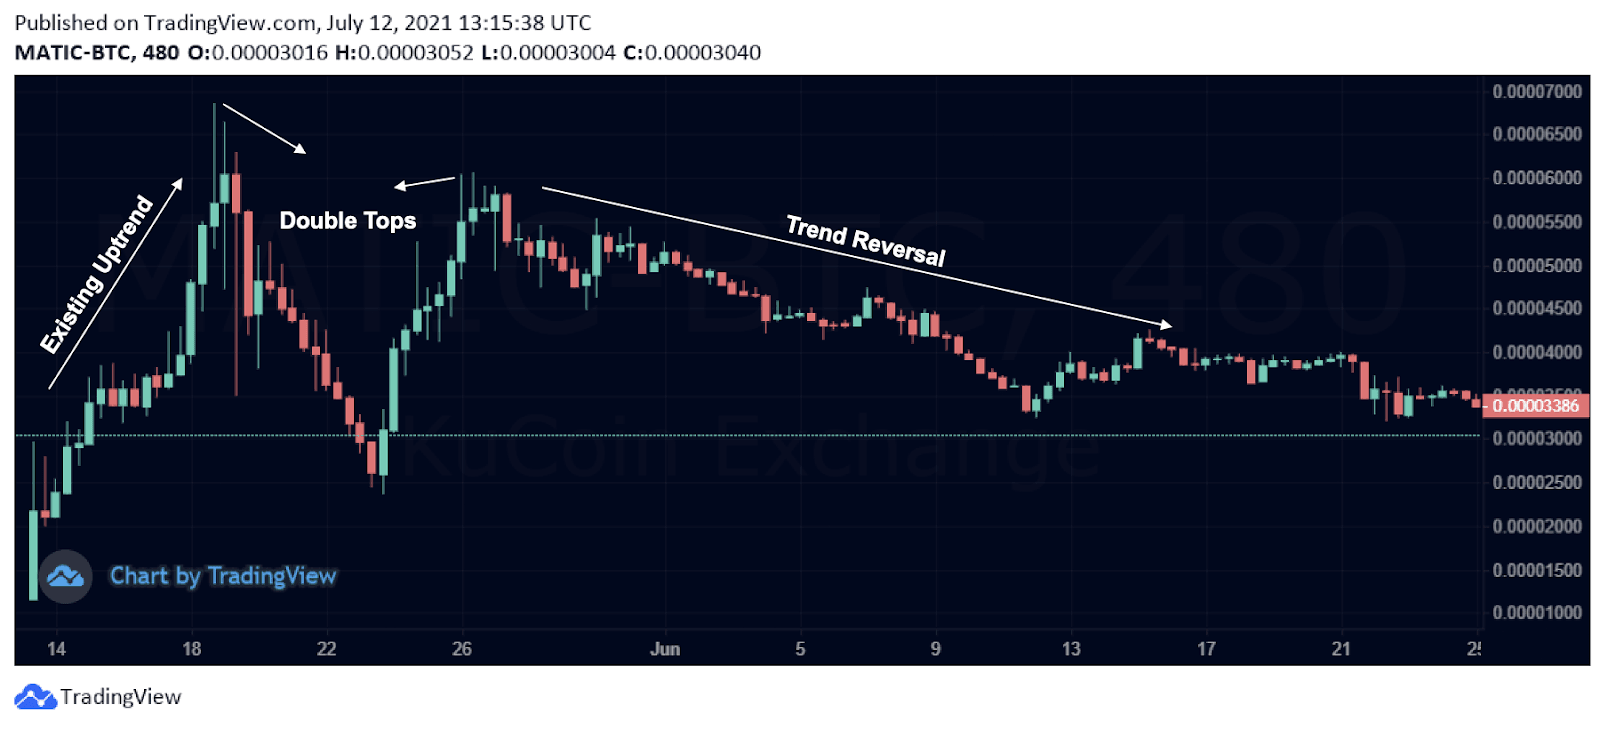
Double Top Candlestick Pattern on Matic Price Chart | Source: MATIC-BTC
The below chart featuring Bitcoin is a good example of the formation of a double bottom pattern.
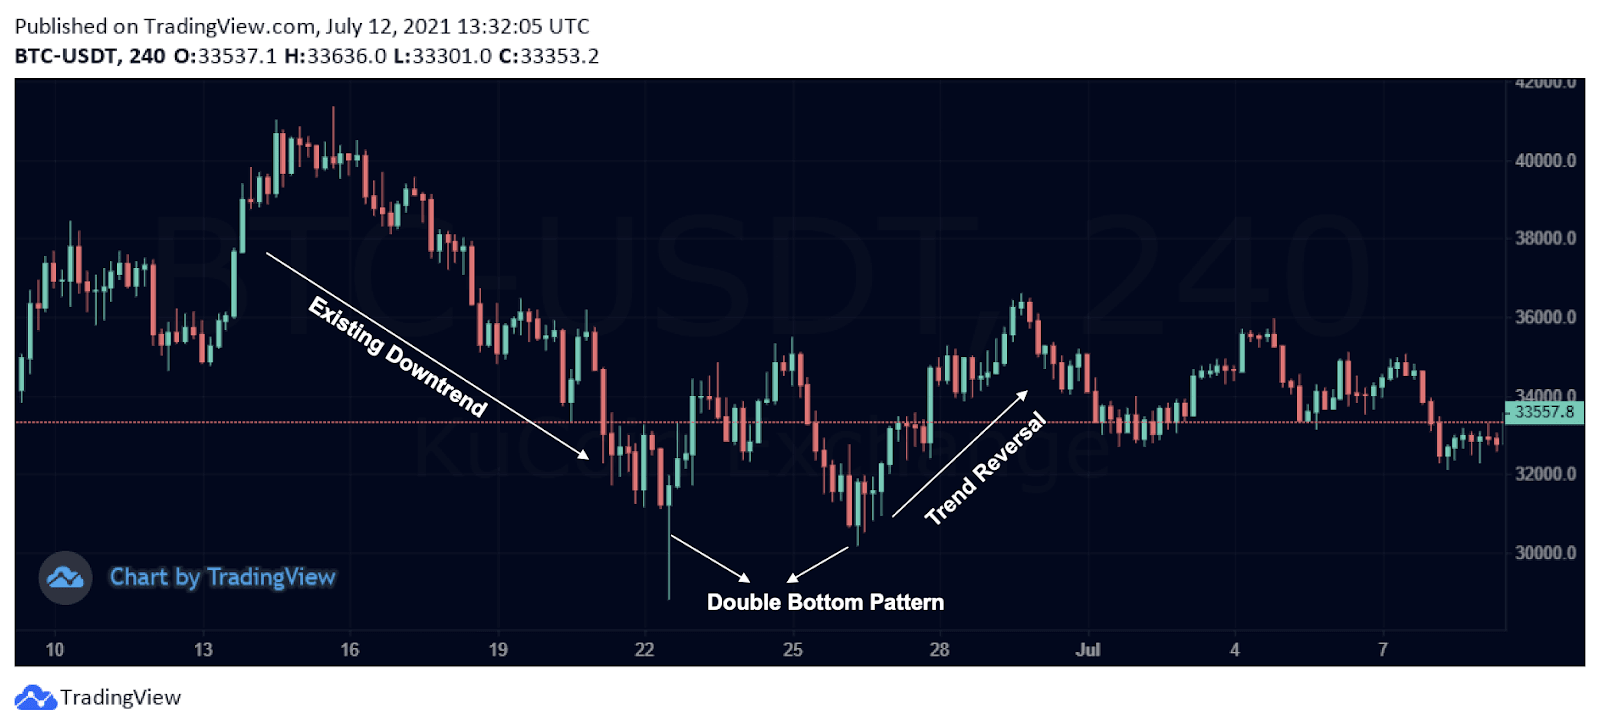
Double Bottom Candlestick Pattern on Bitcoin Price Chart | Source: BTC-USDT
Three Black Crows
Three black crows are the exact opposite of the three white soldiers that appear at the end of an uptrend, indicating a bearish reversal in the market. The three black crows are formed by three consecutive long body candlesticks, with each one closing below the previous one.
They indicate the end of an uptrend and the bears taking control over the market by driving the price down, signaling the onset of an aggressive downtrend.
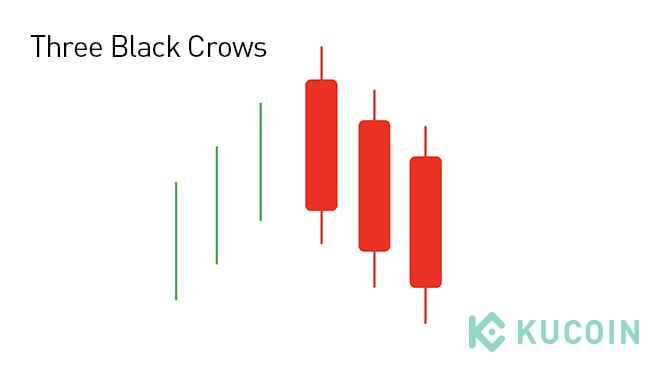
The below price chart is a great example of the appearance of the Three Black Crows pattern and its subsequent trend reversal.
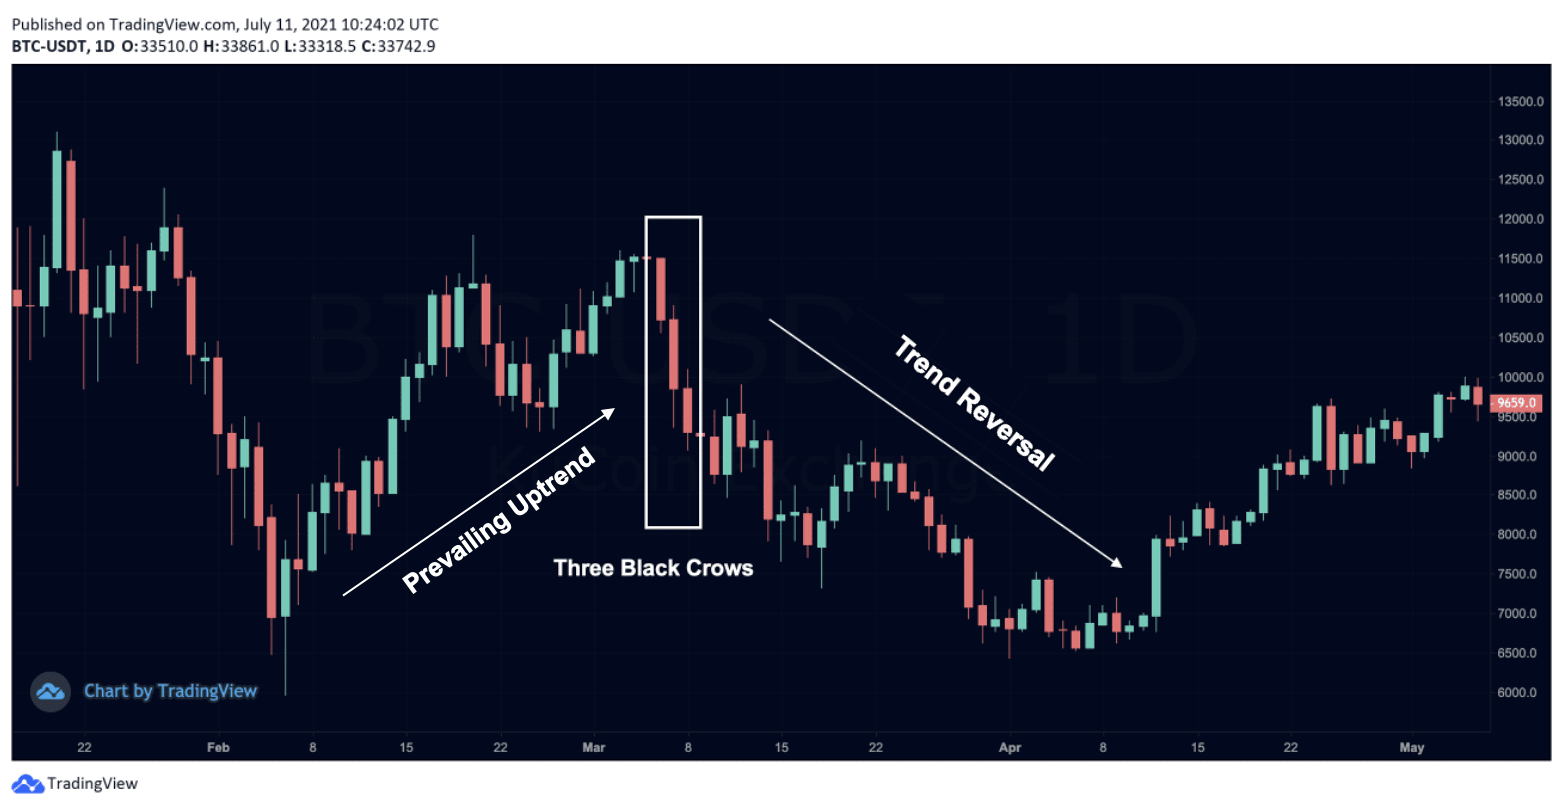
Three Black Crows Candlestick Pattern on Bitcoin Price Chart | Source: BTC-USDT
2026 Crypto Market Update: Why Reversal Patterns Matter More Than Ever
In 2026, crypto traders are increasingly combining traditional candlestick analysis with modern indicators such as on-chain metrics, funding rates, open interest data, and AI-powered trading signals. While candlestick reversal patterns remain highly effective, many professional traders now use them alongside confirmation tools to reduce false signals in highly volatile conditions.
For example, a bullish hammer forming near a major Bitcoin support level while exchange outflows increase may provide a stronger reversal confirmation than relying on candlestick structure alone. Similarly, bearish patterns like the Three Black Crows can become significantly more reliable when accompanied by rising sell volume and negative market sentiment across derivatives markets.
Another important development is the growing popularity of multi-timeframe analysis. Traders often look for reversal confirmations on higher timeframes such as the 4-hour, daily, or weekly chart before entering trades on lower timeframes. This approach helps filter out market noise and improves risk management during periods of elevated volatility.
As institutional participation in crypto markets continues to grow, reversal candlestick patterns are now widely used not only by retail traders but also by quantitative analysts, proprietary trading firms, and crypto hedge funds seeking to identify trend exhaustion and momentum sh
Conclusion
Candlestick reversal patterns continue to play a crucial role in crypto technical analysis, helping traders identify potential market turning points across both bullish and bearish environments. From Hammer and Doji formations to Double Tops and Three Black Crows, these patterns offer valuable insights into changing market sentiment and momentum shifts.
However, successful trading in today’s crypto market requires more than simply recognizing chart formations. Modern traders increasingly combine reversal patterns with volume analysis, momentum indicators, on-chain data, and broader macroeconomic trends to improve decision-making and reduce risk exposure.
Most importantly, traders should remember that no indicator is perfect. Consistent profitability comes from disciplined risk management, patience, and continuous learning. By understanding how reversal patterns function within different market conditions, traders can build stronger strategies and improve their ability to navigate the ever-evolving cryptocurrency landscape.
Whether you are a beginner learning technical analysis or an experienced trader refining your strategy, mastering candlestick reversal patterns can become a valuable part of your crypto trading toolkit.
FAQs
1. What are reversal candlestick patterns in crypto trading?
Reversal candlestick patterns are chart formations that indicate a potential change in the current market trend. They help traders identify possible transitions from bullish to bearish trends or vice versa.
2. Which reversal candlestick pattern is the most reliable?
There is no single “most reliable” pattern because effectiveness depends on market conditions and confirmation signals. However, patterns like the Hammer, Double Bottom, and Three Black Crows are widely used by crypto traders due to their strong historical relevance.
3. Should traders use candlestick patterns alone?
No. Most experienced traders combine candlestick analysis with trading volume, RSI, MACD, support and resistance levels, and broader market sentiment to improve accuracy and reduce false signals.
4. Do reversal candlestick patterns work on all crypto trading timeframes?
Yes. Reversal patterns can appear on all timeframes, including 5-minute, hourly, daily, and weekly charts. However, higher timeframe signals are generally considered more reliable than lower timeframe patterns.
5. How can beginners reduce risk when trading reversal patterns?
Beginners can reduce risk by using stop-loss orders, avoiding overleveraging, waiting for confirmation candles, and practicing proper position sizing. It is also recommended to backtest strategies before trading with large amounts of capital.