

Trading 101: Identifying & Trading The Crypto Flag Pattern Like a Pro in 2026
Introduction
Technical analysis remains one of the most widely used trading methodologies in the crypto market, especially in highly volatile environments where price sentiment changes rapidly. Among all chart formations, Flag patterns are considered one of the most reliable continuation indicators for identifying trend momentum and potential breakout opportunities.
As institutional participation, algorithmic trading, and Bitcoin ETF-related liquidity continue reshaping the crypto market in 2026, traders increasingly rely on momentum-based chart patterns like bullish and bearish Flags to identify short-term continuation setups across Bitcoin, Ethereum, Solana, and emerging altcoins.
A Flag pattern usually appears after a strong directional move and signals that the market is temporarily consolidating before continuing in the same direction. When combined with trading volume, RSI, MACD, and support/resistance analysis, Flag formations can help traders improve entry timing and risk management.
In this guide, you’ll learn what a Flag pattern is, how bullish and bearish Flags work, how to trade them effectively, and the common mistakes traders should avoid when using Flag chart patterns in crypto trading.
What is a Flag Pattern?
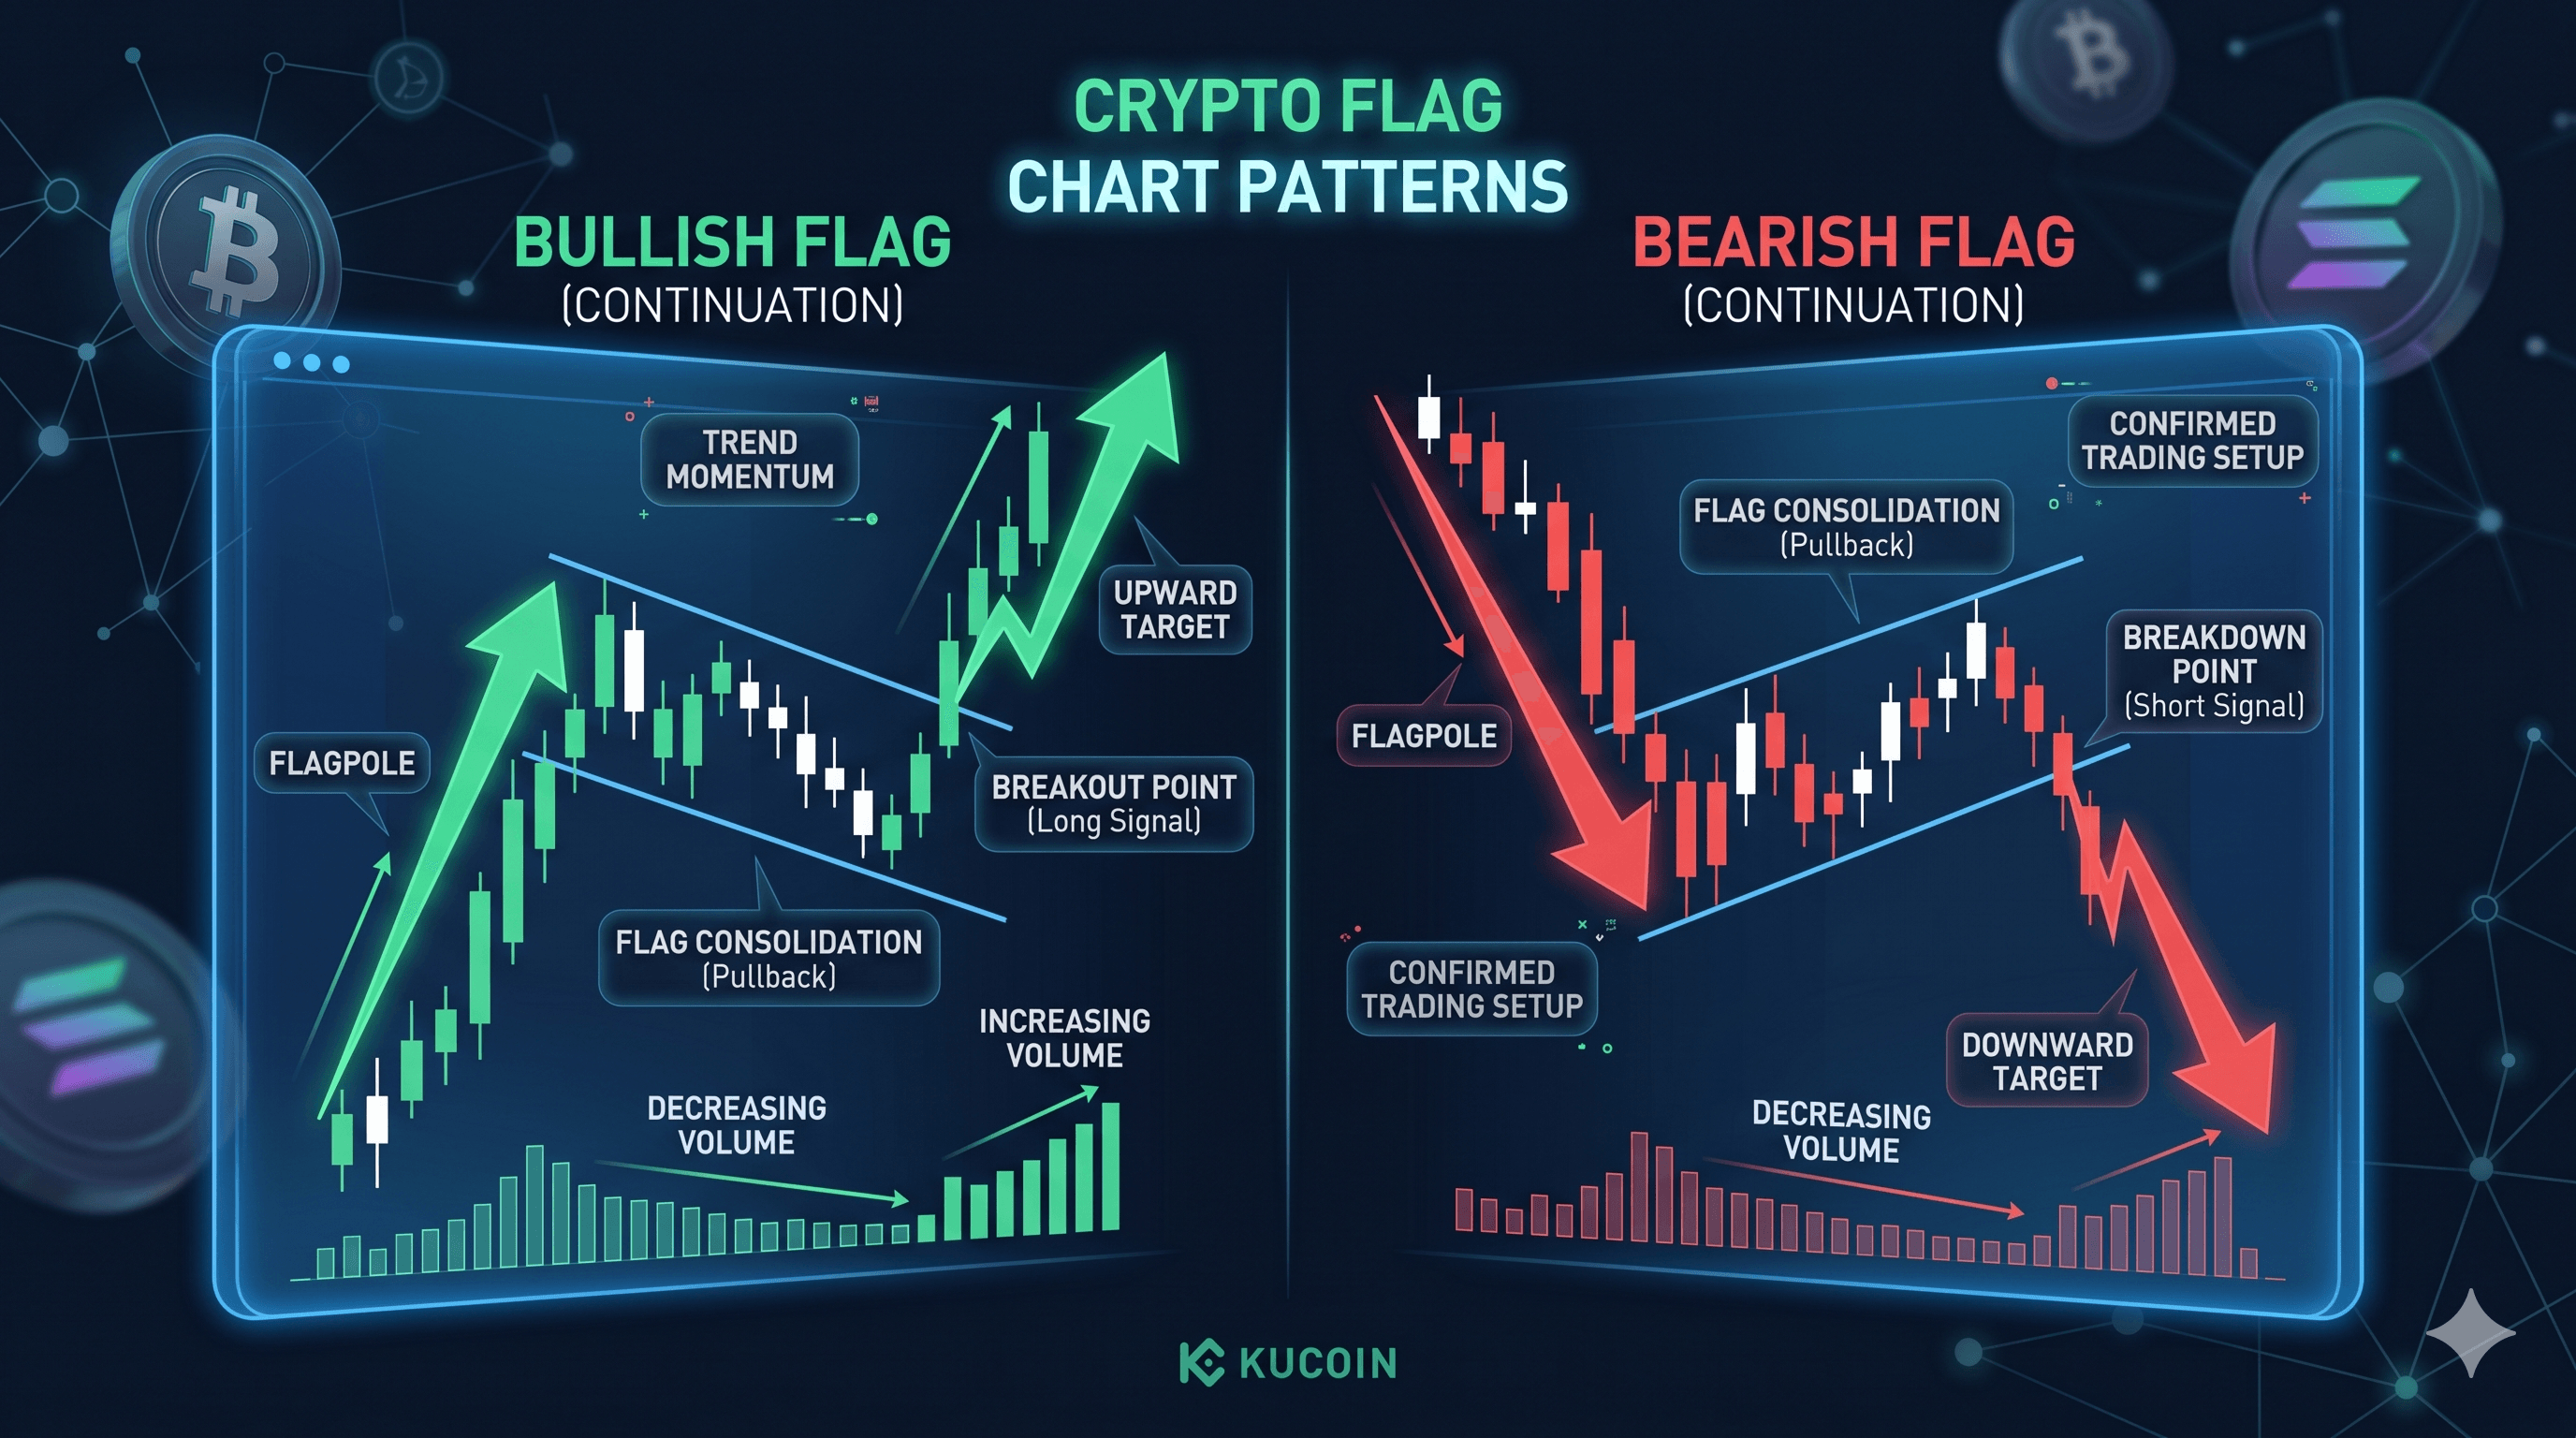
The crypto ‘Flag’ is a trend continuation chart pattern. It often forms after a short period of price consolidation preceded by a long-term trend – either bullish or bearish.
The most important feature of a Flag formation is the flagpole, which corresponds to a strong price movement. The Flag chart pattern represents a brief interruption of the trend before it continues, i.e., the price movement continues in the same direction. Identifying the flagpole is very crucial in a Flag formation. Look for strong and obvious price boosts with successive price sticks, price gaps, and strong volume, all pointing in the same direction.
The Flag pattern got its name because the price action of the pattern resembles a Flag on a flagpole. Flags are trend pullback patterns. This means that you take advantage of a momentary pause in the prevailing trend to jump on the trend. Typically, the volume should decrease as the Flag chart pattern forms and increases when the price breaks. The determination of the profit target differs in the Flag formation compared to the other chart patterns.
When trading the Flag pattern, we are less concerned with the exact shape of the flag, but with the following:
- The strength of the trend
- The feasibility of determining a breakout point
- The extent of the pullback regardless of whether it’s shallow or deep.
In modern crypto markets, Flag patterns frequently appear during periods of strong momentum driven by macroeconomic news, ETF inflows, token listings, memecoin rallies, or major ecosystem developments. Because crypto trades 24/7 with high retail participation, Flag formations tend to occur more frequently than in traditional financial markets. However, traders should be cautious of fake breakouts caused by low liquidity conditions or sudden whale activity, especially when trading lower-cap altcoins.
Bullish Flag Pattern
When a bullish Flag pattern appears, it signifies that the bullish trend will continue.
In this case, we need a sustained uptrend as a flagpole. The Flag consists of two parallel lines that are inclined downwards or descending; this represents a short-term price pullback – a consolidation region before the trend breaks out.
After identifying the bullish Flag pattern, you should prepare yourself to open a long position.
- Go long when a candlestick closes above the upper trendline of the bullish Flag. A breach of the upper trendline confirms the continuation of the bullish trend.
- If the price breaks through the upper trendline but closes below it, you can adjust the line to match the breakout while the pullback continues.
- It’s advisable to place the SL just below the lower trendline of the Flag.
- Keep in mind that the pullback forming the bullish Flag does not extend beyond the pole. This would mean that the price action is turning bearish.
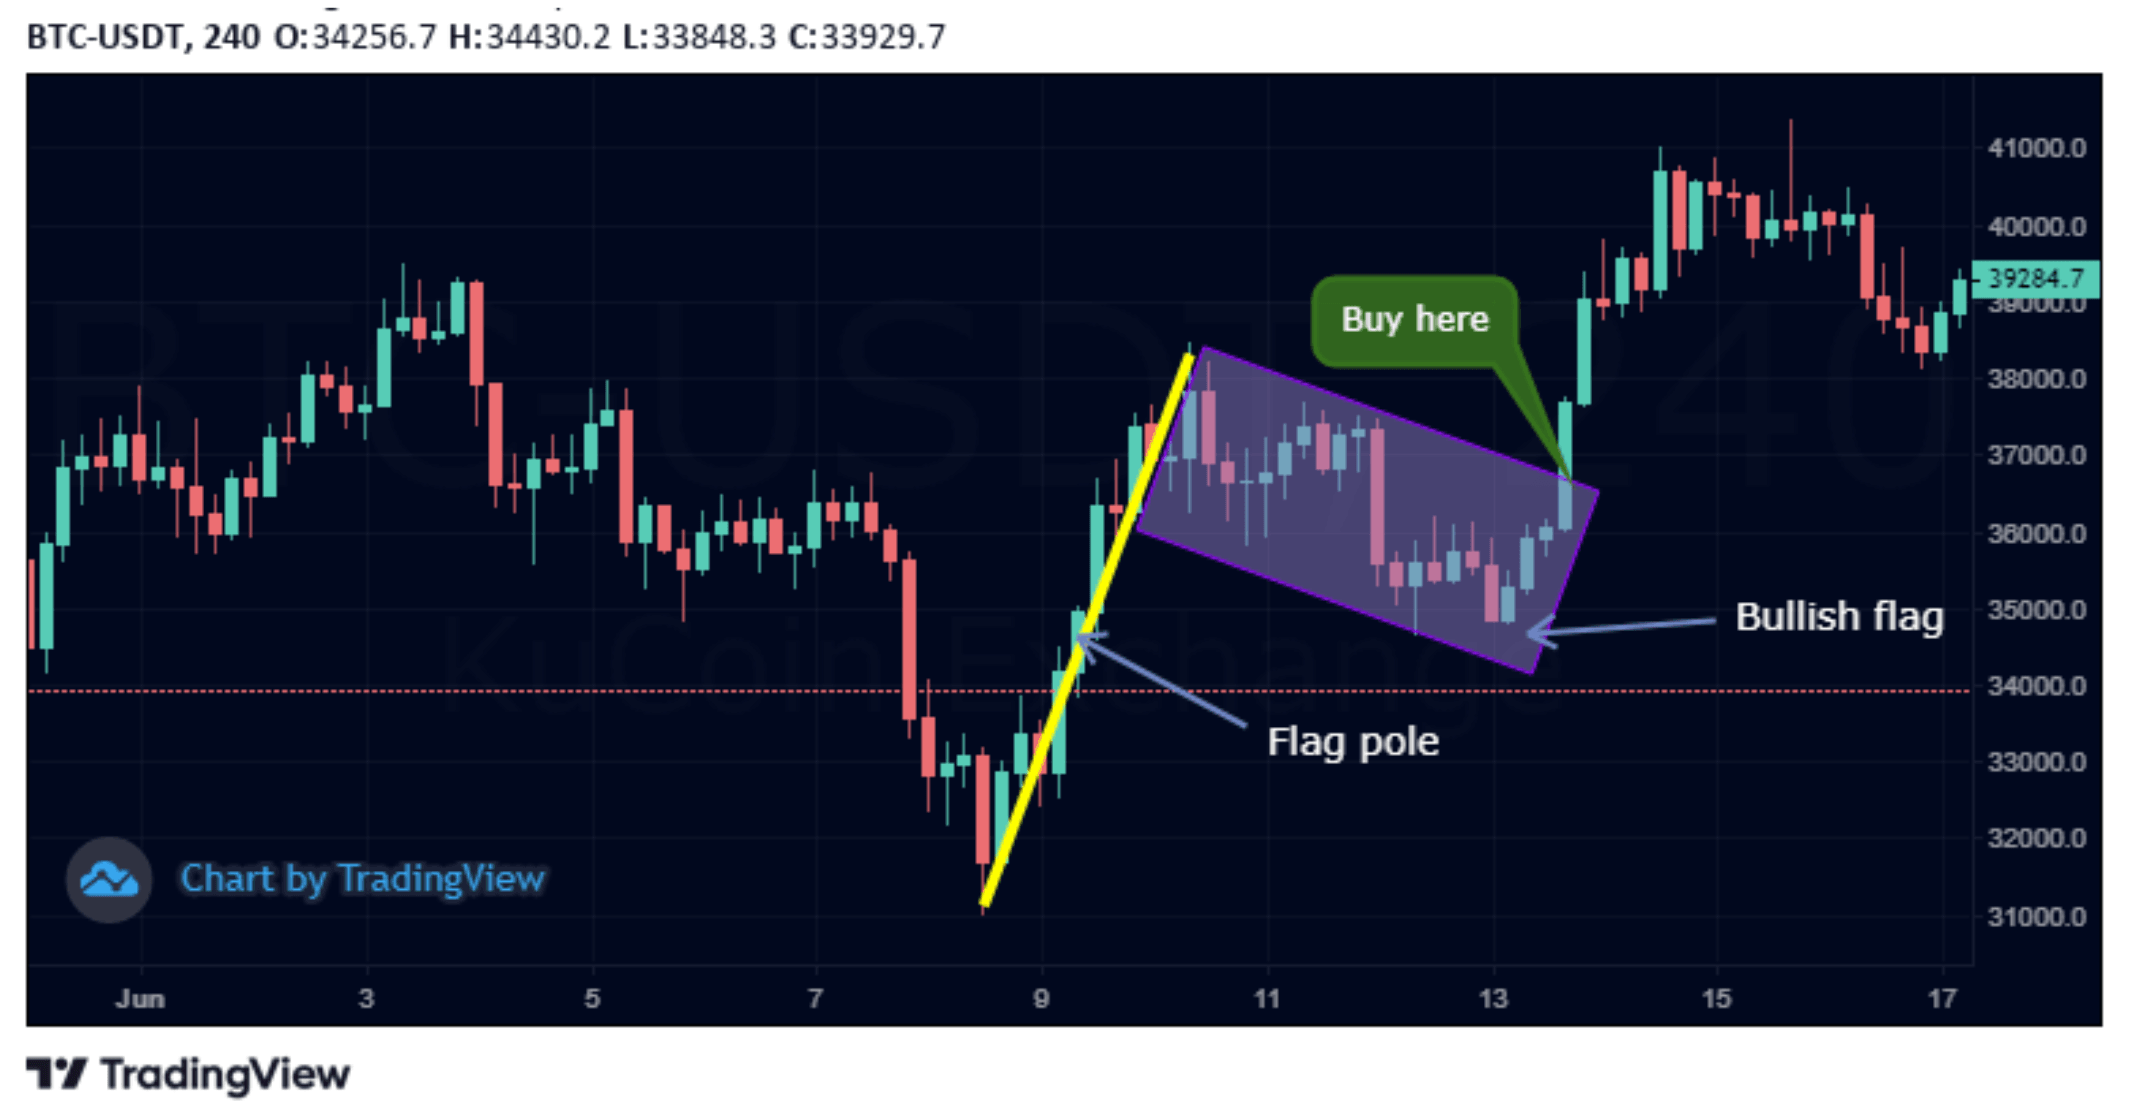
Formation of Bullish Flag pattern on the Bitcoin Price Chart | Source: BTC/USDT
The price target is determined by the fact that distance (mast to the flag) is applied to the outbreak of the Flag. This means you should determine the distance (vertical) from the signal of the upward movement to the highest of the Flag and apply this distance, if necessary, vertically, to the breakout signal of the Flag.
Another important confirmation signal for a bullish Flag breakout is trading volume. In many successful bullish continuation setups, volume typically decreases during the consolidation phase and expands significantly once the breakout occurs. If price breaks above the Flag resistance without strong volume confirmation, the breakout may lack sustainability and could result in a false signal.
Many professional crypto traders also combine bullish Flag setups with momentum indicators such as RSI divergence, moving averages, and open interest data from crypto futures markets to increase the probability of successful trades.
Bearish Flag Pattern
The appearance of a bearish Flag signifies that the downtrend is in the consolidation phase and is about to break out and continue.
The flagpole is formed from the sustained downtrend, while the Flag forms when a slight price pullback appears. Ideally, the Flag forms when the price action trends within a channel that’s slightly tilted upwards. This is in contrast to the bullish flag, which is usually tilted downwards. In some circumstances, the Flag for both bullish and bearish could be horizontal.
The process of identifying the bear Flag is the exact opposite to that of the bullish one.
After identifying the bearish Flag pattern, you should prepare yourself to open a short position.
- Go short when a candlestick closes below the lower trendline of the Flag. A break below the lower trendline confirms the continuation of the bearish trend.
- If the price breaches the flag’s lower trendline but closes above it, you can adjust the line to match the breakout while the pullback continues.
- It’s advisable to place the SL just above the upper trendline of the flag.
- Keep in mind that the pullback forming the bearish Flag does not extend beyond the pole. This would mean that the price action is turning bullish.
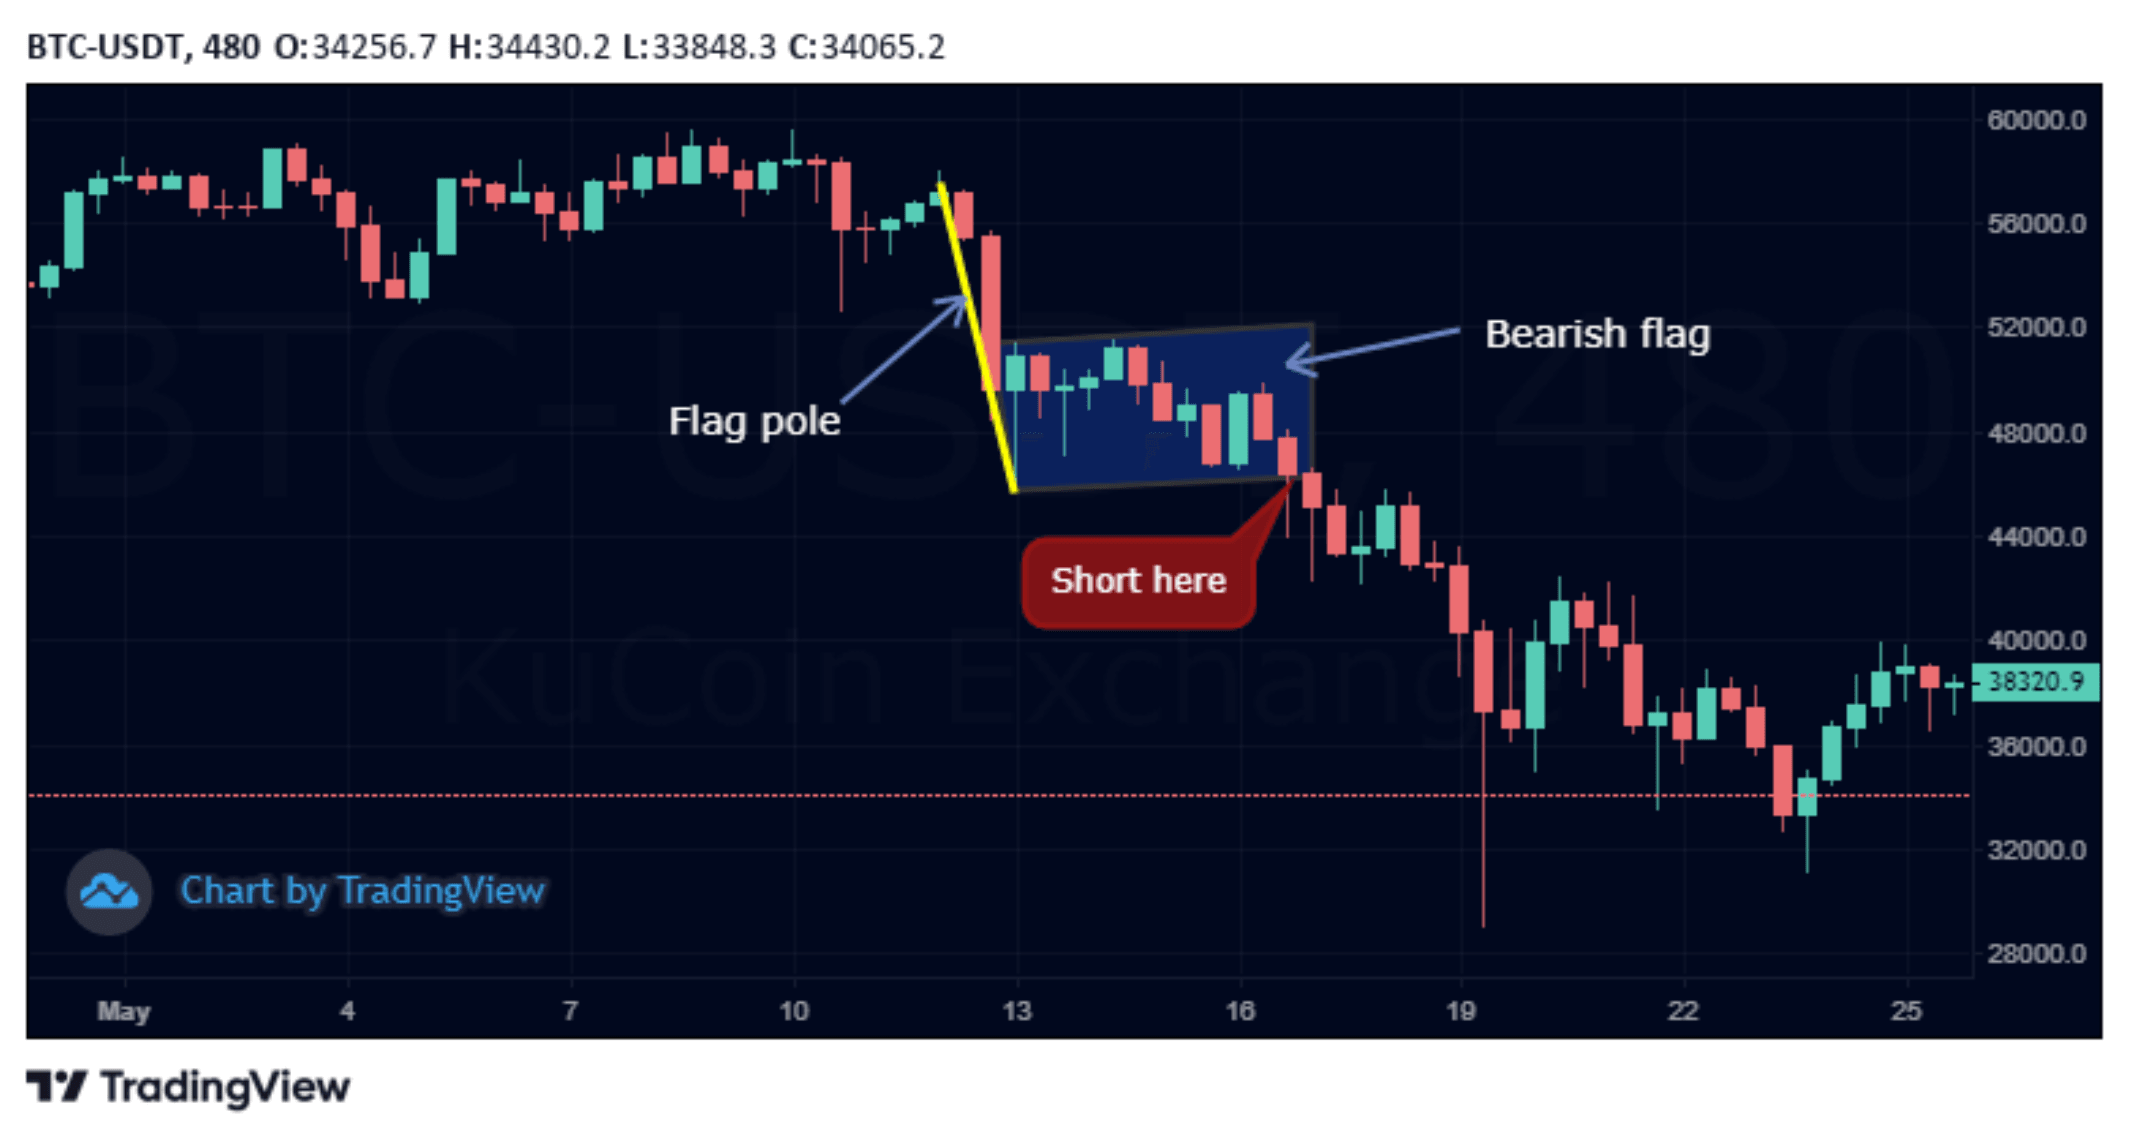
Formation of Bearish Flag pattern on the Bitcoin Price Chart | Source: BTC/USDT
Bearish Flag patterns are especially common during broad market corrections or periods of risk-off sentiment in crypto. During sharp Bitcoin selloffs, bearish Flags often appear on lower timeframes before another wave of liquidation occurs. Traders should monitor funding rates, liquidation heatmaps, and overall market sentiment when trading bearish continuation setups.
It is also important to avoid entering short positions too early before confirmation. Many inexperienced traders anticipate the breakdown before the candlestick closes below support, increasing the risk of getting trapped in temporary rebounds or short squeezes.
Common Mistakes When Trading Flag Patterns
One of the biggest mistakes traders make when trading Flag patterns is forcing the setup onto random market structures that do not have a clear flagpole. Without a strong impulsive move before consolidation, the formation may simply represent sideways market noise rather than a continuation pattern.
Another common issue is ignoring trading volume. A valid Flag breakout is usually accompanied by increasing volume and momentum. Weak breakout volume may indicate a fake move designed to trap traders before reversing direction.
Risk management is equally important. Even high-probability Flag patterns can fail during unexpected market volatility, macroeconomic announcements, or sudden liquidation cascades. Using stop-loss orders and proper position sizing remains essential for long-term trading survival.
Finally, traders should avoid relying solely on one chart pattern. Combining Flag analysis with broader market structure, trend direction, support and resistance levels, and on-chain or derivatives data can significantly improve trading accuracy in the crypto market.
Conclusoin
Flag patterns remain one of the most effective continuation chart patterns in crypto trading because they help traders identify temporary consolidation phases within strong market trends. Both bullish and bearish Flags provide valuable insight into momentum continuation and can offer favorable risk-to-reward trading opportunities when properly confirmed.
However, no chart pattern guarantees success. In today’s fast-moving crypto environment, traders should combine Flag formations with volume analysis, technical indicators, market sentiment, and sound risk management practices. False breakouts and volatility spikes are increasingly common due to algorithmic trading and leveraged derivatives markets.
Whether you are trading Bitcoin, Ethereum, Solana, or trending altcoins, understanding how to identify and trade Flag patterns can help improve your overall technical analysis skills and trading discipline.
With KuCoin’s advanced TradingView integration, traders can easily analyze Flag formations and other popular crypto chart patterns across multiple timeframes. As always, conduct your own research and never risk more capital than you can afford to lose.
FAQs
Are Flag patterns reliable in crypto trading?
Flag patterns are generally considered reliable continuation patterns when supported by strong volume and overall market momentum. However, traders should still use additional indicators and proper risk management to reduce the impact of false breakouts.
What is the difference between a bullish Flag and a bearish Flag?
A bullish Flag appears during an uptrend and signals potential continuation to the upside after a short consolidation. A bearish Flag forms during a downtrend and suggests that the price may continue falling after temporary consolidation.
Which timeframe works best for Flag pattern trading?
Flag patterns can appear on all timeframes, but many crypto traders prefer the 1-hour, 4-hour, and daily charts because they tend to provide stronger and more reliable signals compared to lower timeframes.
Can beginners use Flag patterns for crypto trading?
Yes. Flag patterns are considered beginner-friendly because of their relatively simple structure. However, beginners should practice identifying valid flagpoles, breakout confirmations, and stop-loss placement before trading with real capital.
What indicators work best with Flag patterns?
Popular indicators used alongside Flag patterns include RSI, MACD, moving averages, Bollinger Bands, and volume analysis. Many advanced traders also monitor futures open interest and funding rates for additional confirmation.