Using Support and Resistance Levels in Crypto Trading
Master the essential skill of pinpointing support and resistance levels and anticipate future trends by leveraging price action data-based indicators.
Are you a crypto trader trying to establish a foothold in a volatile crypto market? If so, the first skill you must learn is the art of identifying support and resistance levels using technical analysis tools.
Read on as we explore one of the most popular and effective technical analysis tools: support and resistance levels. Get ready to uncover various methods for identifying these crucial levels and elevate your crypto trading game!
Technical Analysis in Crypto
Technical analysis of cryptocurrency entails using mathematical indicators based on previous price action data to forecast future trends. The basic idea is that markets behave in predictable ways and that once established, trends in one direction often continue in that direction for some time.
Markets often exhibit predictable behavior, and once a trend is established, it's likely to continue in the same direction for a while. As a savvy investor, you should aim to create a strategy that allows you to buy low and sell high, thus maximizing profits. Performing technical analysis before entering a position helps you identify those lucrative price levels.
There's no one-size-fits-all strategy for crypto technical analysis. Each trader has unique preferences for indicators and may interpret them differently. Plus, no technical analysis can guarantee 100% accuracy in predictions.
What Are Support and Resistance Levels?
The support and resistance zones are some of the most commonly used concepts in crypto trading. Surprisingly, everyone has their own idea of how to measure support and resistance.
Consider bouncing a ball around your house. Your floor and ceiling are barriers limiting the ball's flight and fall. Support and resistance are similar barriers in trading that limit the movement of price action.
The price action rarely forgets its past, and such trading barriers can have long-term effects on an asset. If you consider a certain price level as an excellent entry or exit point, it will likely continue to act as a price barrier until all your needs are met.
Let's start with the fundamentals.
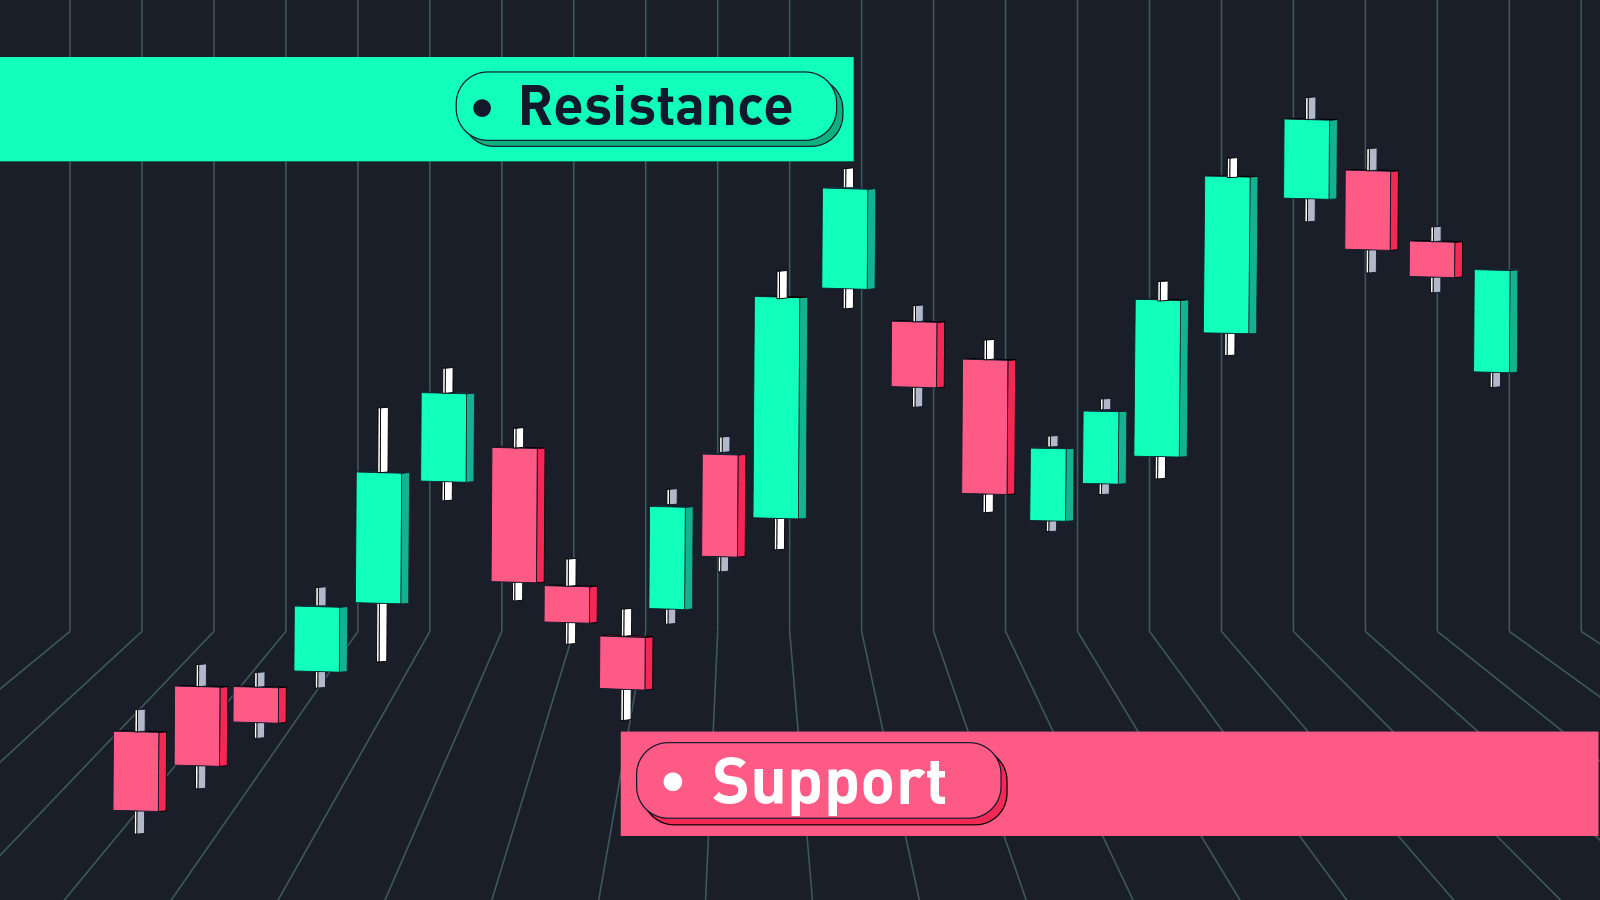
Resistance Levels
In simple terms, the high placed before exhibiting a pullback is referred to as resistance. Resistance levels indicate areas where there will be an overabundance of sellers. These areas often act as physical and psychological barriers.
For instance, if a crypto asset is regarded to be overvalued, bears would generally continue to sell their holdings for profit-taking. It's also feasible that investors will short-sell a specific crypto asset if there's a lot of selling pressure below a certain price level.
For more information on how to profit from descending markets, check out our guides on how to short cryptocurrencies and how to profit from bear markets.
Thus, new investors will notice a lack of demand under certain price levels and enter a short position. The herd selling behavior of investors will lead to an increased supply of a cryptocurrency and ultimately will drive a downtrend in its price.
Support Levels
When the price begins to rise again, the lowest point reached before it rises will serve as support. Support levels indicate areas where there will be an overabundance of buyers.
For instance, if a Bitcoin is undervalued, bulls would generally continue to buy at that price until the market fully absorbs all of their demand. Suppose a buyer engages at the price of $20,000, and the price of BTC soars before returning to the same entry price. In that case, the same buyer will attempt to defend their positions at the $20,000 mark. He will potentially add to them.
Therefore, new buyers will notice that the price has dropped no further than $20,000 and will likely deem it a safe entry point. This concentration of buyer demand will prevent the price from falling further, forming a temporary floor known as support.
How to Spot Support and Resistance Levels
Resistance and support are constantly formed as the price moves up and down over time. There are several ways to spot the support and resistance zones.
Recent High and Low Points
In price action trading, the most common method to spot support and resistance zones involves looking back at recent high and low price levels. The immediate high indicates a level where bulls got exhausted, and sellers took over. Hence, this will act as a resistance level.
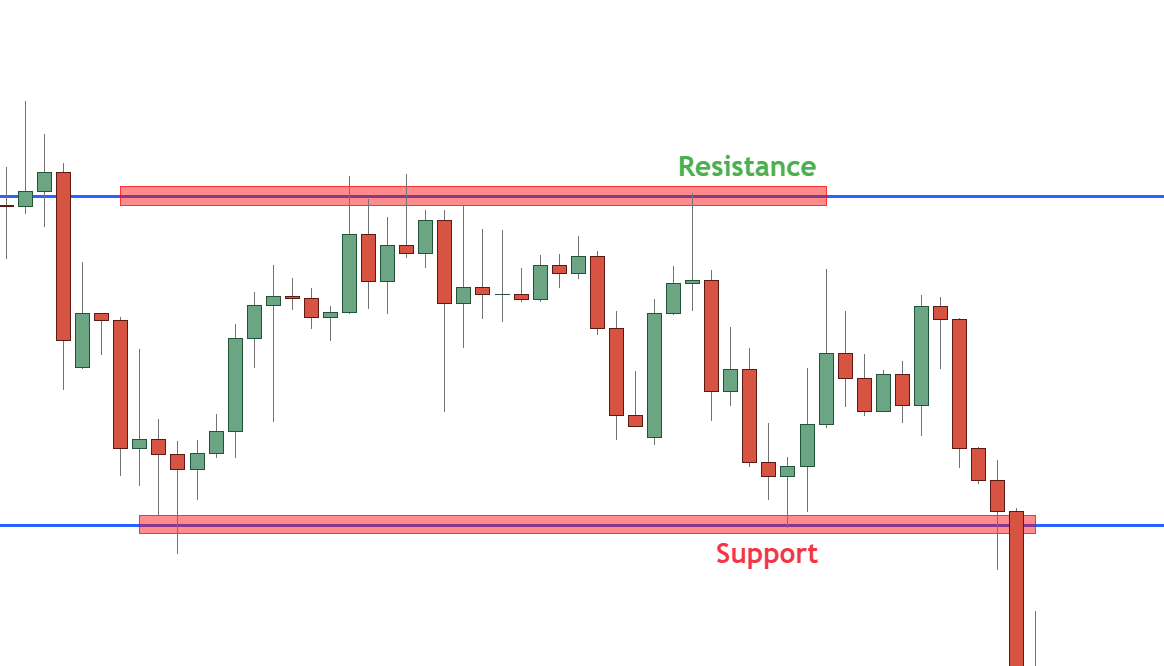
Alternatively, the immediate low denotes a point where the bears were exhausted, and sellers took control. So, if a digital asset tests the same high and low level, typically, it's treated as a strong resistance and support level.
Trend Indicators: Trend Lines and Channels
Trend Line: Support and Resistance
A trend is the state of the market, where the price action is a repeated sequence of higher highs and higher lows or lower lows and lower highs.
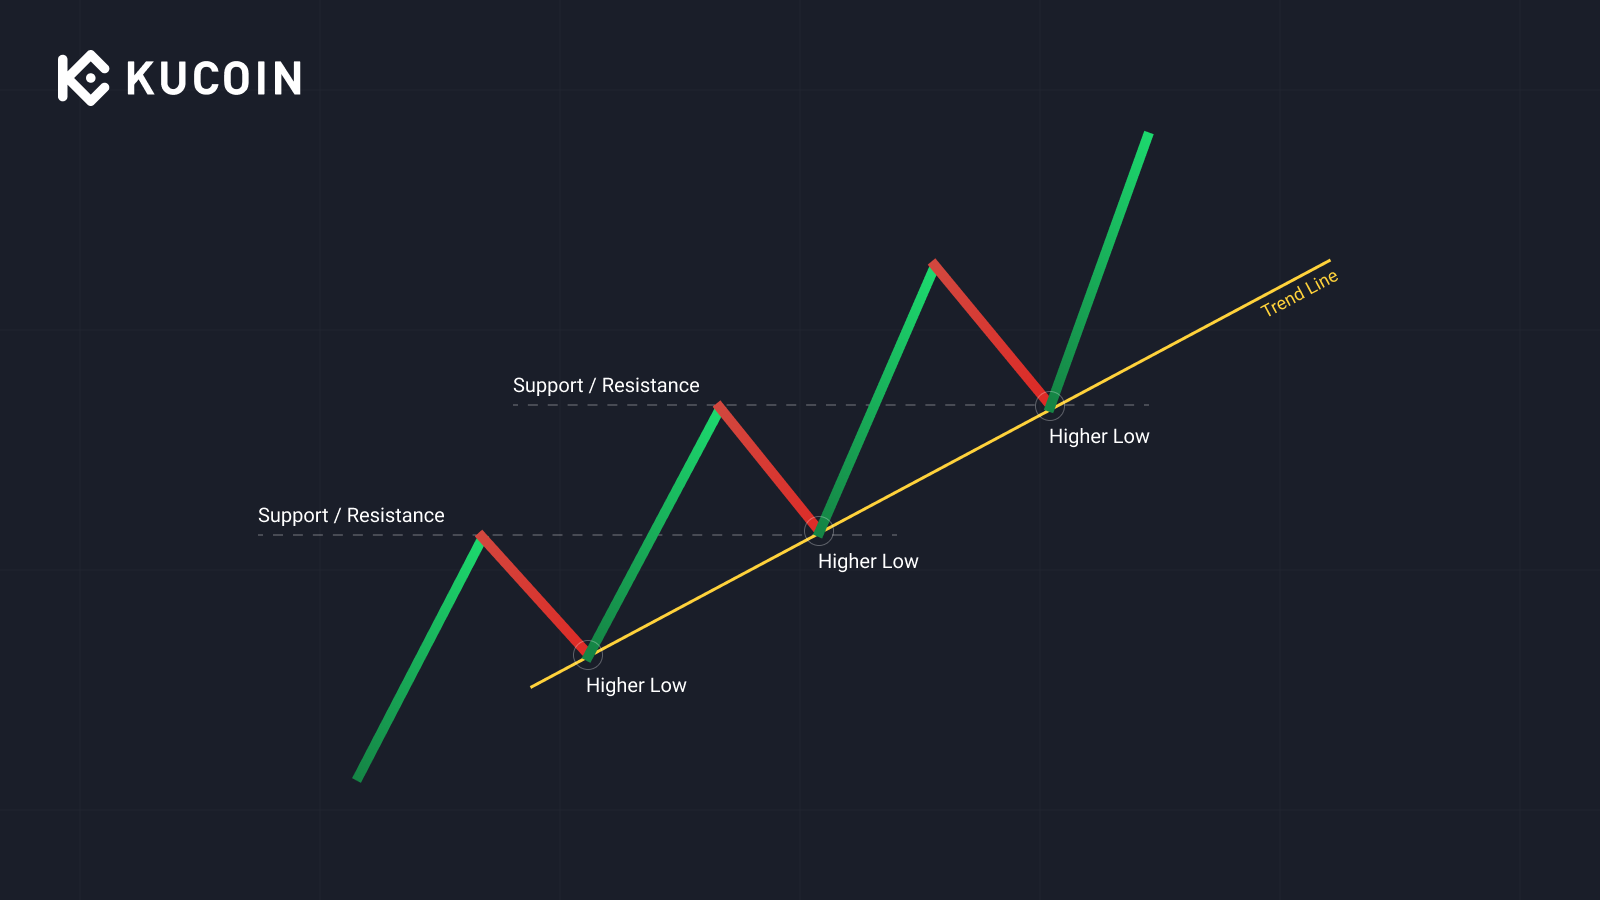
The market (retracement) typically holds at the support and resistance zones before continuing with the subsequent push — as shown in the illustration above.
A downward or descending trend line provides a resistance zone, while an upward or ascending trend line indicates a support zone.
Trend Channel: Support and Resistance
A trend channel is a set of two parallel trend lines defined by the highs and lows. A trend channel is called a price channel, as a cryptocurrency moves between two parallel trend lines.
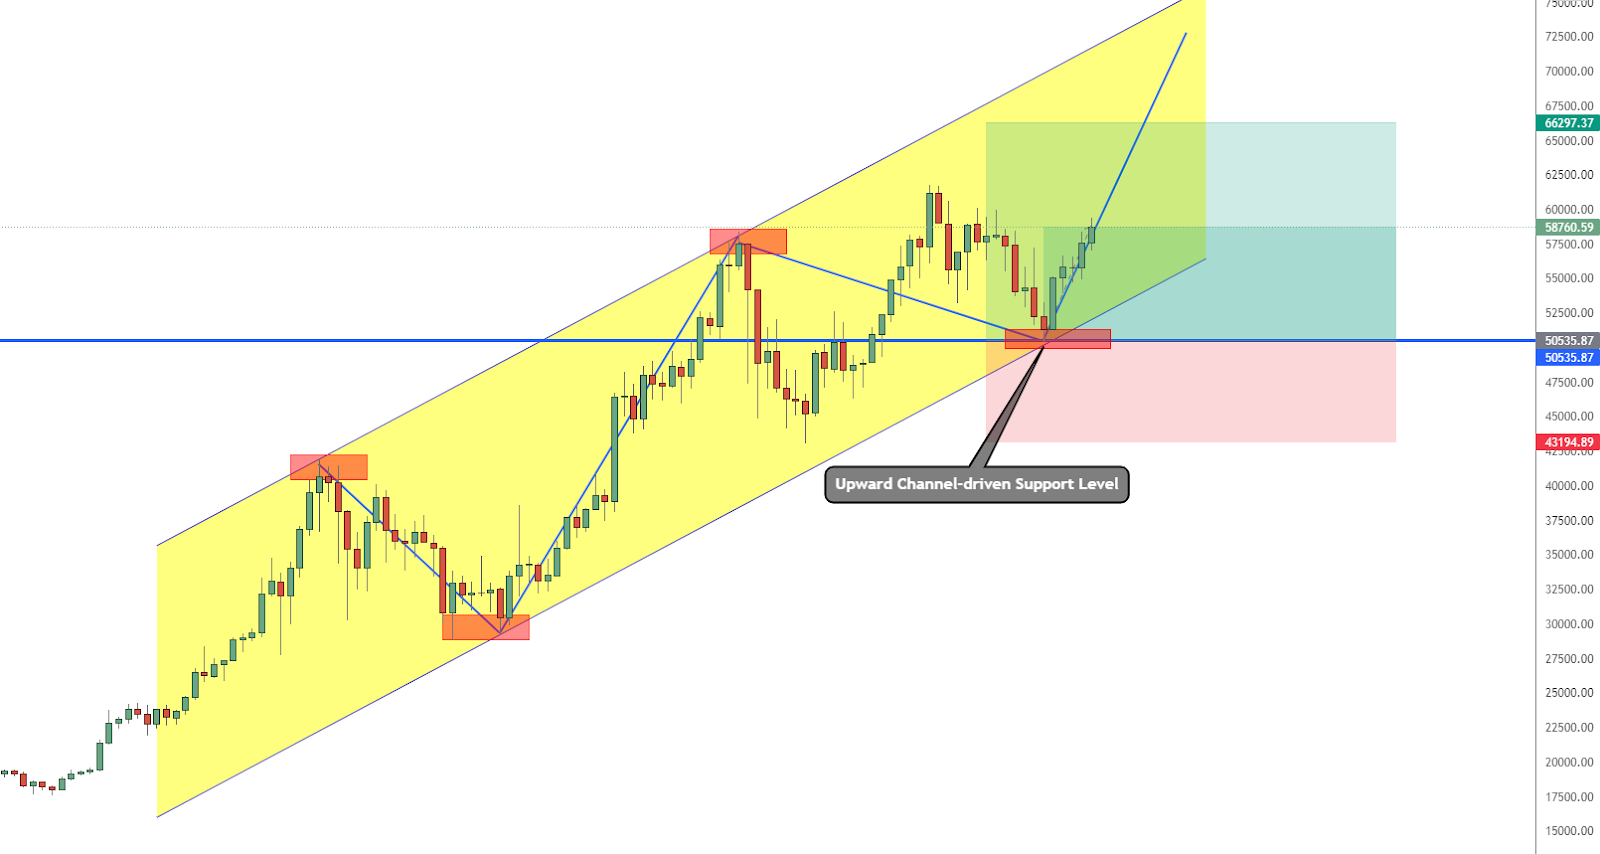
These trend channels are typically used as support and resistance levels and, thus, as entry and exit points in forex and cryptocurrency trading.
Fibonacci Retracement: Support and Resistance
Fibonacci is an infinite sequence of natural numbers. In crypto trading, the Fibonacci levels are the support and resistance levels derived using the famous number sequence. The Fibonacci retracement indicator offers a series of ratios, but the most important are 23.6%, 38.2%, 50%, and 61.8%.
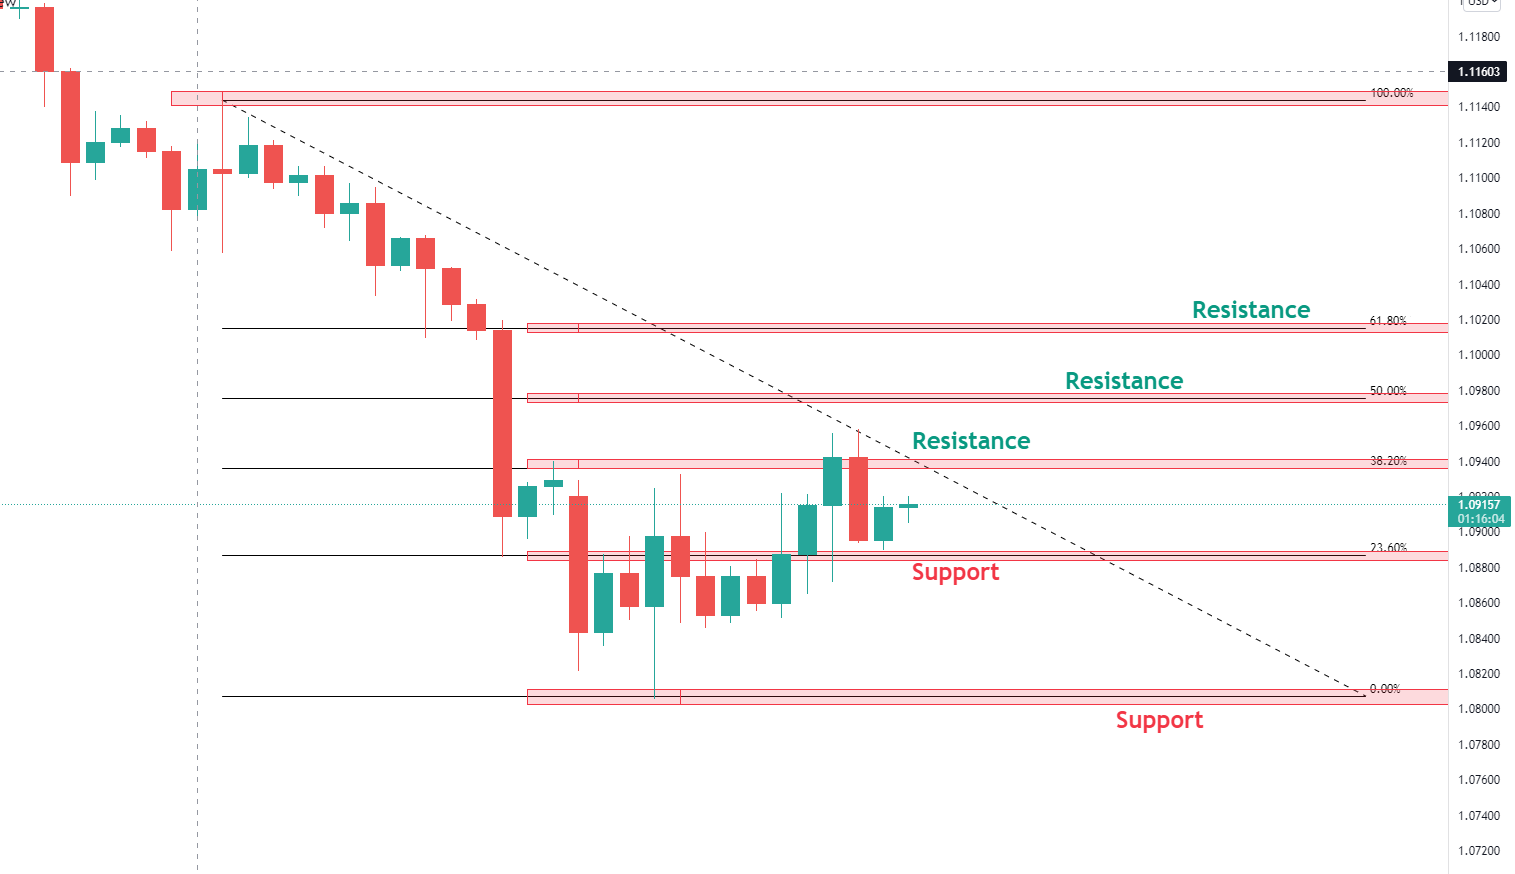
Depending on the current market price of a digital asset, the different lines can be used as support and resistance lines.
How to Trade Cryptocurrency Support and Resistance
Now that you have grasped support and resistance and how to spot them, it's time to use these simple but incredibly useful technical indicators in your trading.
Because we want things to be simple here at KuCoin Learn, we have divided how to trade support and resistance levels into two simple concepts:
-
Bounce-offs
-
Breakouts
Bounce-Offs
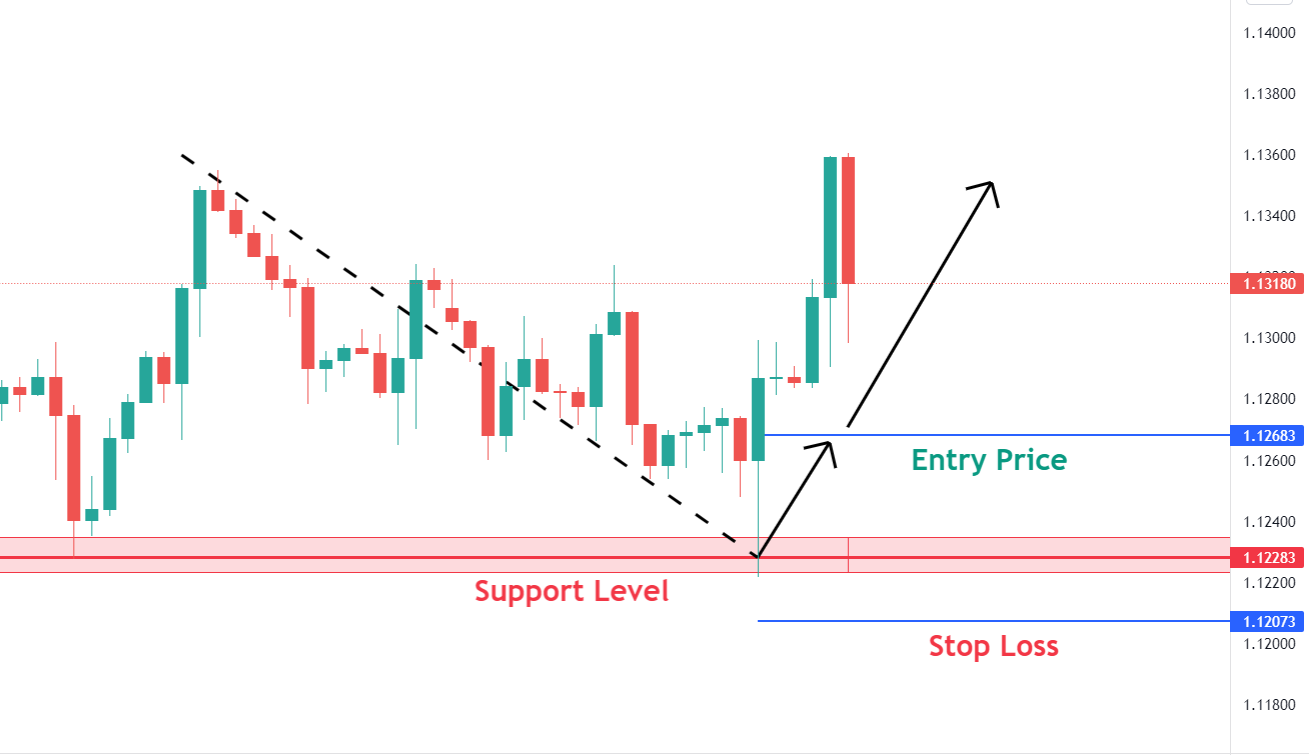
Trading support and resistance bounce-offs are one of the most commonly used methods. As the name implies, crypto traders wait for the market price to test a particular support level before trading the bounce-off.
However, rather than setting a buy or sell limit at the support and resistance levels, waiting for the market to test a specific trading level is preferable. The trade setup is validated when the candles close above the support line or below the resistance line.
The pair's price fell to test the support level in the illustration below. You should wait for the price to close above the support level before trading a potential bounce-off in the price level.
Alternatively, you can wait for the price to be rejected at resistance lines before trading crypto.
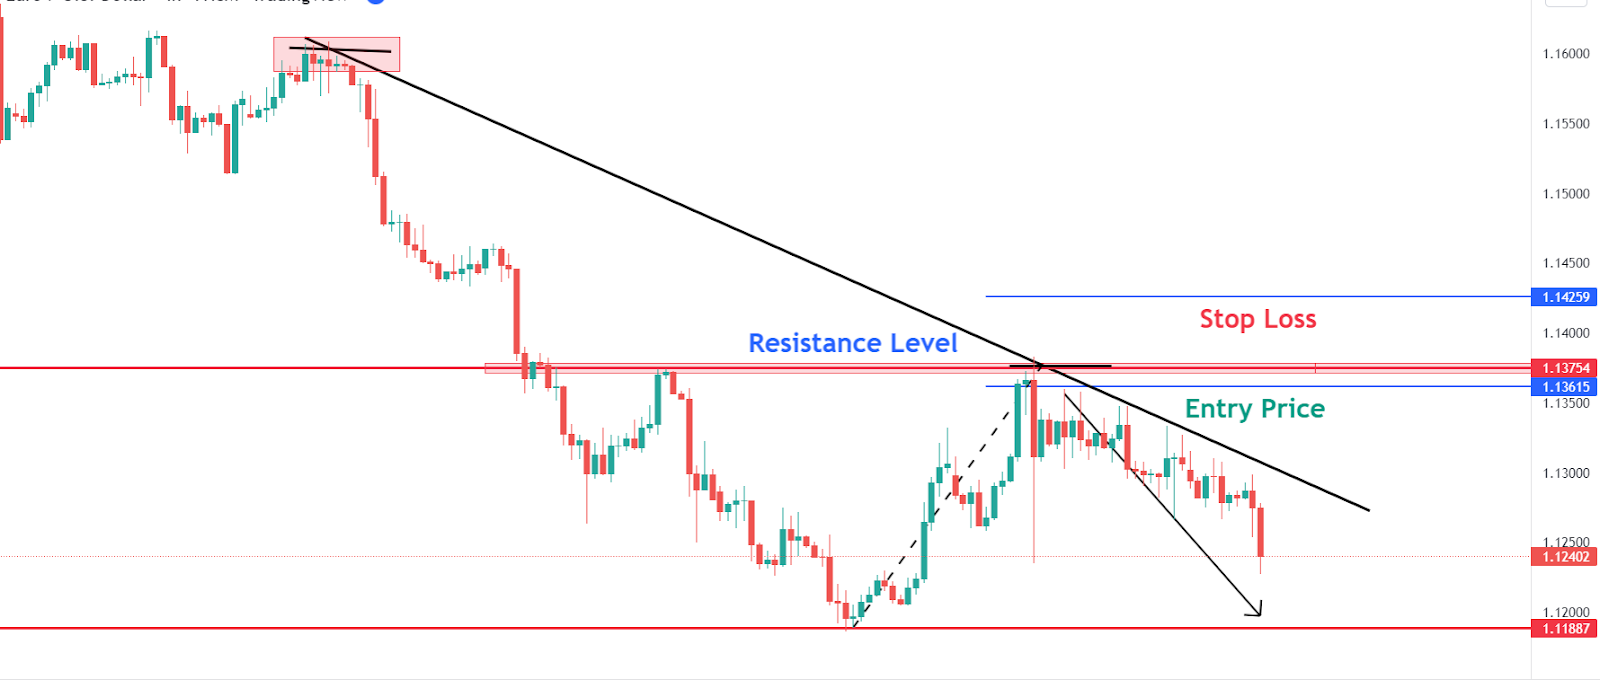
In the chart above, the digital asset's significant price points were rejected under the downward resistance line. Therefore, shorting the coin would be a good idea.
Breakouts
In an ideal world, the support and resistance levels would remain forever, making crypto market participants' lives easier and more profitable. The only constant in the crypto market is that it is not constant. Crypto trading is highly volatile, with coins frequently breaking out of support and resistance zones. As a result, you cannot rely solely on trading bounce-off.
This is where support or resistance area breakout trading comes into play.
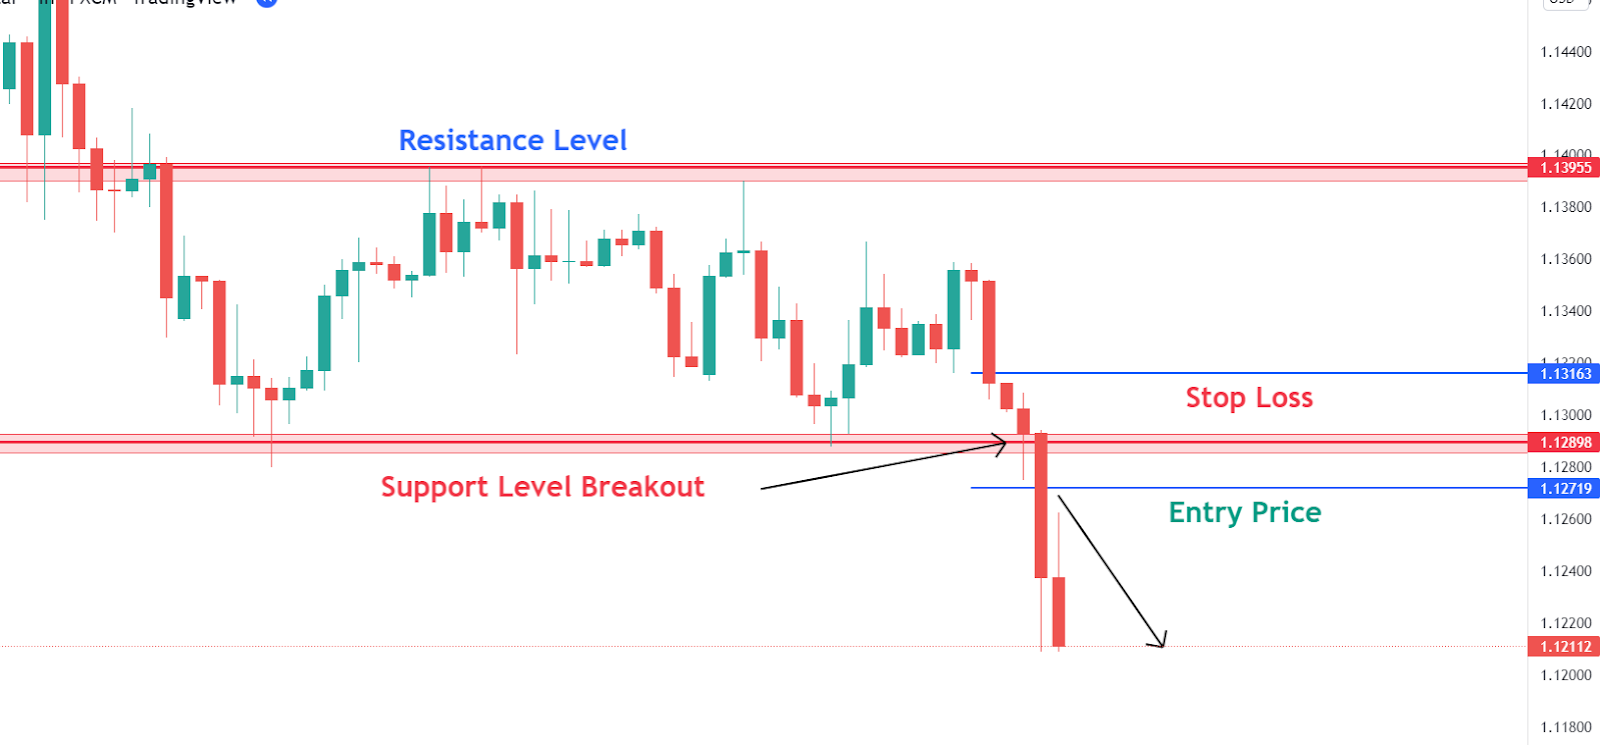
The simplest way to trade a breakout is to wait for the market to break above or below resistance and support levels. In the chart above, the digital asset's price level breaks below the strong support price. Hence, if the asset price closes under the previous support level, it will offer you an excellent breakout trade setup.
Conclusion
Support and resistance levels are integral components of most traders' trading strategies. Mastering these fundamental concepts is crucial for every investor navigating the dynamic world of crypto trading.
It's essential to recognize that various technical tools can help identify these zones, allowing you to trade profitably even with just one of many possible strategies. So, gear up to unlock the full potential of support and resistance levels in your crypto trading journey and stay ahead of the curve in the ever-evolving crypto market.
Disclaimer: The information on this page may come from third parties and does not necessarily reflect KuCoin’s views. It is provided for general reference only and should not be interpreted as financial or investment advice.
Virtual asset investments may involve risk. Please carefully assess the product risks and your own risk tolerance. For more information, please refer to our Terms of Use and Risk Disclosure.