

Top Trend, Momentum, and Volume Indicators You Must Know in 2026
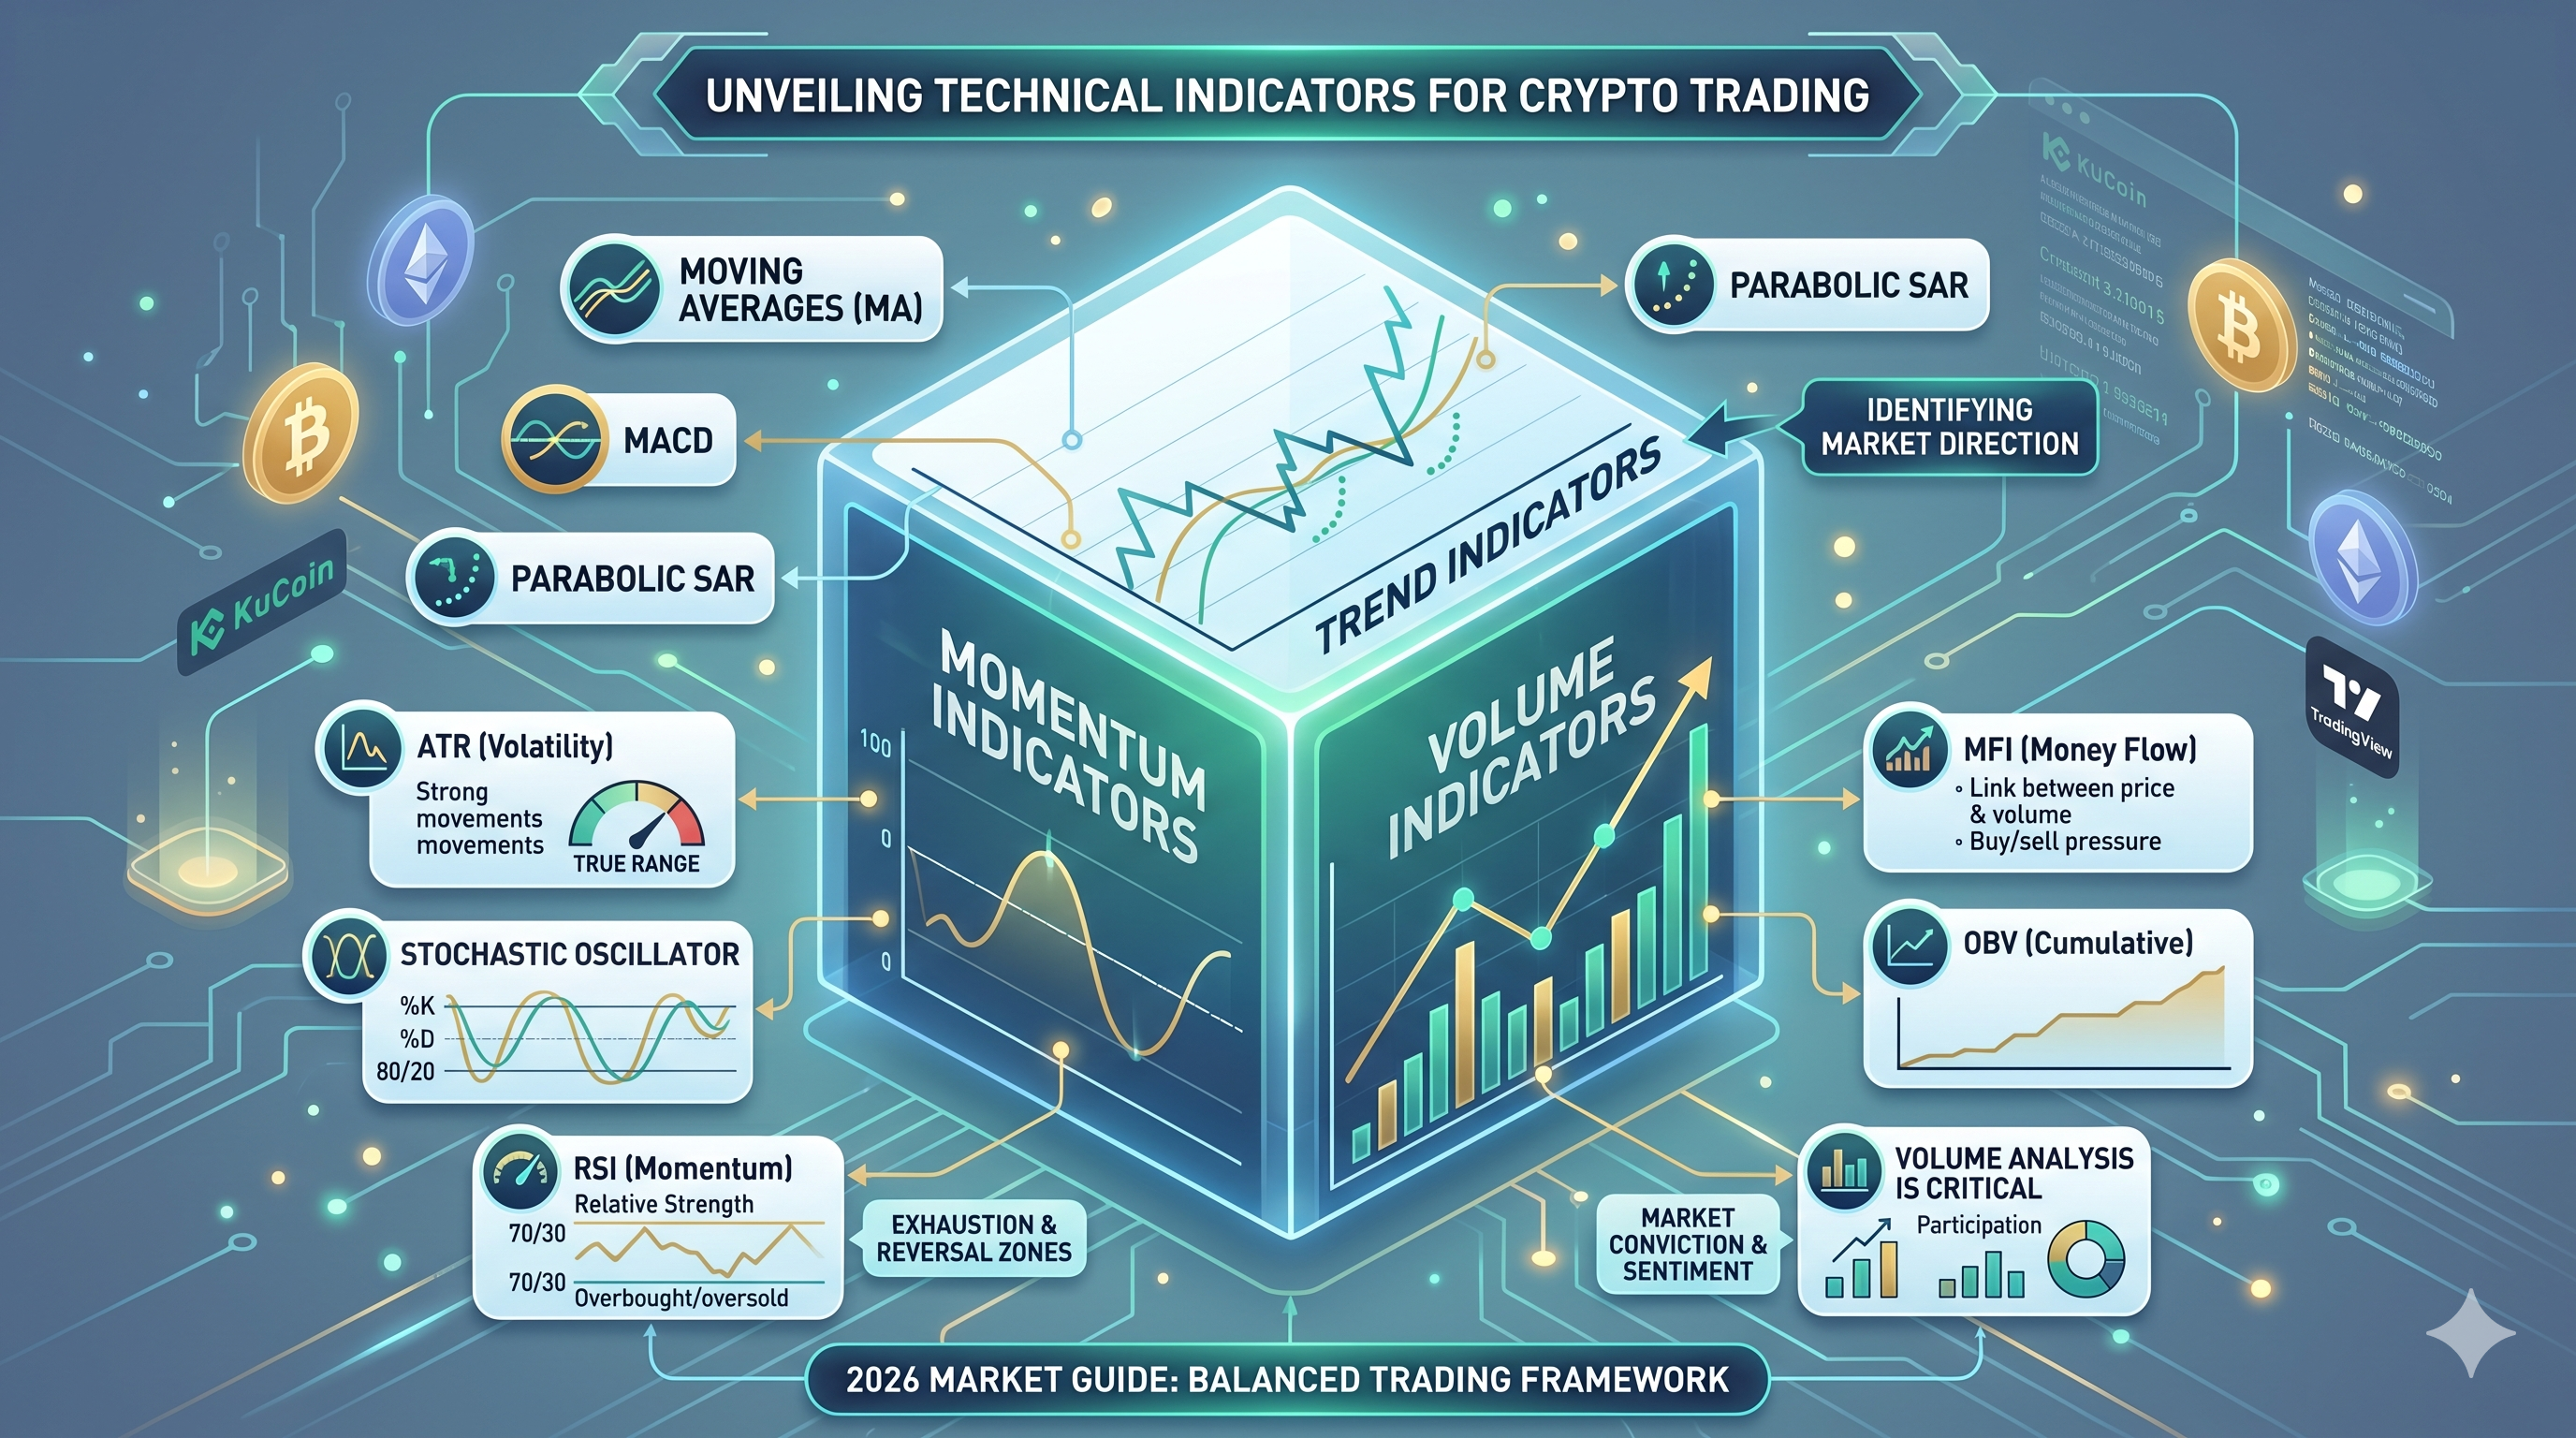
Introduction
Technical indicators remain one of the foundations of crypto trading and market analysis. Whether you are trading Bitcoin, Ethereum, or emerging altcoins, indicators help traders identify trends, momentum shifts, volatility, and market sentiment in real time. However, one of the biggest mistakes beginners make is overcrowding their charts with too many indicators that provide overlapping signals. In modern crypto markets, especially after the high-volatility cycles of 2024 and 2025, traders have increasingly shifted toward cleaner chart setups that combine only a few complementary indicators for higher-quality signals.
Instead of using ten indicators that all measure similar data, professional traders often combine one trend indicator, one momentum indicator, and one volume indicator to create a balanced trading framework. This approach helps traders filter market noise, improve timing, and reduce emotional decision-making during periods of extreme volatility.
Why Technical Indicators Still Matter in the 2026 Crypto Market
The crypto market has evolved significantly over the past few years. With the launch of spot Bitcoin ETFs, increasing institutional participation, AI-driven trading bots, and higher derivatives market activity, price movements have become faster and more reactive to macroeconomic events. As a result, technical indicators are now more important than ever for short-term and medium-term traders.
In 2025 and early 2026, crypto traders witnessed multiple sharp volatility events triggered by global liquidity concerns, leveraged liquidations, and sudden shifts in Bitcoin dominance. During these periods, indicators such as RSI, MACD, ATR, and volume-based tools helped traders identify exhaustion zones, breakout confirmations, and potential reversals earlier than relying solely on price action.
Modern traders also increasingly combine technical indicators with on-chain metrics, funding rates, and market sentiment analysis to improve decision-making. While no indicator guarantees profits, disciplined use of technical analysis can significantly improve risk management and trading consistency in highly volatile crypto markets.
Trend Indicators
As the name suggests, these indicators only show the direction of the price action – uptrend, downtrend, or a non-trending market. They analyze the current trend in the market. Is there a sideways phase, or is there a strong trend? The indicator indicates which trend you are in. Trend trading is a method that aims to make profits by examining the dynamics of a tool in a particular direction. When the prevailing price movement points up or down, it is called a trend. The best trend indicators include:
Moving Averages (MA)
Moving Averages remain one of the most widely used trend indicators in cryptocurrency trading. They smooth out short-term price fluctuations and help traders identify the broader market direction. In crypto markets, traders commonly use the 20-day, 50-day, and 200-day moving averages to determine bullish or bearish momentum.
When the price trades above a major moving average, it typically signals bullish market conditions, while trading below the moving average often indicates bearish sentiment. Many traders also use moving averages as dynamic support and resistance levels during trending markets.
A particularly popular strategy in crypto trading is the “golden cross” and “death cross.” A golden cross occurs when a shorter-term moving average crosses above a longer-term moving average, often signaling the beginning of a strong uptrend. Conversely, a death cross may indicate weakening momentum and potential downside risk.
Moving Average Convergence/Divergence (MACD)
MACD: It shows you when a new trend has started and when it may have ended. The intersection of the two lines indicates a change in trend. Typically, this indicator is suitable for determining longer-term trends.
The elegance of the MACD is that it shows both trend and momentum. When the MACD is above the signal line, it shows a strong bullish momentum, and when the MACD is below the signal line, it shows a strong bearish momentum
Combining MACD With Volume Confirmation
In recent crypto market cycles, traders have increasingly used MACD together with volume indicators to avoid false breakout signals. A bullish MACD crossover accompanied by rising trading volume often provides a stronger confirmation of trend continuation. On the other hand, weak volume during a breakout may suggest a potential fakeout or short-lived rally.
This became especially relevant during the highly leveraged market conditions seen across Bitcoin and altcoins in 2025, where rapid liquidations frequently caused temporary price spikes without sustainable momentum.
Commodity Channel Index (CCI)
The CCI is one of the best-known oscillators for measuring trend reversals. Here, the deviation of the value of an asset is related to its statistical average.
Parabolic SAR
The Parabolic SAR indicator is a typical trend following indicator suitable for trailing stops or manual shifting of the stop loss. A complicated formula displays the points in the chart. It is well suited to identify and act on a trend.
Momentum Indicators
Momentum indicators indicate when the market is overbought or oversold. This can be used very well for reverse trades or position closures. In their basic form, they are used to show the strength of the current price action. That means you can use the momentum indicators to easily identify the areas of potential reversals and catch trends just when it’s starting to form. The best momentum indicators for the crypto market are:
ATR – Average True Range
The ATR (Average True Range) indicator measures volatility over a given period. Volatility means how many points of movement the market makes. There are volatile markets and markets with less volatility. The stronger the movements, the more profit or loss can be made.
The Stochastic Oscillator
This oscillator has two (exponential) average lines called the %K line and %D line, oscillating between 0 and 100. When the stochastic is above 80 shows an overbought market, and you should search for short-selling signals, and when it’s below 20 shows an oversold market, and you should look out for buy signals.
RSI – Relative Strength Index
The Relative Strength Index (RSI) is one of the most popular momentum indicators among crypto traders because it helps identify overbought and oversold market conditions. The RSI oscillates between 0 and 100 and measures the speed and magnitude of recent price movements.
Traditionally, an RSI above 70 suggests that an asset may be overbought, while an RSI below 30 may indicate oversold conditions. However, experienced traders understand that strong bull markets can keep RSI elevated for extended periods, especially during aggressive Bitcoin rallies or meme coin surges.
For this reason, many advanced traders now combine RSI with trend indicators such as moving averages or support and resistance zones before making trading decisions. RSI divergence is also widely used in crypto trading. For example, when price reaches a new high while RSI forms a lower high, it may signal weakening momentum and a possible reversal.
Volume Indicators
In the crypto market, nothing shows the market sentiment better than the volume traded. The volume indicates the level of activity in the market. The assumption that the volume runs ahead of the prices is the basis of volume analysis. In an uptrend, the volume should increase in phases with rising prices and decrease in the case of falling prices. In a downward trend, the volume is expected to increase with falling prices and decrease in phases with rising prices. The best volume indicators include:
Why Volume Analysis Is Critical in Crypto Trading
Unlike traditional stock markets that operate within fixed trading hours, the crypto market trades 24/7. Because of this nonstop activity, trading volume becomes one of the clearest indicators of market participation and sentiment.
Large increases in volume often appear during breakouts, major news events, ETF-related announcements, or periods of panic selling. Monitoring volume can help traders determine whether a price move has strong market conviction or is simply driven by short-term speculation.
In recent years, traders have also started monitoring derivatives volume, open interest, and liquidation data alongside spot trading volume to better understand overall market positioning.
The Money Flow Index (MFI)
The MFI is a volume-weighted RSI. Essentially, this is a link between price/price and volume on the one hand and the momentum analysis, on the other hand, to assess the current buy and sell pressure.
On Balance Volume (OBV)
The OBV is a cumulative volume indicator in which price/price and volume are related. It is unique because the values do not play a role in the indicator.
Conclusion
Technical indicators are powerful tools that help crypto traders analyze market trends, momentum, volatility, and trading activity. However, indicators should not be used in isolation. Successful traders often combine multiple forms of analysis, including price action, support and resistance levels, volume confirmation, and risk management strategies.
In today’s fast-moving crypto environment, maintaining a simple and disciplined trading system is often more effective than relying on excessive indicators that create conflicting signals. A balanced combination of trend, momentum, and volume indicators can help traders improve decision-making while reducing emotional trading mistakes.
As always, traders should remember that no indicator guarantees success. Proper position sizing, stop-loss management, and continuous market education remain essential for long-term survival in the crypto market.
FAQs
1. What is the best technical indicator for crypto trading?
There is no single “best” indicator for crypto trading because different indicators serve different purposes. Many traders combine Moving Averages for trend analysis, RSI for momentum, and volume indicators such as OBV or MFI for confirmation.
2. Are technical indicators reliable in highly volatile crypto markets?
Technical indicators can be useful in volatile markets, but they are not perfect predictors. During extreme volatility, traders should combine indicators with proper risk management and avoid relying on a single signal.
3. How many indicators should traders use on one chart?
Most professional traders prefer using only a few complementary indicators. Using too many indicators can create conflicting signals and lead to analysis paralysis.
4. Which indicator is best for identifying trend reversals?
Indicators such as MACD, RSI divergence, CCI, and Parabolic SAR are commonly used to identify potential trend reversals. However, traders often wait for additional confirmation before entering trades.
5. Why is volume important in crypto trading?
Volume helps traders understand market participation and the strength behind price movements. Strong volume during a breakout may confirm trend continuation, while weak volume could signal a false breakout.