

Trading 101: The Most Effective Ways of Trading the Channel Pattern

Introduction
Technical analysis remains one of the most widely used methods for navigating the cryptocurrency market, especially in highly volatile trading environments. From indicator-based strategies to chart patterns and price action analysis, traders rely on different tools to identify market trends and potential trading opportunities. Among the most practical and beginner-friendly chart structures is the Channel Pattern, a formation that helps traders recognize trend continuation, breakout opportunities, and possible reversals.
In crypto trading, price rarely moves randomly. Instead, assets often follow recognizable structures driven by market psychology, liquidity flows, and trader behavior. Channel patterns are one of the clearest examples of this phenomenon. Whether Bitcoin, Ethereum, or altcoins are trending upward or downward, channels frequently appear across multiple timeframes and can provide traders with valuable entry and exit zones.
As crypto markets mature in 2026 with increasing institutional participation, AI-driven trading systems, and stronger derivatives activity, channel trading remains highly relevant. Traders now combine channel analysis with volume indicators, RSI divergence, and breakout confirmation tools to improve trading accuracy and reduce false signals.
Why Channel Patterns Still Matter in 2026
Despite the rise of algorithmic trading and AI-powered market analysis, channel patterns remain one of the most reliable technical structures in cryptocurrency trading. One reason is that channels visually represent the ongoing battle between buyers and sellers while clearly defining areas of support and resistance.
In modern crypto markets, channel formations are commonly seen during periods of consolidation before major breakouts. Bitcoin and major altcoins frequently trade inside ascending or descending channels before reacting to macroeconomic events such as Federal Reserve rate decisions, Bitcoin ETF inflows, or sudden changes in market sentiment.
Another reason channel patterns continue to be popular is their adaptability across different trading styles. Day traders use short-term channels on lower timeframes such as the 15-minute or 1-hour chart, while swing traders often analyze 4-hour and daily channel structures to capture larger market moves.
Professional traders also combine channel analysis with trading volume and momentum indicators. For example, a breakout above a bearish channel accompanied by strong volume often signals a more sustainable bullish reversal compared to a low-volume breakout.
Common Mistakes Traders Make When Trading Channels
Although channel patterns appear simple, many traders misuse them and end up entering trades too early or too late. One of the most common mistakes is trading every touch of support or resistance without waiting for confirmation. In volatile crypto markets, fakeouts are extremely common, especially during high-leverage trading sessions.
Another mistake is ignoring the broader market trend. For instance, buying the lower boundary of a downward channel during a strong macro bearish environment can be extremely risky, even if the technical setup appears attractive.
Risk management is also critical when trading channels. Traders should avoid placing stop-loss orders too close to the channel boundaries because crypto assets often experience temporary liquidity sweeps before reversing direction.
Additionally, breakout trades should ideally be confirmed with increased volume. A weak breakout without momentum may simply result in the price returning back inside the channel, trapping traders on the wrong side of the market.
Types of Channel Pattern
Essentially, there are two types of Channel patterns based on the market trajectory.
Upward Channel
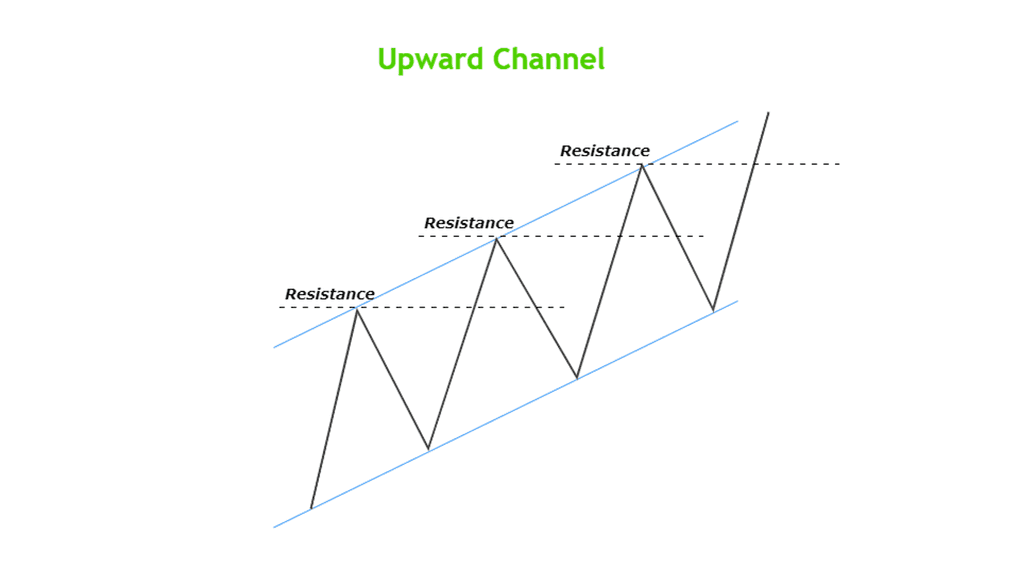
Upward Channel, also referred to as Bullish Channel, is one of the types where the market makes higher highs and higher lows, whose pullbacks go deeper and beneath the Resistance.
Significance
The pattern sequence of an upward channel signifies that the buyers are willing to buy the underlying asset at a higher and higher price. But, on the flip side, the retracements being deeper than a trend, it could also mean that the bulls are losing out of steam, and the market could reverse anytime soon.
Downward Channel
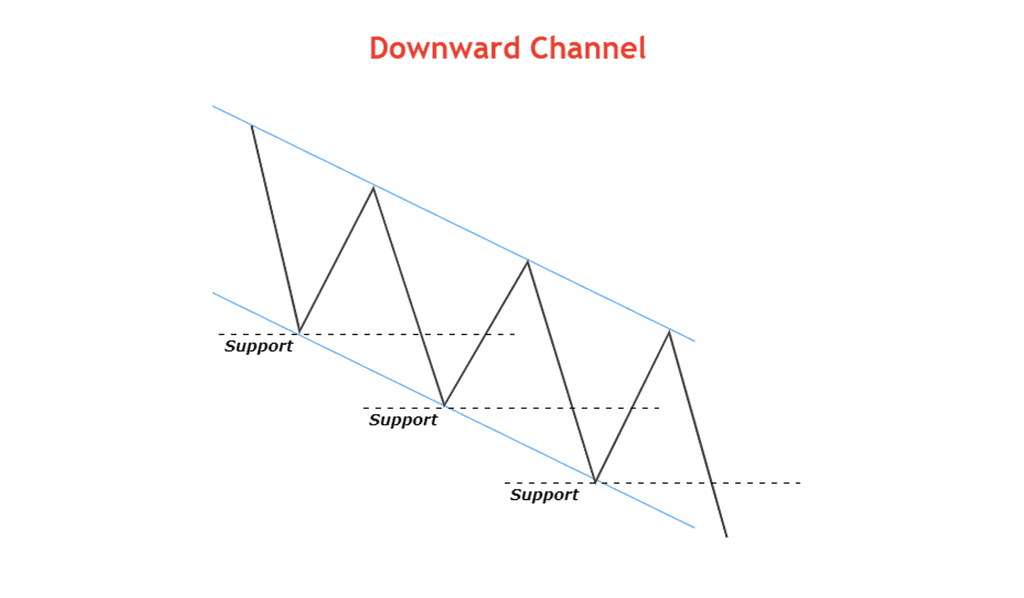
A downward channel is opposite to that of an upward channel. The downward Channel is made of a set of lower lows and lower highs where the price tests levels above the Support before proceeding south. Or in simple terms, it is a range that is slightly tilted to the downside.
Significance
With the price making lower low sequences, a bearish channel signifies pressure coming in from the sellers. It indicates that the low demand and increase in supply could drive the prices much lower in the subsequent trading sessions.
That being said, the retracements not reacting off from the Support to head south also signifies that the bulls are fighting back, but not as powerful as the bears.
How to Trade the Channel Pattern?
With a couple of interpretations on the channel pattern, it can be traded in anticipation of a trend continuation or trend reversal. The trend continuation trading methodology using the Channel pattern is based on buying/selling from the bottom/top of the Channel, while a trend reversal anticipation is based on the market breaking through the channel pattern.
Trading the Channel Pattern - Trend Continuation
From a design perspective, a channel is made up of a pair of parallel lines. If the Channel has been identified correctly, the price tends to bounce off from the lines and move in the other direction. Technically speaking, the bottom of the Channel acts as a Support, while the top of the Channel acts as a Resistance.
The basic yet effective method to trade the channel pattern is by buying it at the Support and shorting it at the Resistance. To ensure better accuracy and efficiency, it is logical to go long in an upward channel and short on a downward Channel.
In the Bitcoin price chart below, traders can go short from the Resistance of the Channel, as it is a bearish channel.
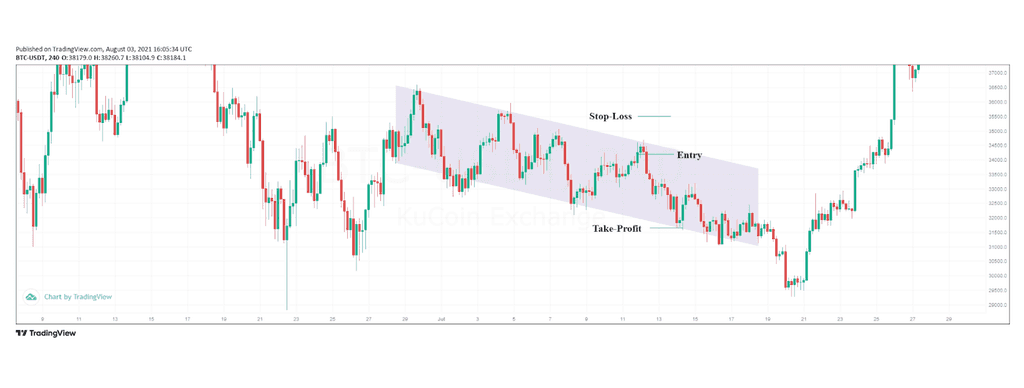
Downward Channel Formation on the Bitcoin chart - Source: BTC/USDT
Trading the Channel Pattern - Trend Reversal
A channel, when comprehended as the losing out of momentum, traders can look out for reversal opportunities. When the market breaks below the Support of an upward channel, it is an indication for a reversal to the downside. Conversely, the market breaking above the Resistance of a downward channel is an implication for a reversal to the north.
In the Litecoin price chart below, traders can go short when the price breaches below the Support of the upward Channel.
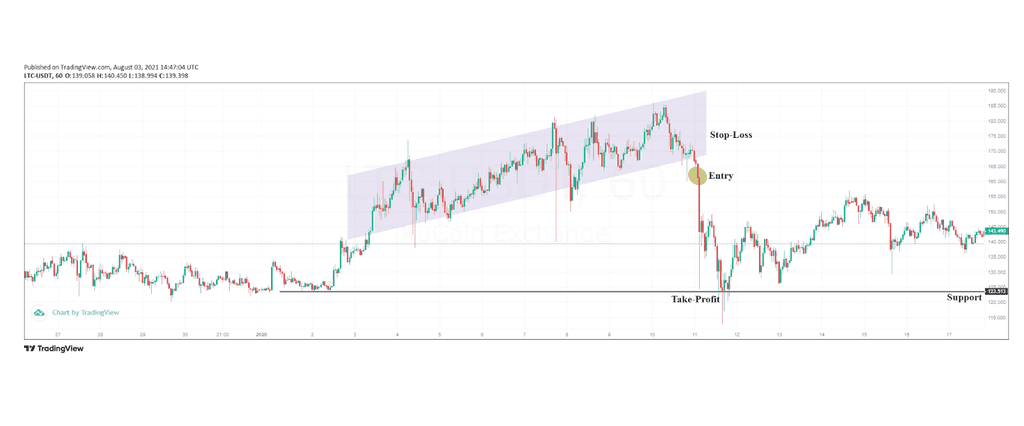
Upward Channel Formation on the Litecoin chart - Source: LTC/USDT
Conclusion
The Channel Pattern remains one of the most practical and versatile chart formations in cryptocurrency trading. Whether traders are looking to identify trend continuation opportunities, breakout reversals, or optimal support and resistance zones, channels provide a structured framework for understanding market behavior.
In today’s fast-moving crypto environment, successful channel trading requires more than simply drawing parallel lines. Traders should combine channel analysis with volume confirmation, momentum indicators, and proper risk management to reduce false signals and improve consistency.
As Bitcoin and altcoin markets continue evolving in 2026, mastering classic technical analysis tools like channel patterns can still provide traders with a significant advantage. With advanced charting features available on KuCoin and TradingView integration, traders can efficiently analyze channel formations across multiple crypto assets and timeframes.
FAQs
What is a channel pattern in crypto trading?
A channel pattern is a chart formation where the price moves between two parallel trendlines that act as support and resistance. It helps traders identify trends, breakout opportunities, and potential reversals.
Is channel trading suitable for beginners?
Yes. Channel patterns are considered one of the easier technical analysis concepts for beginners because the support and resistance zones are visually clear and relatively easy to identify.
Which indicators work best with channel patterns?
Popular indicators used alongside channel patterns include RSI, MACD, trading volume, moving averages, and Bollinger Bands. These tools help traders confirm momentum and reduce false breakout signals.
Can channel patterns be used on all timeframes?
Yes. Channel patterns can appear on lower timeframes for short-term trading and on higher timeframes for swing trading or long-term market analysis.
How can traders avoid false breakouts in channel trading?
Traders can reduce false breakout risks by waiting for volume confirmation, candle closes outside the channel, and retests of broken support or resistance levels before entering trades.