


What is RSI in Trading? A Comprehensive Guide to the Relative Strength Index
2026/03/21 07:30:00
In the fast-paced world of cryptocurrency and stock markets, understanding market momentum is the difference between a successful trade and a costly mistake. Among the myriad of technical indicators available, one stands out for its reliability and simplicity: the RSI. If you have ever wondered what is RSI or what is RSI in trading, this 2026 guide will break down everything from basic calculations to advanced divergence strategies.
Key Takeaways
-
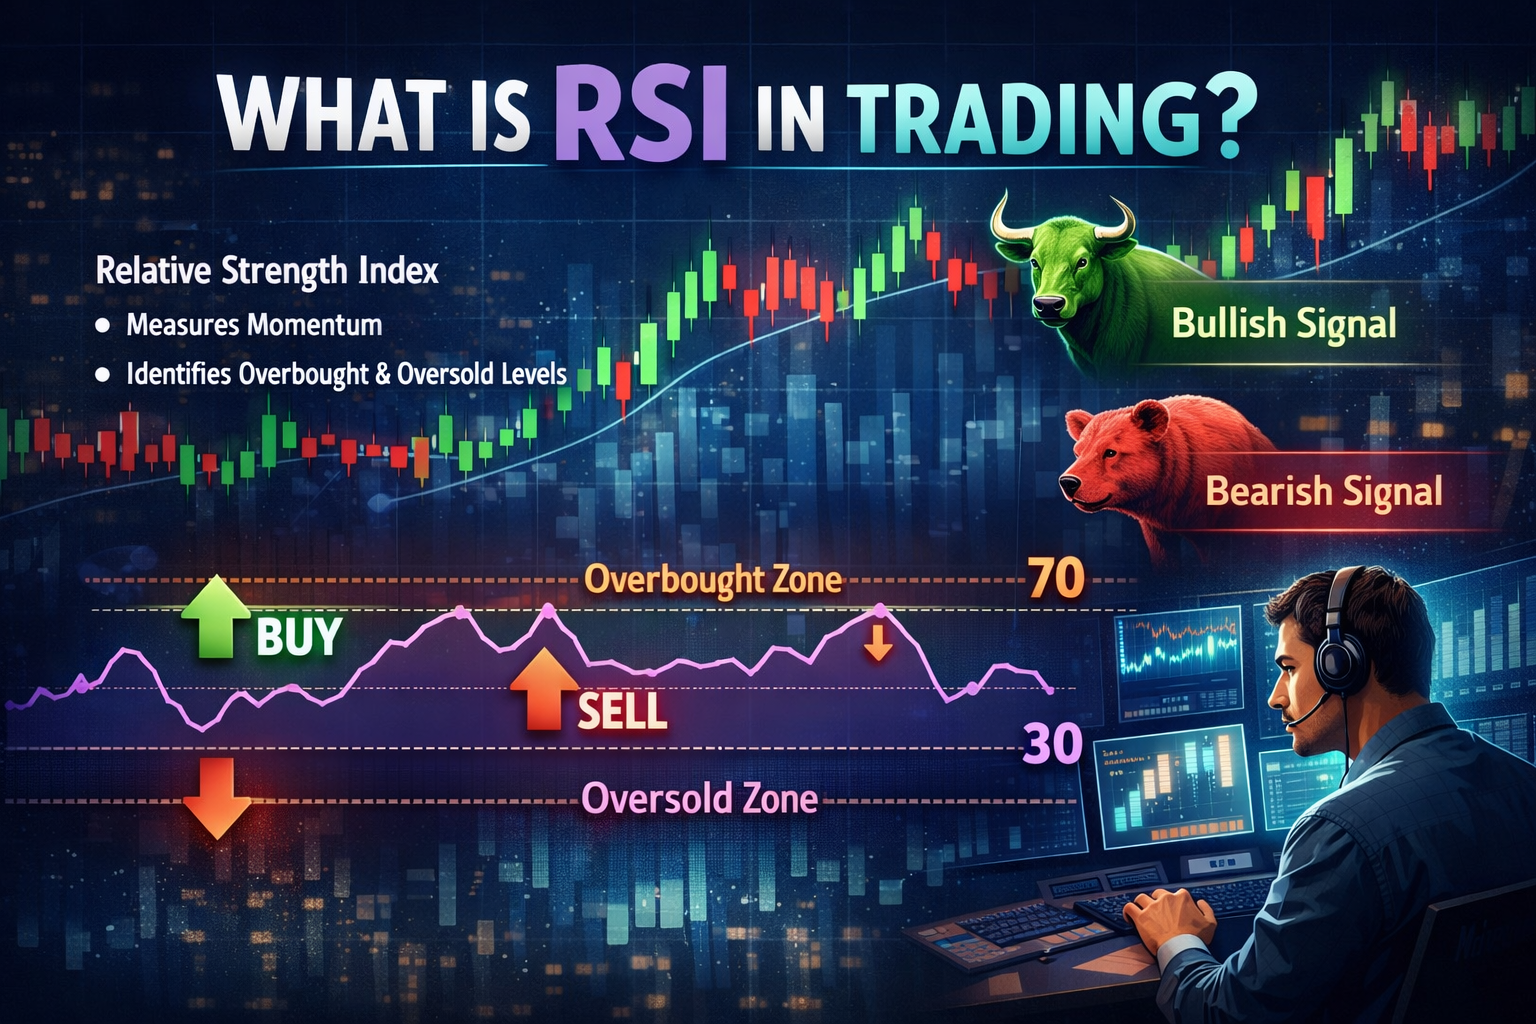
Definition: The RSI (Relative Strength Index) is a momentum oscillator that measures the speed and change of price movements on a scale of 0 to 100.
-
Overbought/Oversold: Traditionally, an RSI above 70 indicates an overbought condition, while an RSI below 30 suggests an oversold condition.
-
Trend Identification: The 50-level acts as a midline; staying above 50 generally indicates a bullish trend, while staying below 50 indicates a bearish trend.
-
Divergence: This is the most powerful signal of what is RSI in trading, occurring when the price movement and the indicator move in opposite directions, signaling a potential reversal.
What is RSI (Relative Strength Index)?
To understand what is RSI, we must look back to 1978 when J. Welles Wilder Jr. introduced the concept. It is a technical indicator used in the analysis of financial markets to chart the current and historical strength or weakness of a stock or crypto asset based on the closing prices of a recent trading period.
In modern 2026 trading, the RSI remains a staple because it provides a visual representation of market psychology. It doesn't just tell you where the price is; it tells you how much "fuel" is left in the current trend.
How to Apply RSI Indicator to KuCoin Charts
If you are trading on a professional exchange like KuCoin, applying the RSI is a straightforward process that can significantly enhance your decision-making.
Step 1: Choose Indicators
Open your desired trading pair (e.g., BTC/USDT) and locate the "Indicators" icon at the top of the chart interface.
Step 2: Search for RSI Indicator
In the search bar, type "Relative Strength Index." You will see it listed under momentum oscillators. Click to add it to your chart.
Step 3: Select RSI Settings
The default setting is 14 periods. While some day traders shorten this to 7 or 9 for more sensitivity, the 14-period RSI is considered the industry standard for reducing "market noise."
How to Calculate RSI
While most platforms calculate the RSI automatically, knowing the math behind it helps you grasp what is RSI in trading at a deeper level.
The Standard Formula
The calculation involves two steps:
-
Relative Strength (RS): This is the average gain of up-periods during the specified time frame divided by the average loss of down-periods.
- RS = Average Gain / Average Loss
-
The RSI Formula:
- RSI = 100 - [100 / (1 + RS)]
By using this formula, the RSI stays bound between 0 and 100, making it easy to compare different assets regardless of their actual dollar price.
How to Read RSI Signals
Learning what is RSI is only half the battle; you must also know how to interpret the signals it generates to enter and exit trades effectively.
Overbought RSI (Sell Signal)
When the RSI rises above 70, the asset is considered "overbought." This suggests that the price has risen too far, too fast, and a correction or consolidation is likely. In a "blow-off top" scenario, the RSI may even reach 90.
Oversold RSI (Buy Signal)
When the RSI drops below 30, the asset is "oversold." This indicates that sellers have exhausted their momentum, and the asset might be undervalued in the short term, presenting a buying opportunity.
Finding Convergence and Divergence Through the RSI
When asking what is RSI in trading, professional traders often point to Divergence as the "Holy Grail" of reversal signals.
Convergence
Convergence occurs when the price and the RSI move in the same direction. If BTC is making higher highs and the RSI is also making higher highs, the trend is confirmed and healthy.
Divergence
Divergence happens when the price and the RSI disagree.
-
Bullish Divergence: The price makes a "Lower Low," but the RSI makes a "Higher Low." This means the downward pressure is fading.
-
Bearish Divergence: The price makes a "Higher High," but the RSI makes a "Lower High." This is a classic warning that the rally is losing steam.
Convergence and Divergence: Explained
To truly grasp what is RSI in trading, imagine a car driving up a hill. The price is the car's position, and the RSI is the tachometer (RPM).
-
If the car is reaching a higher point on the hill but the RPM is dropping, the engine is losing power. This is Bearish Divergence.
-
Even though the car is still moving upward, you can predict it will soon slow down or roll back. This logic allows traders to anticipate reversals before they actually happen on the price chart.
How to Apply RSI in Crypto Trading
Crypto markets are notoriously volatile. When applying the RSI, keep these 2026-specific tips in mind:
Choose the Right Timeframe
-
Day Trading: Use the 15-minute or 1-hour chart. The RSI moves quickly here, providing many signals.
-
Swing Trading: Use the 4-hour or Daily chart. A divergence on the Daily RSI is one of the most reliable signals in all of technical analysis.
The 50-Level Crossover
Traders often use the 50-line as a trend filter. If the RSI crosses from below 50 to above 50, it is often seen as a confirmation that the bulls have taken control of the market momentum.
Finding Overbought & Oversold Signals: Pro Tips
While the 70/30 rule is standard, it isn't a magic wand. Here is how to optimize your RSI signals:
-
Combine with Trendlines: If the RSI is oversold but the price is still below a major downward trendline, wait for the trendline break before buying.
-
Watch for Failure Swings: A "Failure Swing" occurs when the RSI enters the overbought zone, drops below a previous low, and fails to get back above the overbought level. This is a strong confirmation of a trend change.
-
Use Support and Resistance: Look for horizontal support/resistance levels within the RSI window itself. Often, the RSI will find support at 40 during a strong bull market.
Conclusion
The RSI is an indispensable tool for anyone serious about digital assets. By understanding what is RSI and what is RSI in trading, you gain the ability to look "under the hood" of price action to see the underlying strength of a move.
However, no single indicator is perfect. The most successful traders combine the RSI with other tools like MACD, Bollinger Bands, and volume analysis to create a robust trading system. Always remember that in a strong trending market, the RSI can remain overbought or oversold for a long time—never trade against a strong trend based on RSI alone.
FAQs:
What is RSI "Neutral" territory?
The area between 40 and 60 is generally considered neutral. When the RSI stays in this range, it usually indicates a sideways or ranging market where neither buyers nor sellers have the upper hand.
Can RSI be used for all cryptocurrencies?
Yes, what is RSI remains consistent across Bitcoin, Ethereum, and altcoins. However, low-cap "meme coins" with low liquidity can produce erratic RSI readings that are less reliable.
What is a "Hidden" Divergence?
Unlike regular divergence which signals reversals, hidden divergence signals trend continuation. If price makes a higher low but RSI makes a lower low, it often suggests the original bullish trend is about to resume.
Does RSI work in a bear market?
Absolutely. In a bear market, the RSI rarely goes above 60 and frequently stays below 30. Traders use the RSI to sell "relief rallies" when the indicator hits the 50-60 range.
Why is 14 the default period for RSI?
Wilder originally used 14 because it represented half of a natural lunar cycle (28 days). While markets have changed, 14 remains the most used setting, creating a self-fulfilling prophecy where many traders react to the same levels.