
How Low Bitcoin Will Go in 2026? The Bottomless Pit or a Bear Trap?
2026/03/25 16:24:02
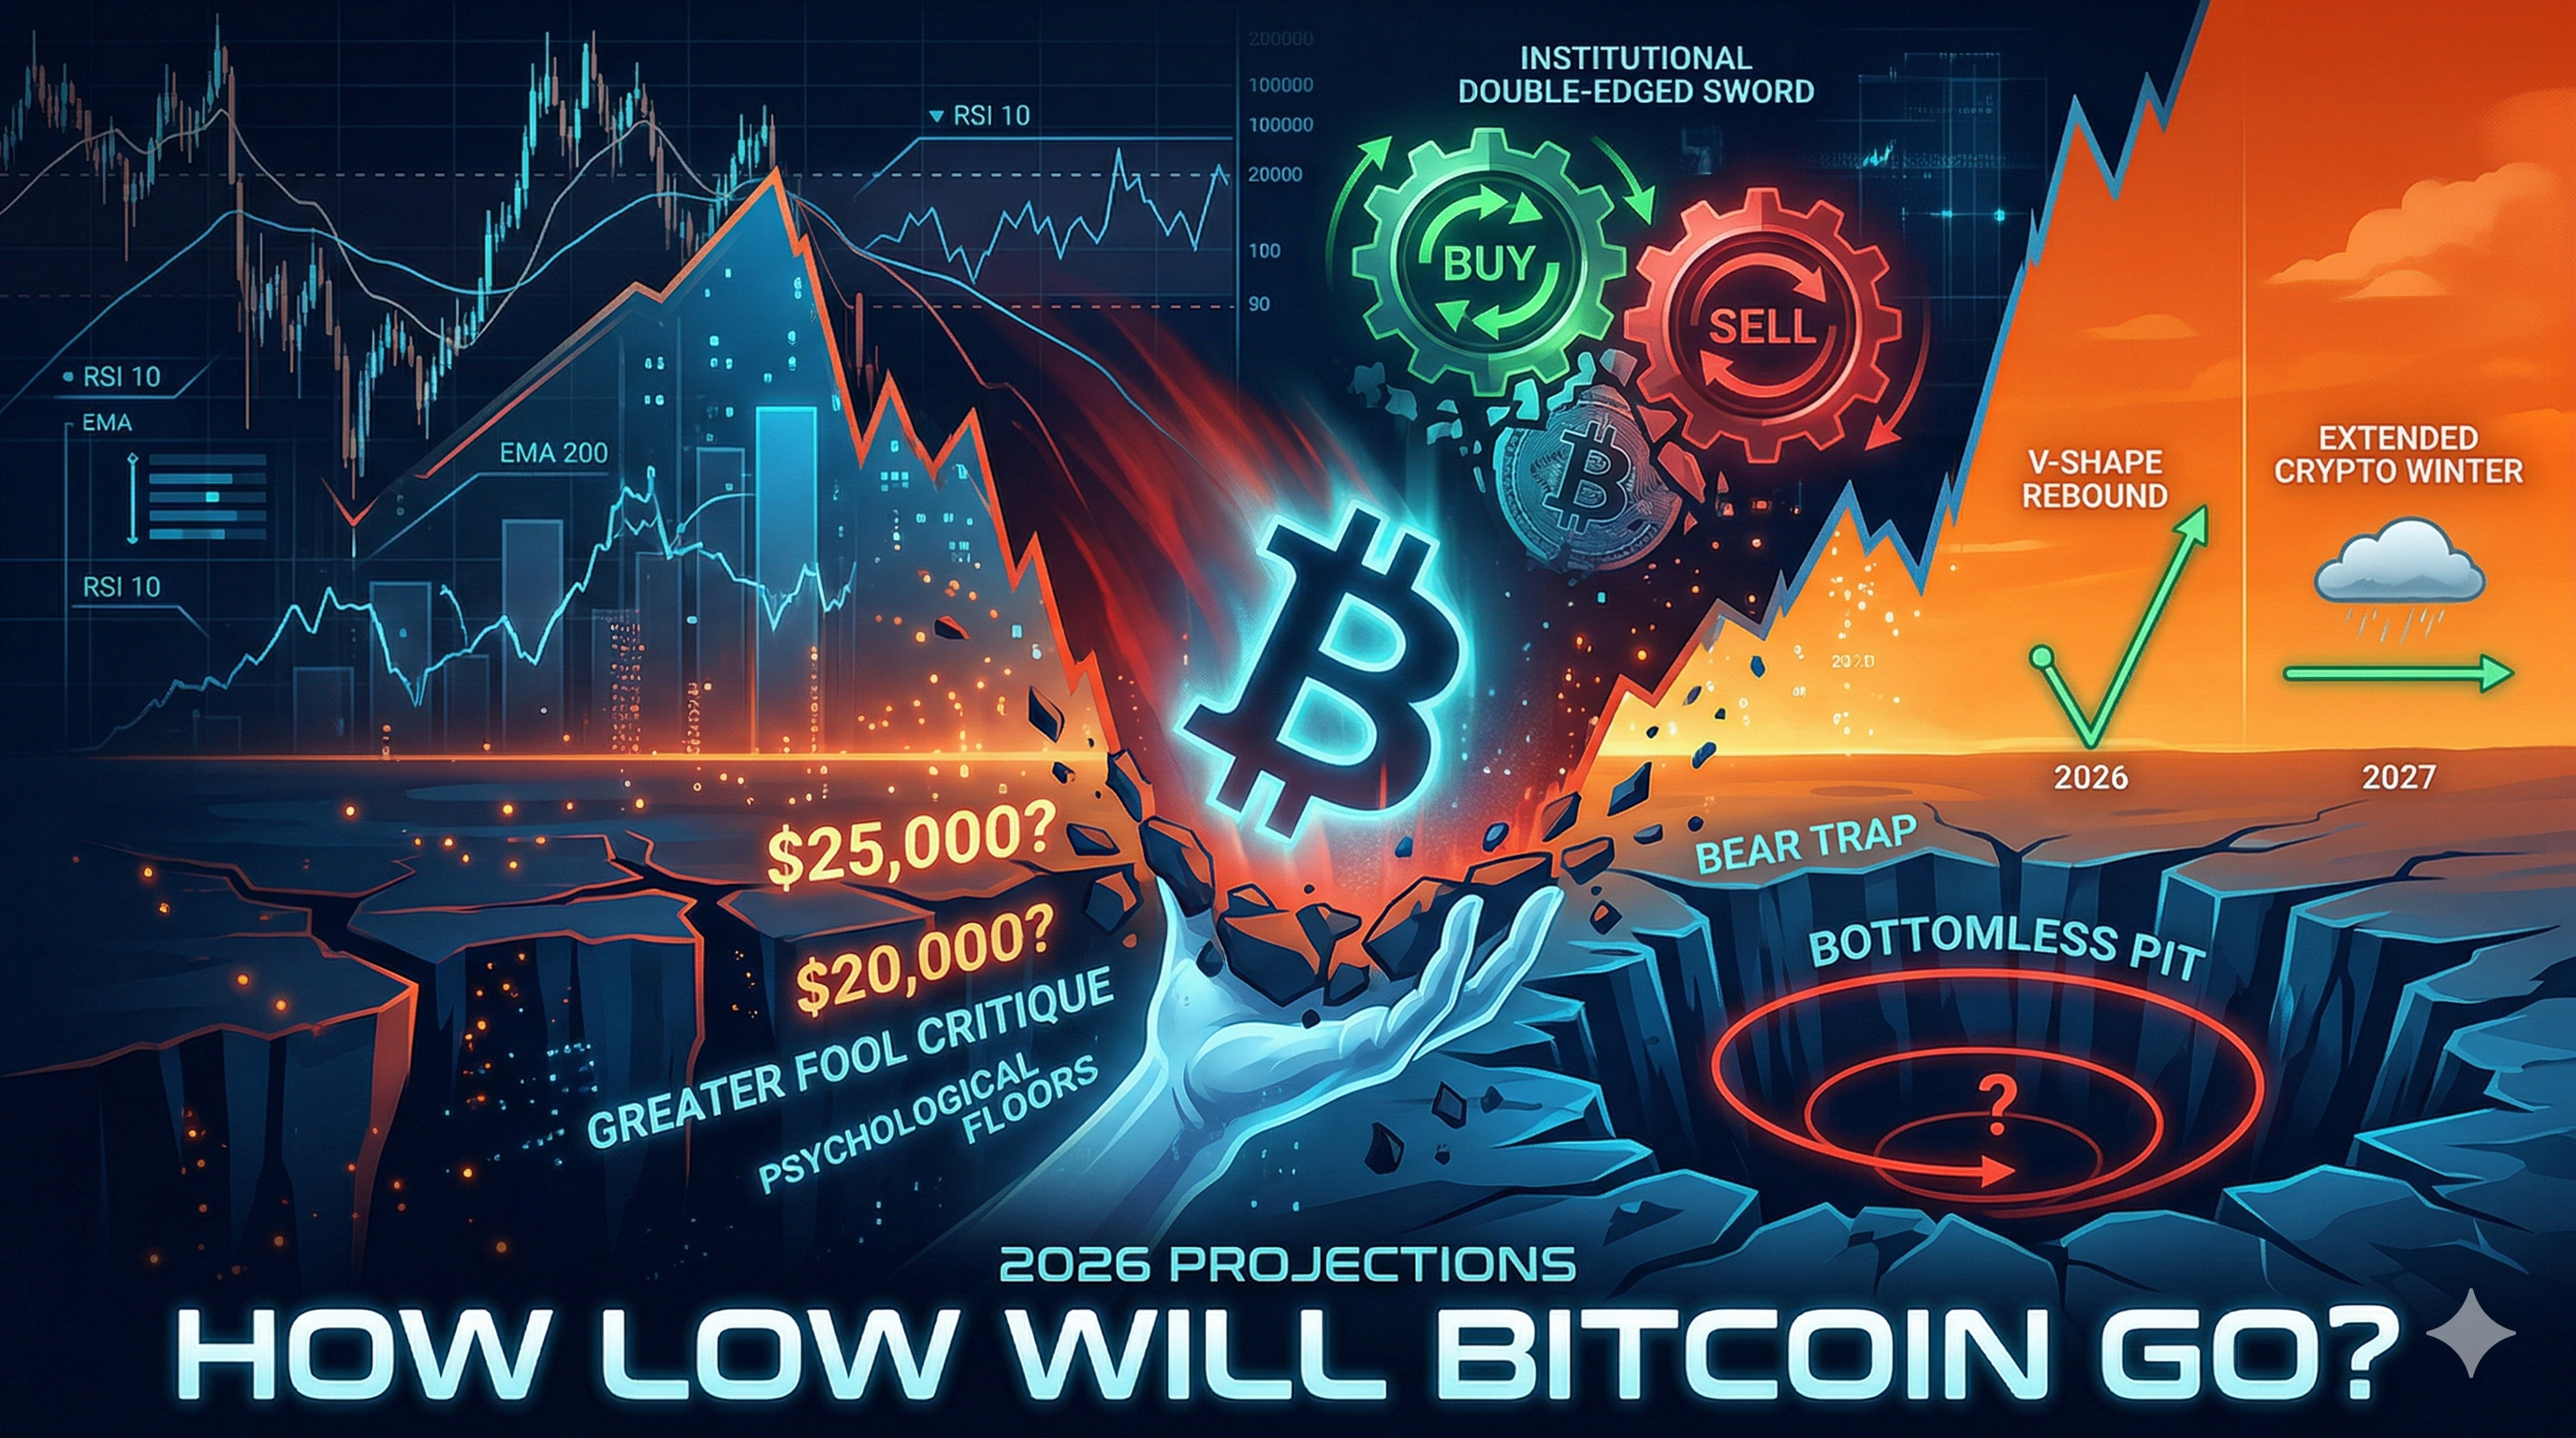
The cryptocurrency market has always been defined by its stomach-churning volatility, but the price action observed throughout late 2025 and the first quarter of 2026 has tested the resolve of even the most seasoned "HODLers." After reaching a breathtaking all-time high of approximately $126,000 in October 2025, Bitcoin has entered a definitive corrective phase. What began as a standard profit-taking retracement has evolved into a complex bearish structure, characterized by lower highs and a series of failed relief rallies. As the digital asset hovers precariously above major psychological benchmarks, the singular question dominating boardroom discussions and social media feeds alike is: How low will Bitcoin go?
To answer this, one must look beyond the simple price tickers. The current market environment is a collision of macroeconomic shifts, evolving regulatory frameworks, and a fundamental transition in the "investor profile" of Bitcoin. Unlike the retail-driven manias of 2017 or 2021, the 2026 landscape is heavily influenced by institutional spot ETFs and the "Clarity Act," which have introduced a new layer of professional scrutiny to the asset class.
This article provides a deep-dive analysis into the technical support levels, fundamental headwinds, and psychological floors that will likely define the ultimate bottom of this cycle.
Key Takeaways
-
Technical Danger Zones: Bitcoin is currently trapped in a bearish "Head and Shoulders" pattern. While $60,000 serves as the immediate psychological floor, a decisive break below this level could trigger a technical cascade toward the $35,000 to $40,000 range.
-
The 200-Day EMA Hurdle: The 200-day Exponential Moving Average, currently situated near $90,000, acts as the definitive line between a "correction" and a "secular bear market." Until Bitcoin reclaims this level, the path of least resistance remains downward.
-
Institutional Inertia: While spot ETFs provided the liquidity for the 2025 rally, institutional "smart money" is currently sidelined. Evidence suggests these large-scale buyers are waiting for a "capitulation event"—a final, sharp drop that flushes out weak hands—before re-entering the market.
-
Macroeconomic Headwinds: Geopolitical instability in the Middle East and a "higher-for-longer" interest rate stance from the Federal Reserve have stripped the market of excess liquidity, making high-risk assets like Bitcoin less attractive compared to traditional yields.
-
The Sentiment Shift: The "Greater Fool Theory," which historically propelled Bitcoin during speculative bubbles, is facing a crisis of faith. Without a fresh narrative or a significant catalyst for utility, Bitcoin is increasingly being traded as a high-beta tech stock rather than an independent "Digital Gold."
Analyzing the Technical Architecture of the 2026 Crash
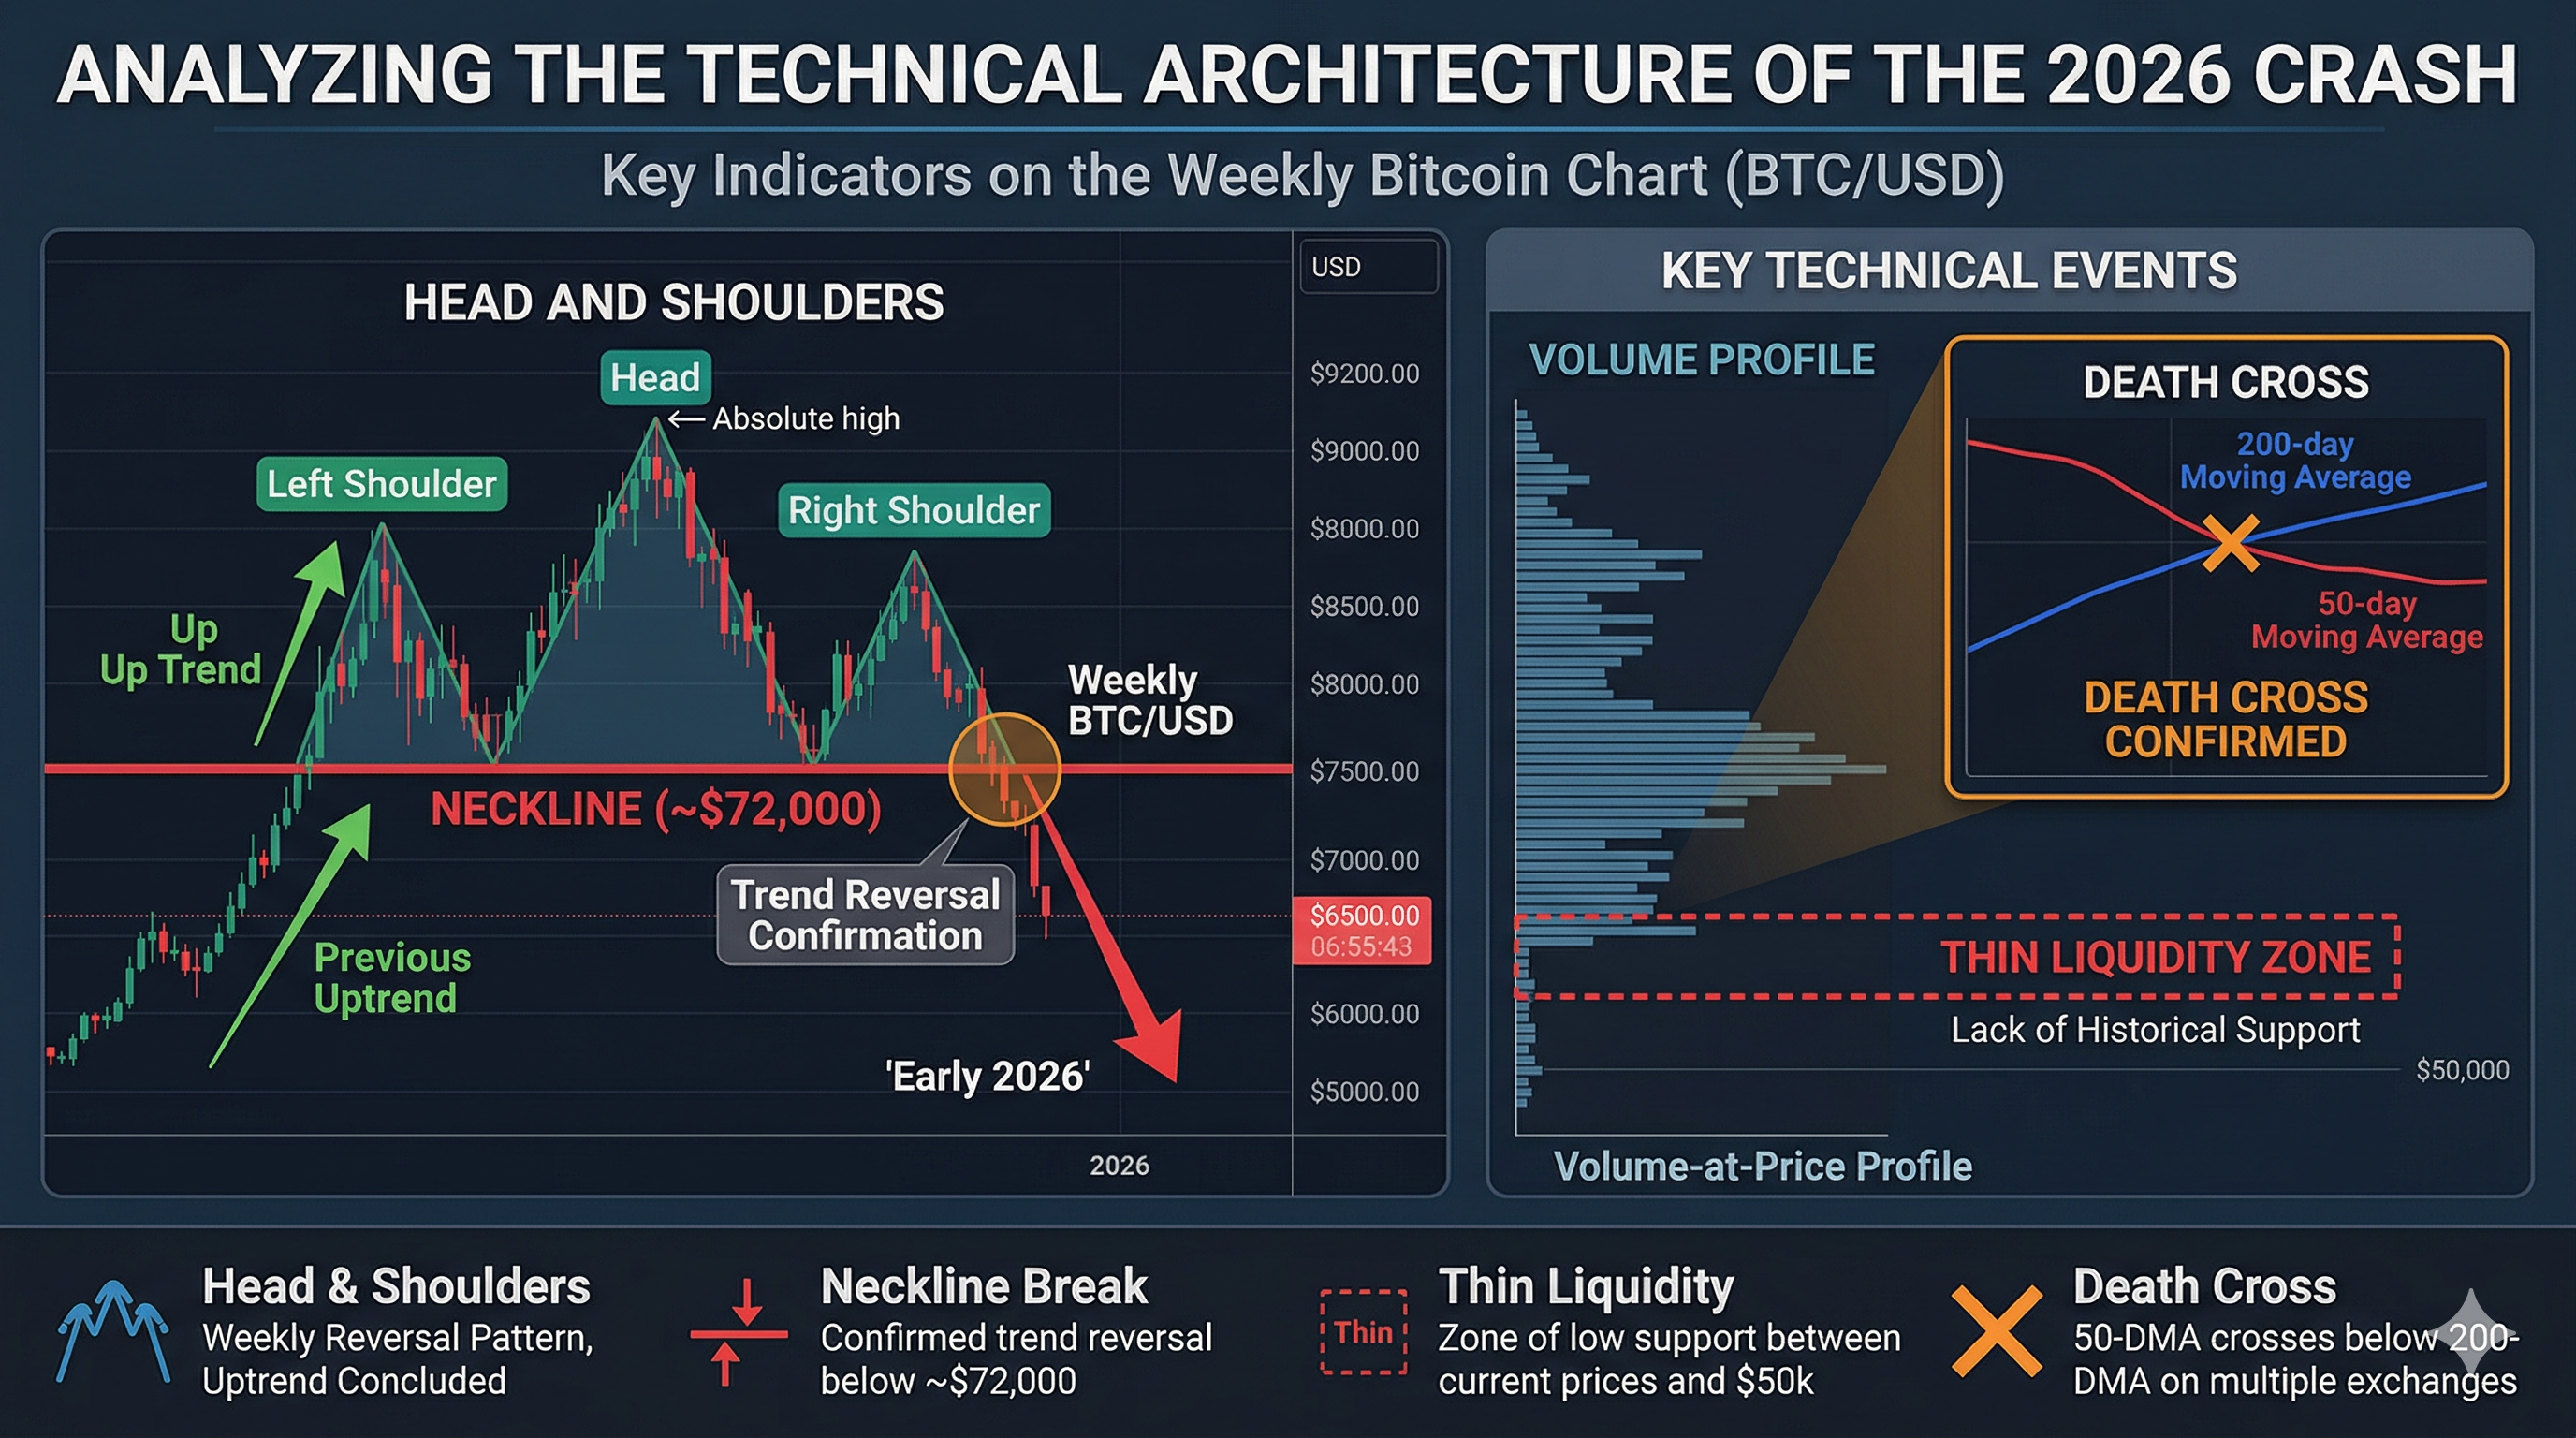
From a technical analysis perspective, Bitcoin’s recent price action is textbook exhaustion. Following the $126,000 peak, the market formed a massive distribution range. Analysts have identified a clear Head and Shoulders pattern on the weekly timeframe—a classic reversal indicator that suggests the previous uptrend has concluded. The "neckline" of this pattern sits roughly at the $72,000 mark. Having broken below this neckline in early 2026, Bitcoin has effectively confirmed a trend reversal.
The immediate concern for traders is the "thin liquidity" zone. Between the current prices and the $50,000 mark, there is a lack of historical "volume profile" support. This means that if selling pressure intensifies, there are very few buy orders sitting on exchange books to slow the descent. If the $60,000 support level—which held during the minor panics of mid-2025—is breached on high volume, the technical projected target sits at the 100% Fibonacci extension, which aligns almost perfectly with the $35,000 to $40,000 accumulation zone seen in late 2023.
Furthermore, the "Death Cross"—where the 50-day moving average crosses below the 200-day moving average—has appeared on several major exchange charts. Historically, this signal hasn't always predicted an immediate crash, but it serves as a lagging indicator that the medium-term momentum has shifted from bullish to bearish. For a recovery to be considered "structural" rather than a "dead cat bounce," Bitcoin would need to consolidate for several weeks and then reclaim the 50-day EMA at $76,000, followed by a high-volume push above the $90,000 resistance.
How the Global Liquidity Drain Pulls BTC Down
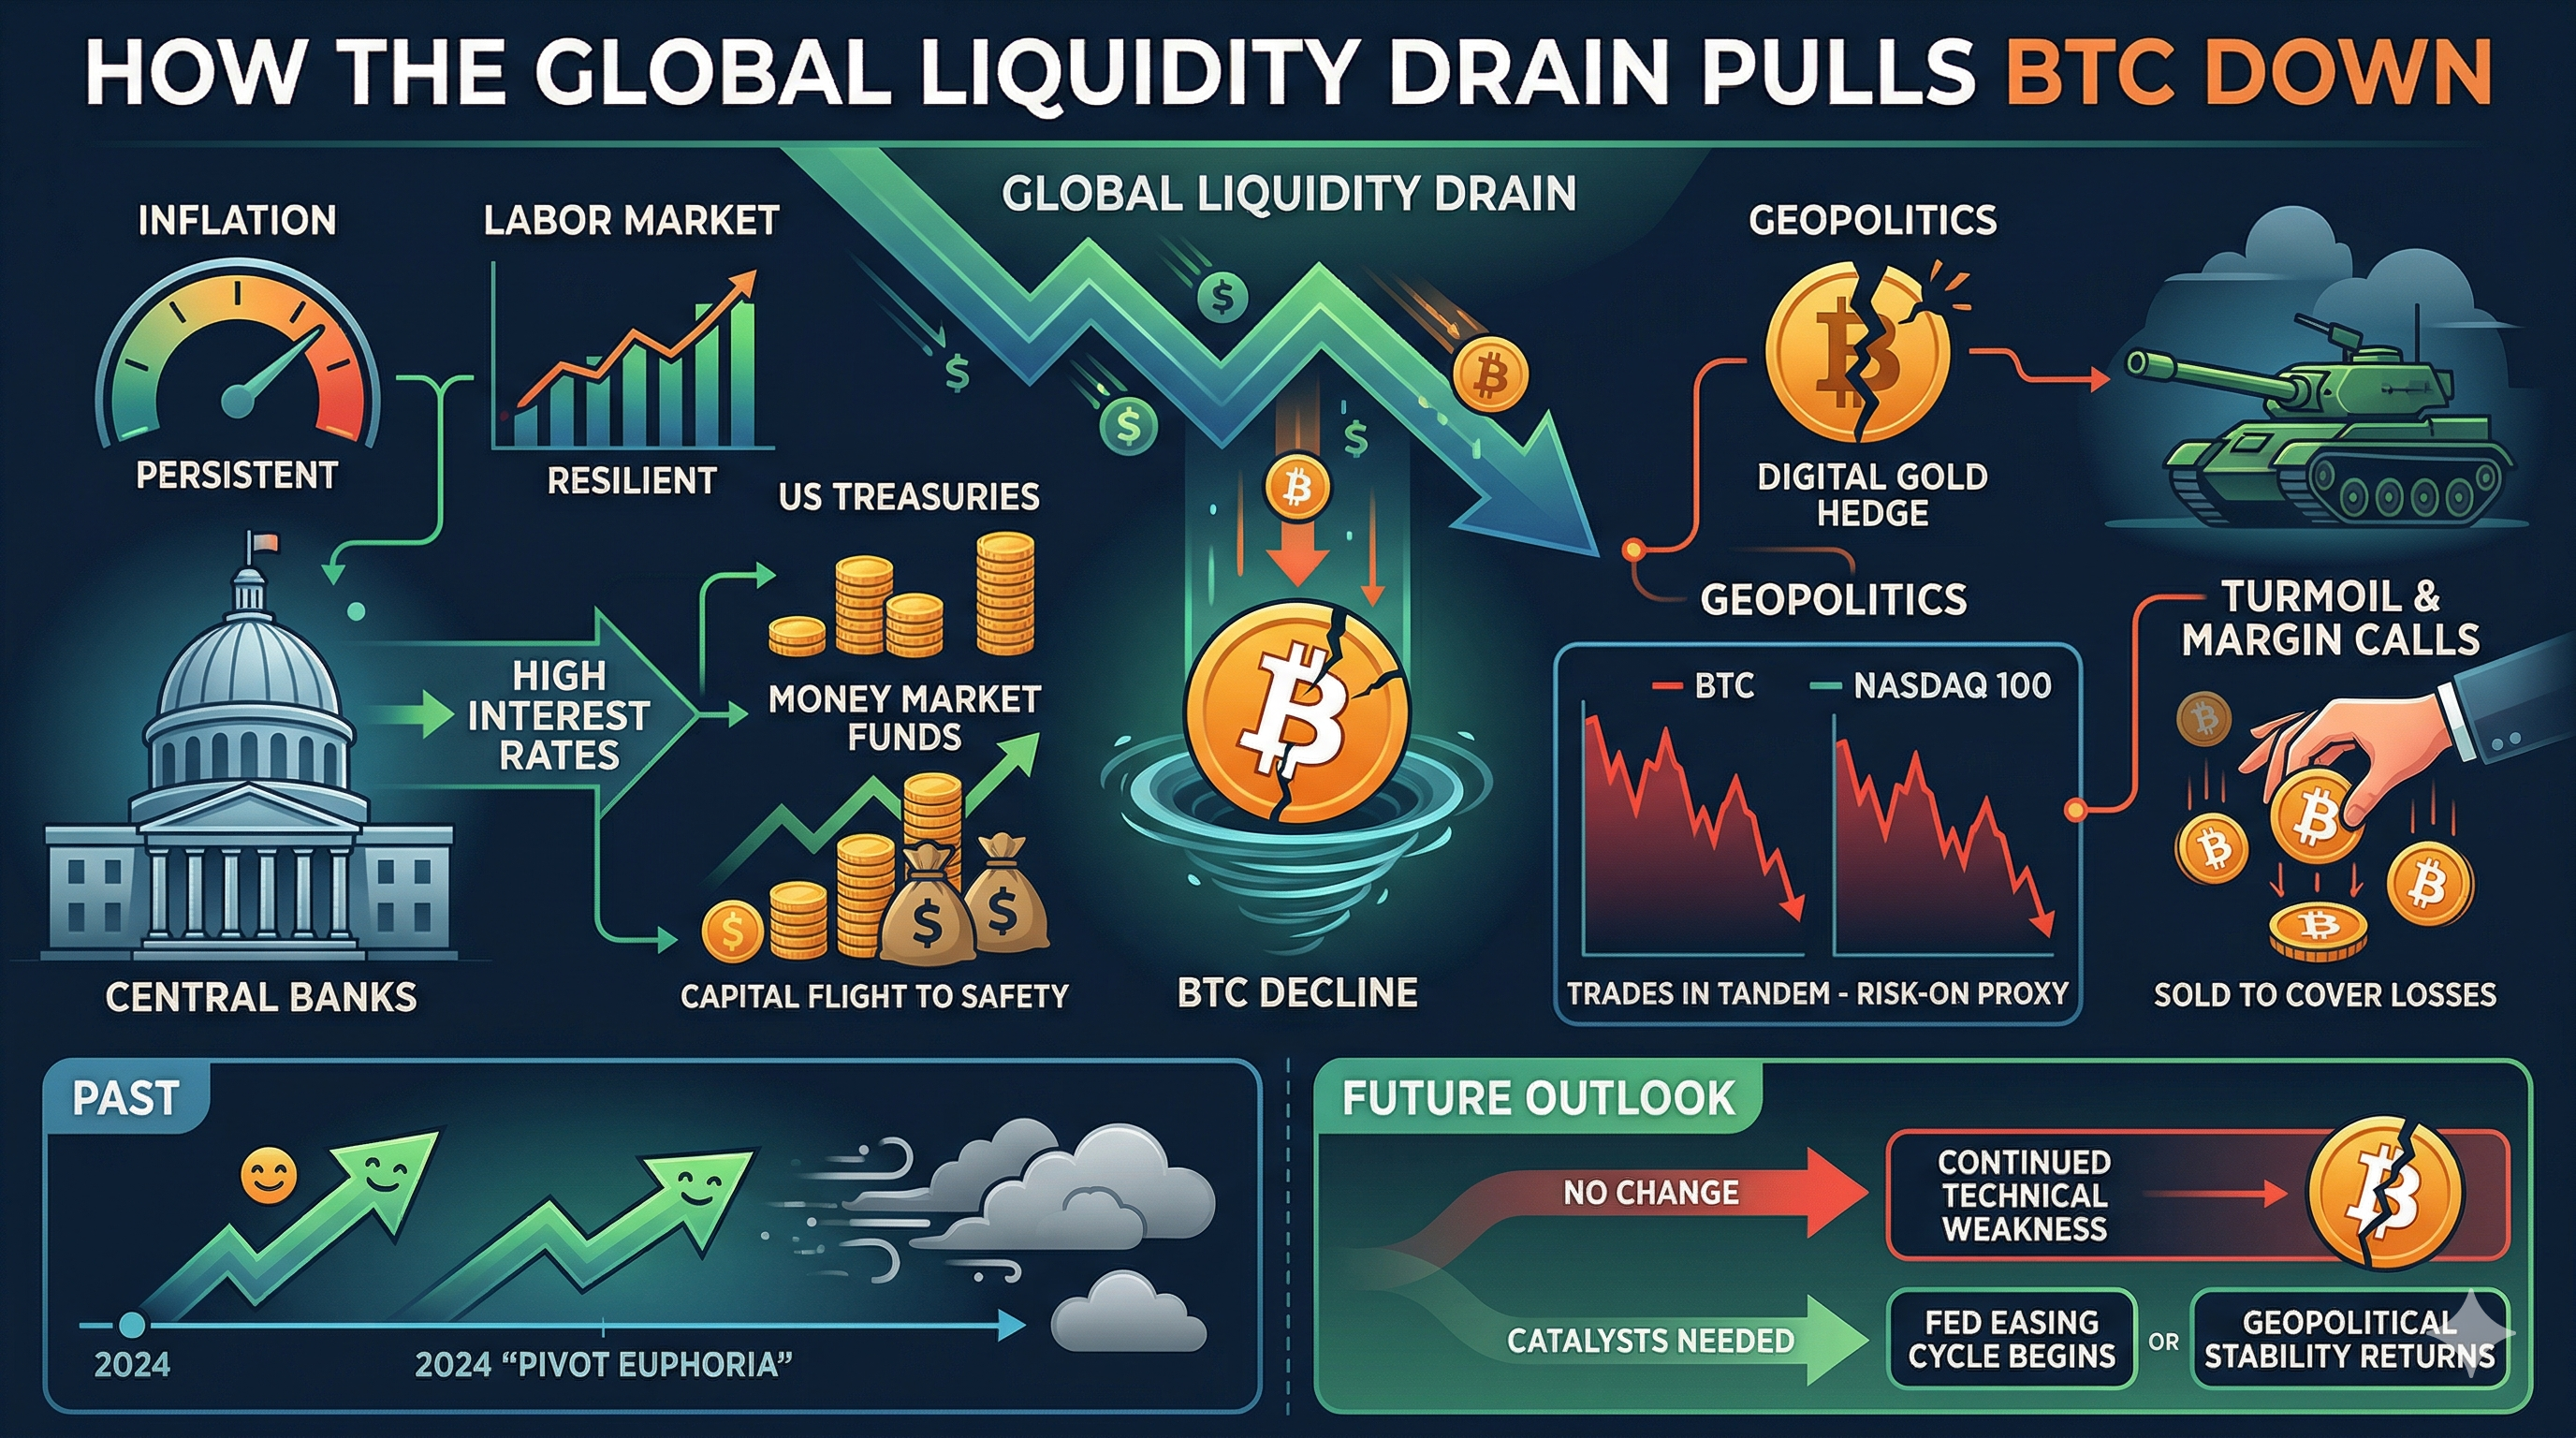
Bitcoin does not exist in a vacuum. Its price is a function of global dollar liquidity. Throughout 2024 and early 2025, the market benefited from an anticipation of "Pivot Euphoria"—the belief that the Federal Reserve would aggressively cut interest rates. However, the 2026 reality has been far grimmer. Persistent inflation and a resilient labor market have forced central banks to maintain restrictive monetary policies. When the "cost of money" is high, speculative assets are the first to be liquidated as investors move toward the safety of 5-year Treasuries or high-yield money market funds.
Geopolitics has further complicated the "Digital Gold" narrative. In previous years, proponents argued that Bitcoin would serve as a hedge against global instability. Yet, during the recent escalations in the Middle East and Eastern Europe, Bitcoin has largely traded in tandem with the Nasdaq 100. Instead of being a safe haven, it has behaved like a "risk-on" liquidity proxy. When global tensions rise, investors sell their most volatile assets to cover margins in traditional markets. This "correlation convergence" means that until the geopolitical climate stabilizes or the Fed begins a meaningful easing cycle, Bitcoin lacks the external "push" required to overcome its internal technical weakness.
The Institutional Double-Edged Sword for Crypto
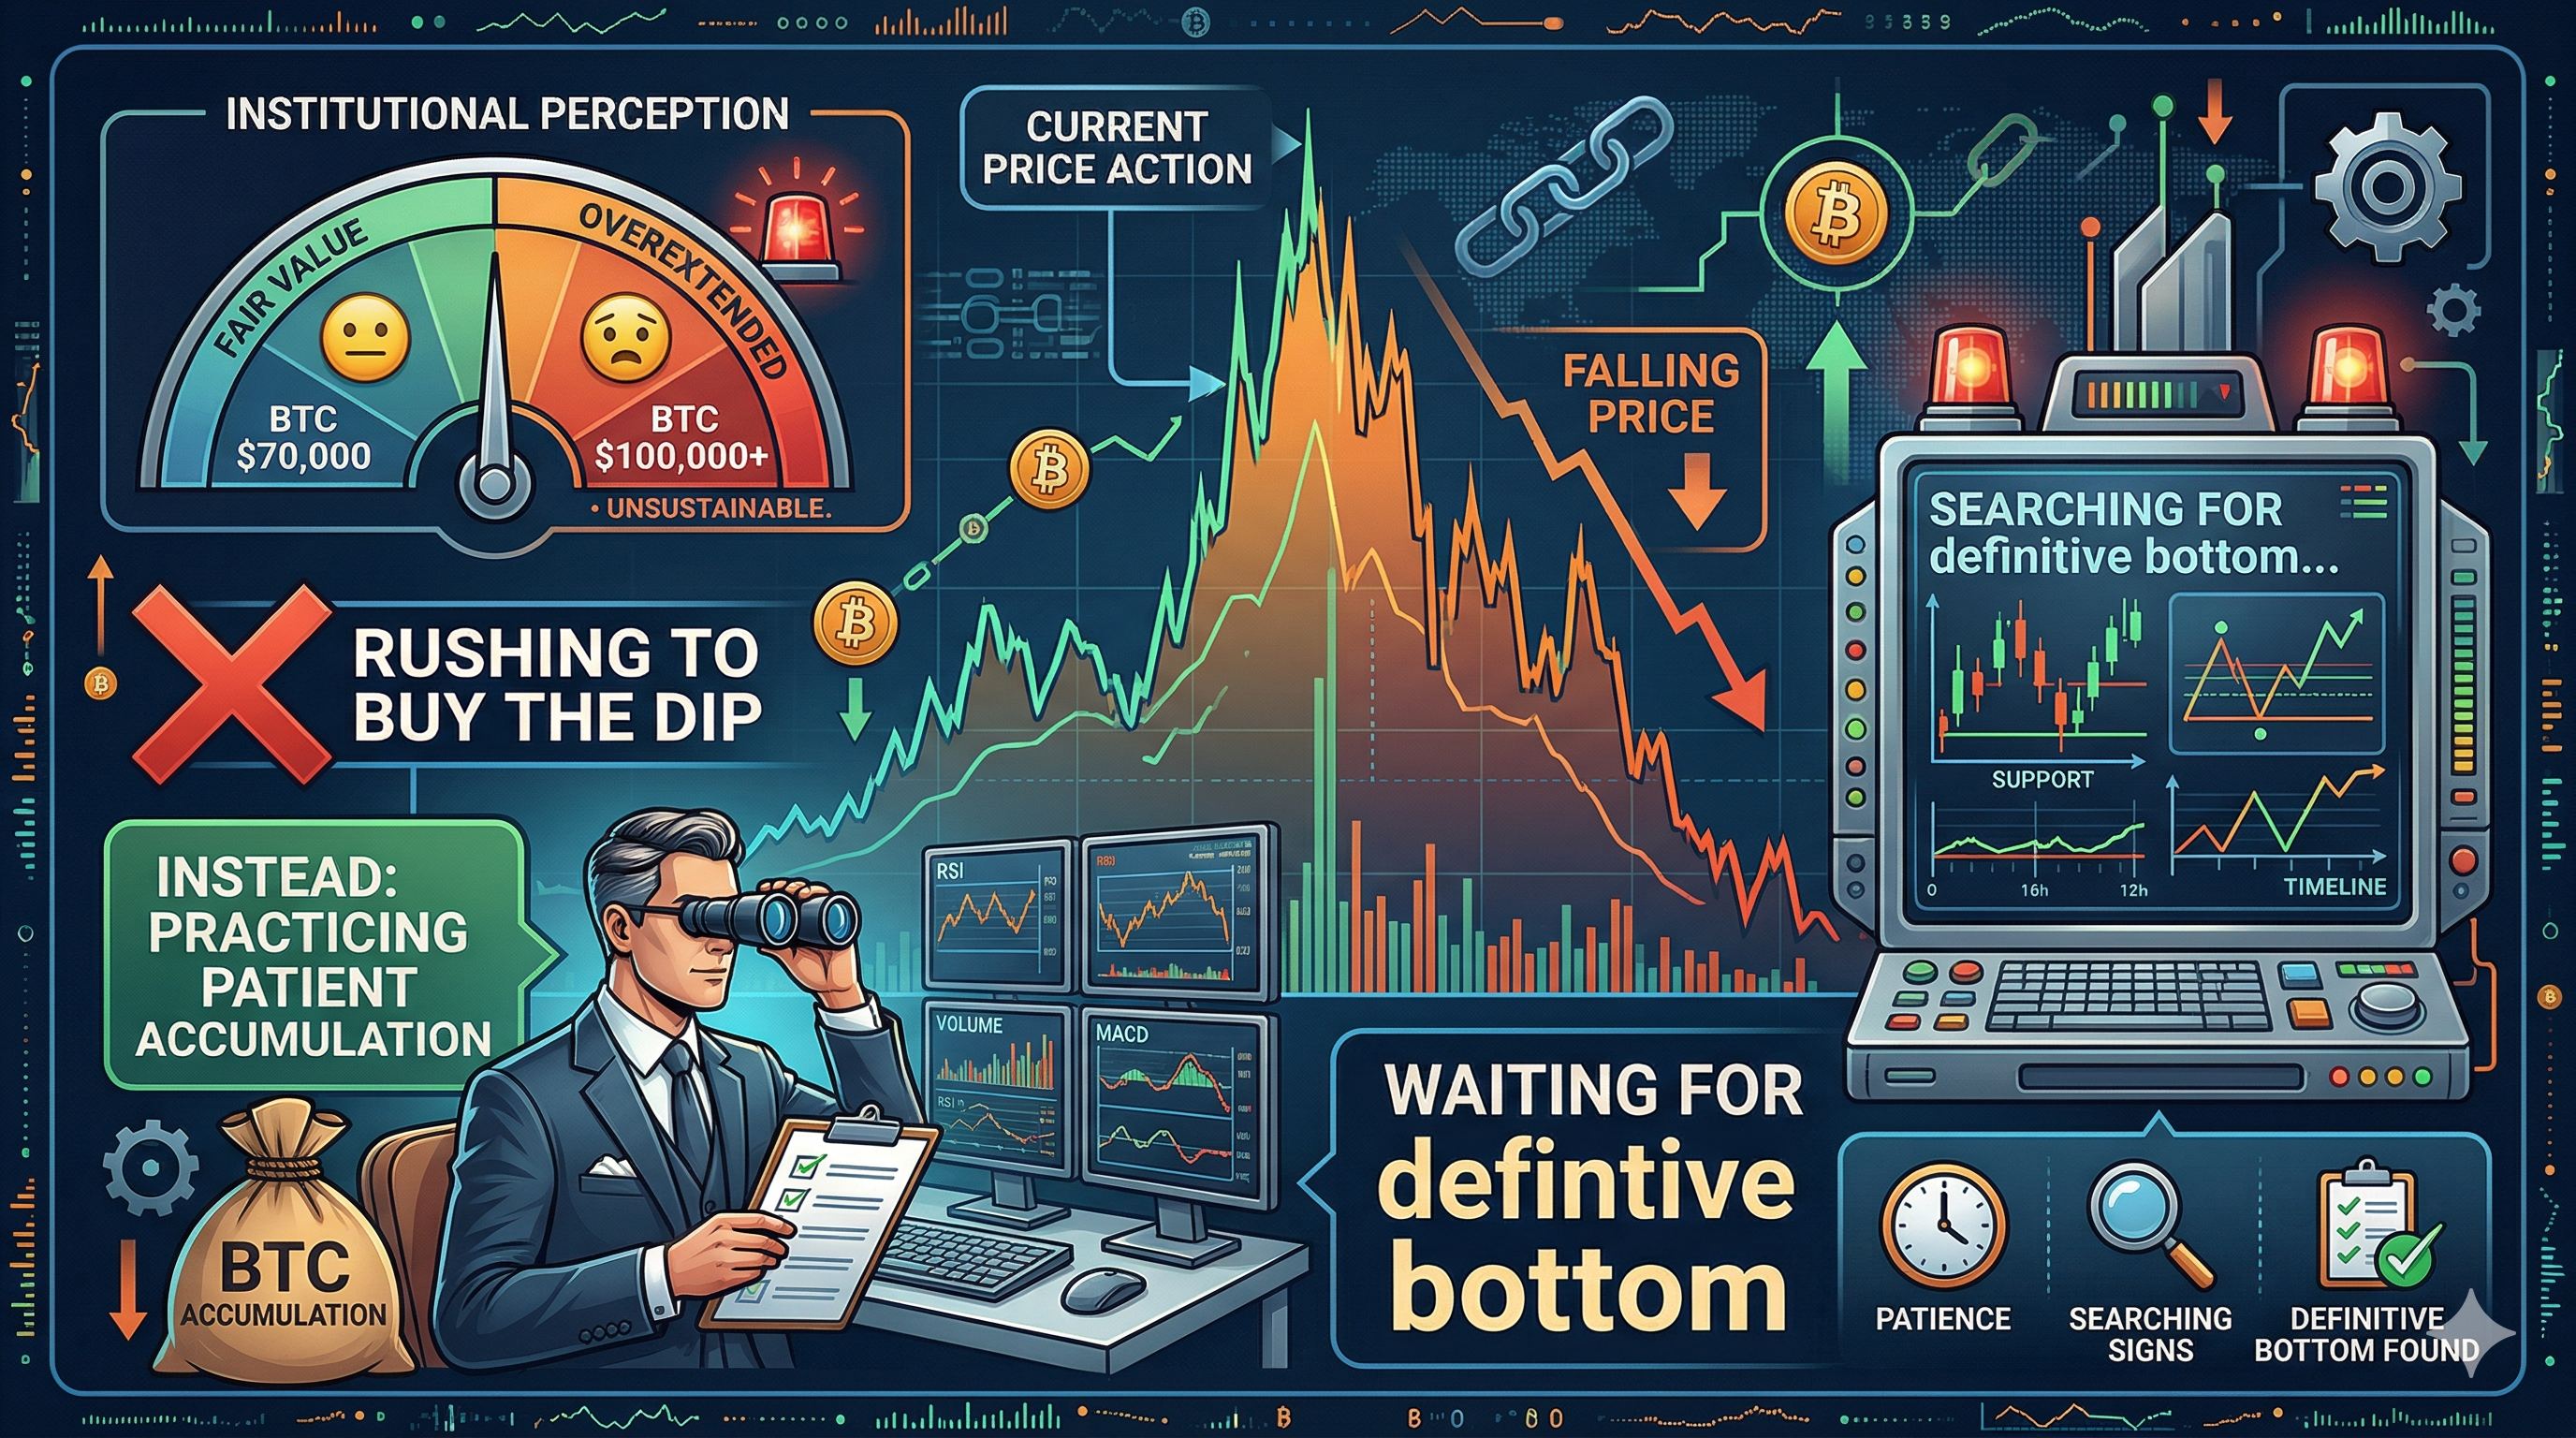
The entry of Wall Street via spot ETFs was hailed as the "final maturation" of Bitcoin. While this did lead to the 2025 price explosion, it has also changed the mechanics of how Bitcoin crashes. In the past, Bitcoin crashes were often characterized by "cascading liquidations" of over-leveraged retail traders on offshore exchanges. Today, the price is increasingly dictated by the "inflow and outflow" data of major fund managers like BlackRock and Fidelity.
Currently, we are witnessing an "Institutional Buyer's Strike." Professional fund managers are not prone to "FOMO" (Fear Of Missing Out) in the same way retail investors are. They operate on value-based models and risk-adjusted returns. For many institutional desks, Bitcoin at $70,000 was "fair value," but at $100,000+ it was "overextended." Now that the price is falling, these players are not rushing to "buy the dip." Instead, they are practicing "patient accumulation," waiting for signs of a definitive bottom. The "Clarity Act" has also introduced stricter reporting requirements for crypto holdings, making institutions more cautious about holding assets that are in a clear downward trend. This lack of institutional "buy-side" support creates a vacuum, allowing even small sell orders to have a disproportionate impact on the price.
Psychological Floors and the "Greater Fool" Critique
One of the most sobering perspectives on the current crash comes from the fundamental skeptics, such as Bill Blain of the "Morning Porridge." The argument is that Bitcoin's value is derived entirely from the "Greater Fool Theory"—the idea that you can buy an asset today because there will always be someone else willing to buy it from you at a higher price tomorrow. When the supply of "greater fools" runs out, the price must inevitably collapse to its true utility value.
Critics argue that after fifteen years, Bitcoin has failed to transition into a widely used medium of exchange or a reliable store of value that is independent of market cycles. In 2026, the "narrative fatigue" is palpable. The excitement of the "Halving" has passed, the ETFs are already launched, and the "Nation State Adoption" story has stalled. Without a new, compelling reason for the masses to buy Bitcoin, the psychological floor becomes much lower than the technical floor. If the market begins to believe that Bitcoin has "peaked" as a cultural phenomenon, the descent could go far beyond $30,000, potentially revisiting the $15,000 to $20,000 levels seen during the 2022 FTX collapse.
However, the "counter-critique" is that Bitcoin has survived numerous "deaths" before. Each time the "Greater Fool" theory is cited, the market eventually finds a new base of believers. The psychological floor in 2026 is likely tied to the "Production Cost" of Bitcoin. With mining difficulty at all-time highs and energy costs rising, the average cost to mine a single Bitcoin is estimated to be between $40,000 and $55,000. Historically, Bitcoin rarely stays below the cost of production for long, as miners shut down their rigs, reducing sell pressure and creating a natural "floor" for the market.
Recovery Scenarios: V-Shape or Crypto Winter?
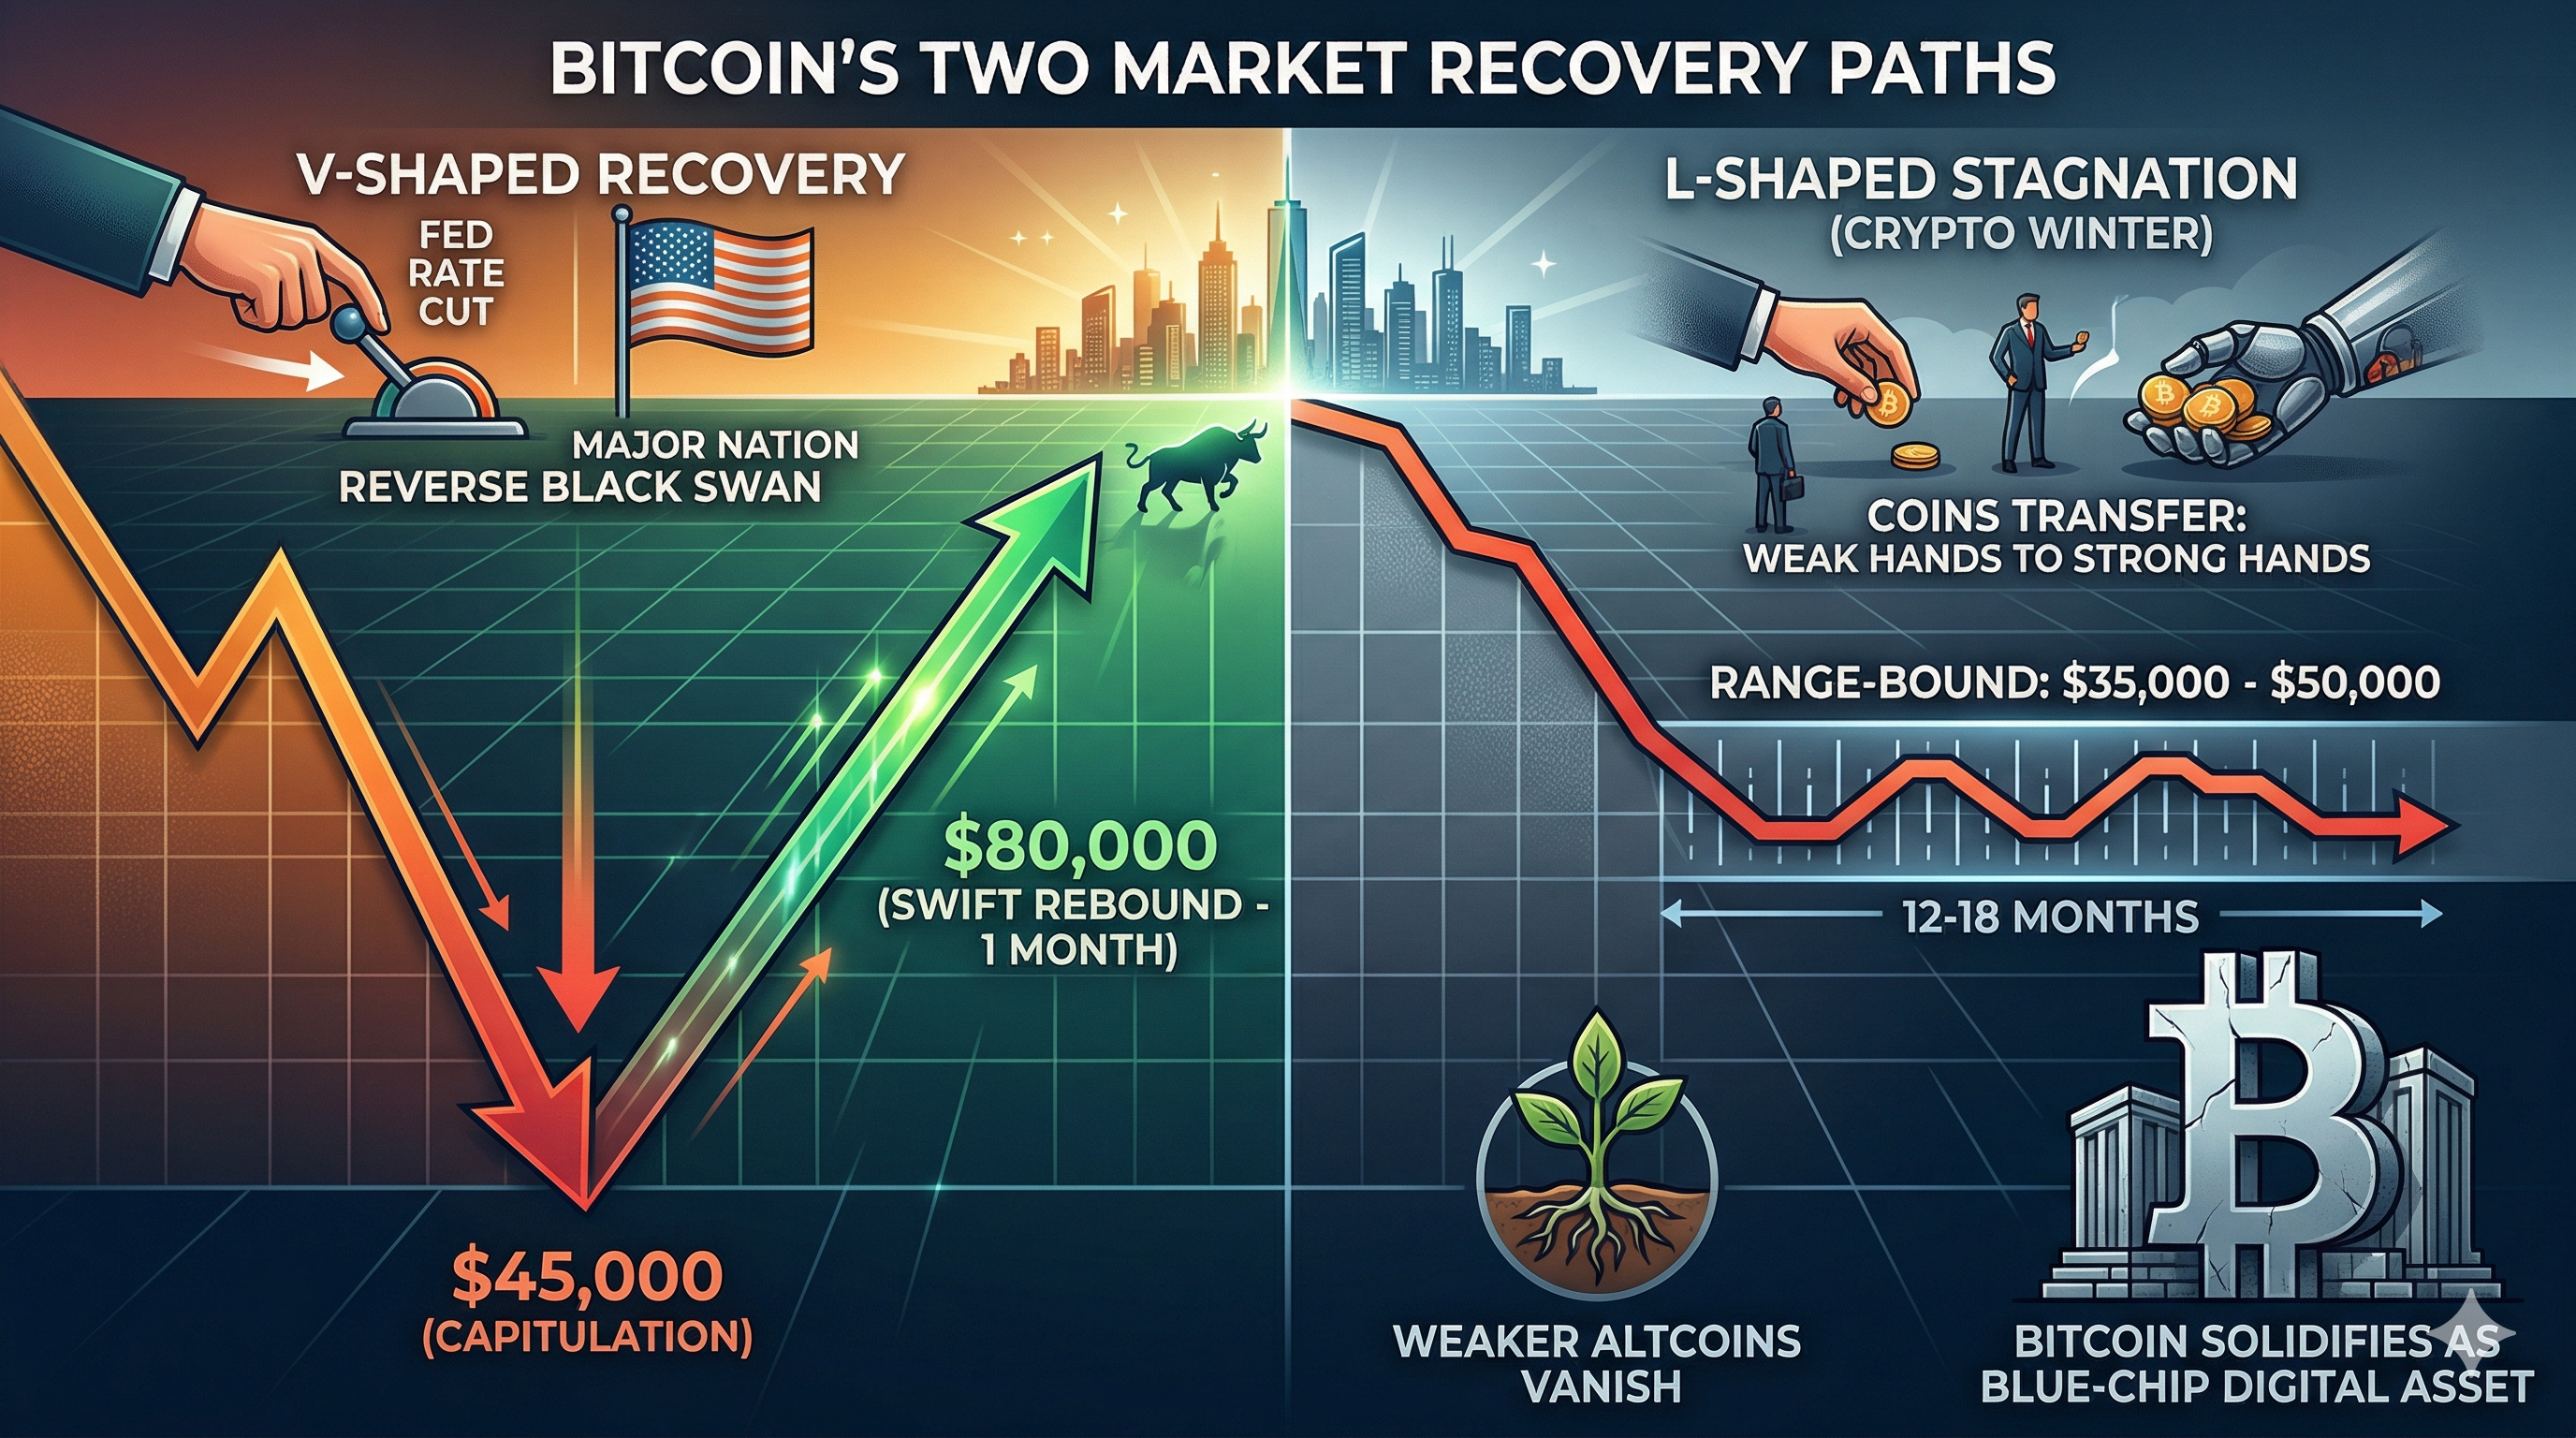
Scenario 1: The V-Shaped Recovery (Sharp & Short-Lived)
Catalyst: A "reverse black swan"—e.g., the Fed suddenly slashing interest rates or a major nation adopting Bitcoin as a reserve asset.
Path: Bitcoin capitulates sharply to $45,000, then rebounds to $80,000 within a month.
Outlook: Quick, dramatic recovery driven by external intervention.
Scenario 2: The L-Shaped Stagnation (Crypto Winter)
Path: Bitcoin bottoms between $35,000–$50,000 and remains range-bound for 12–18 months.
Process: This "boring" phase transfers coins from weak hands (speculators) to strong hands (long-term believers).
Outlook: Industry consolidation follows—weaker altcoins disappear while Bitcoin solidifies as the only blue-chip digital asset.
Key Insight: Generational wealth is often built during this phase, though it requires patience most market participants lack.
Strategic Outlook for Investors
For those looking to navigate these turbulent waters, the consensus among risk managers is "preservation of capital." The era of "blindly buying every dip" may be over. A more sophisticated approach involves watching for "exhaustion signals"—such as a massive spike in trading volume accompanied by a sharp price drop (the "wick" of a candle), which often signals that the final sellers have left the market.
It is also vital to differentiate between Bitcoin and the broader "Altcoin" market. Historically, when Bitcoin drops by 30%, Altcoins often drop by 60% or more. In 2026, we are seeing a "flight to quality" within the crypto space. Even as Bitcoin's price falls, its "Dominance" (its percentage of the total crypto market cap) has been rising. This suggests that even crypto-believers are exiting their riskier positions in favor of Bitcoin, reinforcing the idea that if any digital asset is to survive this correction, it is the original cryptocurrency.
Conclusion
The question "how low will Bitcoin go?" is not just about a number on a screen; it is about the market's ongoing search for "True Value" in a post-ETF world. While the technical indicators point toward a potential "washout" in the $35,000 to $50,000 range, the fundamental resilience of the network remains intact. The current crash is a painful but necessary "cleansing" of the speculative excesses that built up during the 2025 rally.
Investors should remain vigilant, focusing on the $60,000 support level as the critical pivot point. A failure to hold this level will likely lead to a darker period for the asset class, but it will also provide the entry point that institutional giants have been waiting for. Whether Bitcoin is a "failed experiment" or "Digital Gold" is a debate that will continue, but for the pragmatic trader, the goal is not to win the argument—it is to survive the volatility and be positioned for the eventual return of the bulls.
FAQs
Is Bitcoin going to zero?
While critics often suggest this, the structural integration of Bitcoin into the global financial system—through ETFs and regulated custodians—makes a "zero" scenario highly unlikely. The network has a "production cost" floor and a dedicated global user base that provides a baseline of demand.
What is the "Death Cross" and why does it matter?
A Death Cross occurs when a short-term moving average (like the 50-day) crosses below a long-term moving average (like the 200-day). It is a signal that momentum has shifted to the downside. While not a perfect crystal ball, it often precedes periods of extended bearishness or consolidation.
Why aren't the Bitcoin ETFs stopping the price drop?
ETFs are simply a "wrapper" for the asset. They make it easier to buy and sell, but they do not change the underlying market sentiment. In fact, ETFs can accelerate a crash because they allow institutional investors to exit their positions with high liquidity, sometimes creating "cascading" sell orders.
Should I sell my Bitcoin now?
Investment decisions depend on individual risk tolerance and time horizons. Many long-term investors view these corrections as "accumulation phases," while short-term traders may use "stop-loss" orders to protect their capital from a potential drop to the $35,000 level.
What will trigger the next bull market?
Historically, bull markets are triggered by a combination of "The Halving" (which occurred in 2024), a return to "Cheap Money" (lower interest rates), and a new technological or adoption narrative. The next major catalyst may be the widespread integration of Bitcoin into corporate balance sheets or a significant shift in US monetary policy.