
A Complete Guide to the ABCD Pattern: Mastering the Most Reliable Crypto Trading Signal
2026/03/11 12:18:02
Key Takeaways
-
The ABCD pattern is a foundational chart structure consisting of three price swings and four specific points.
-
In a bullish scenario, it represents a "measured move" where the initial rally (AB) is mirrored by a second rally (CD) after a healthy correction (BC).
-
Timing the ABCD pattern entry correctly involves monitoring volume and Fibonacci retracement levels (specifically the 0.618 level).
-
Risk management is vital; always set stop-losses below point C in a bullish ABCD pattern.
As a crypto exchange, we know that navigating the volatile digital asset markets requires more than just luck—it requires a proven system. Whether you are trading Bitcoin, Ethereum, or the latest altcoin, the ABCD pattern remains one of the most consistent harmonic patterns used by professional traders to identify trend continuations and market reversals.
In this guide, we will break down why the ABCD pattern is a must-have tool in your trading arsenal and how you can use it to improve your hit rate on our platform.
What is the ABCD Pattern in Crypto Trading?
In the fast-paced world of crypto, the ABCD pattern acts as a map. It is a rhythmic geometric pattern that describes the natural ebb and flow of market sentiment. Unlike complex indicators that lag behind the price, this pattern is leading—it helps you predict where the price is going before it gets there.
The beauty of the ABCD pattern lies in its simplicity. It works on the principle that market moves are often symmetrical. If a "whale" pushes a price up from $40,000 to $50,000, and the market takes a breather, the next leg up often mimics that original $10,000 move.
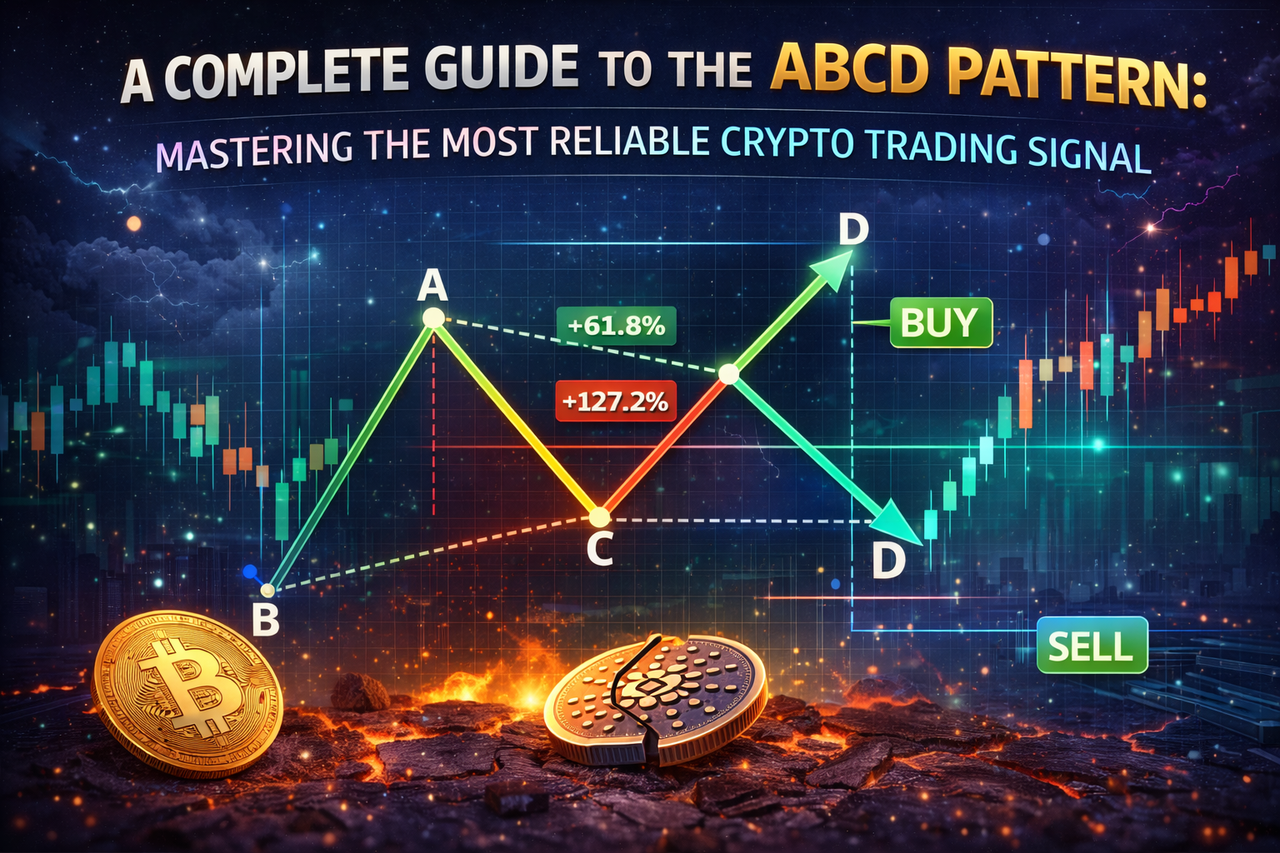
Anatomy of the Bullish ABCD Pattern
To trade the ABCD pattern effectively on our exchange, you must first learn to identify its four distinct points:
-
A to B (The Impulse Leg): This is the initial strong move upward. In crypto, this is usually accompanied by high buying volume as a project gains momentum.
-
B to C (The Retrace): After hitting a local high at B, some traders take profits. This causes a dip. For a valid ABCD pattern, point C must be higher than point A.
-
C to D (The Continuation): This is where the magic happens. The price resumes its upward trajectory, eventually breaking past point B to reach a new high at point D.
Calculating the ABCD Pattern Price Targets
Traders often use the formula $$AB = C$$ to predict the exit. If the distance from A to B is $1,000, then the expected move from C to D should also be roughly $1,000.
How to Trade the ABCD Pattern on a Crypto Exchange
Identifying the pattern is step one; executing the trade is where the profit is made. When trading the ABCD pattern on our platform, you should look for "confluence"—where the pattern aligns with other technical indicators.
Entry Strategies for the ABCD Pattern
There are two primary ways to enter a trade using the ABCD pattern:
-
The Aggressive Entry: Buying at point C. Traders use Fibonacci tools to see if the price bounces at the 61.8% or 78.6% retracement level. If point C holds, you catch the entire CD leg.
-
The Conservative Entry: Buying the breakout at point B. This confirms the ABCD pattern is fully in play, reducing the risk of a "failed" C-point.
Volume Confirmation in the ABCD Pattern
Volume is the "truth serum" of crypto trading. When the ABCD pattern is forming:
-
Volume should be high on the AB leg.
-
Volume should decrease during the BC correction (indicating sellers are exhausted).
-
Volume should spike again as the price breaks B toward the D target.
Risk Management and the ABCD Pattern
Even the most perfect ABCD pattern can fail if the overall market crashes (e.g., a sudden Bitcoin drop). Protecting your capital is our priority.
Setting Stop-Losses for the ABCD Pattern
The most logical place for a stop-loss is just below Point C. If the price drops below C, the "higher low" structure is broken, and the ABCD pattern is invalidated. In crypto, where "wicking" is common, give your stop-loss a little room to breathe to avoid being hunted by volatility.
Common Pitfalls of the ABCD Pattern
-
Chasing the D Point: Entering too late (near D) often results in buying the top right before a larger correction.
-
Ignoring the Macro Trend: An ABCD pattern on a 5-minute chart might fail if the 4-hour chart is in a massive downtrend.
Summary: Integrating the ABCD Pattern into Your Strategy
The ABCD pattern is a timeless strategy because it relies on human psychology and market mechanics. By recognizing the AB=CD symmetry, crypto traders can move away from "revolving door" gambling and toward a structured, data-driven approach.
Remember, the ABCD pattern works best when combined with solid support/resistance levels and healthy trading volume. Start practicing on our live charts today and see how symmetry can transform your PnL.
Frequently Asked Questions (FAQs)
Does the ABCD pattern work for crypto shorting?
Yes! The bearish ABCD pattern is the inverted version of the bullish one. It starts with a sharp drop (AB), a small relief rally (BC), and a final plunge (CD). It is a great way to time entries for short positions during a bear market.
What is the best time frame for the ABCD pattern?
The ABCD pattern is "fractal," meaning it appears on all time frames. Day traders use it on the 5-minute or 15-minute charts, while swing traders look for it on the Daily or Weekly charts for more significant moves.
Is the ABCD pattern the same as a 1-2-3 reversal?
Not exactly. While both involve three legs, the ABCD pattern specifically looks for symmetry in price and time ($AB=CD$), whereas a 1-2-3 reversal is focused primarily on the change of trend direction.
How accurate is the ABCD pattern in volatile markets?
While no indicator is 100% accurate, the ABCD pattern is highly regarded because it requires a "higher low" (Point C) to be valid. This built-in requirement filters out many weak trades that would otherwise fail.
Can I use Fibonacci with the ABCD pattern?
Absolutely. In fact, most pro traders consider the ABCD pattern a type of "Harmonic Pattern." Point C usually retraces to the 0.618 or 0.786 Fibonacci level of the AB leg, and Point D is often the 1.27 or 1.618 extension.