

Trading 101: Exploring the Popular Head and Shoulders Crypto Pattern in 2026
Introduction
Technical analysis remains one of the most widely used methods for identifying market trends in cryptocurrency trading, and the Head and Shoulders pattern continues to be one of the most reliable bearish reversal indicators. Frequently seen across major crypto assets such as Bitcoin and Ethereum, this classic chart pattern helps traders detect weakening bullish momentum before a potential market downturn occurs.
In highly volatile crypto markets, recognizing reversal structures early can help traders improve entry timing, manage risks more effectively, and avoid getting trapped in late-stage rallies. In this guide, we’ll explain how the Head and Shoulders crypto pattern works, how to identify it correctly, and how traders can use it alongside volume analysis, trend confirmation indicators, and risk management strategies in 2026’s fast-moving digital asset market.
How is the Head and Shoulders Pattern Formed?
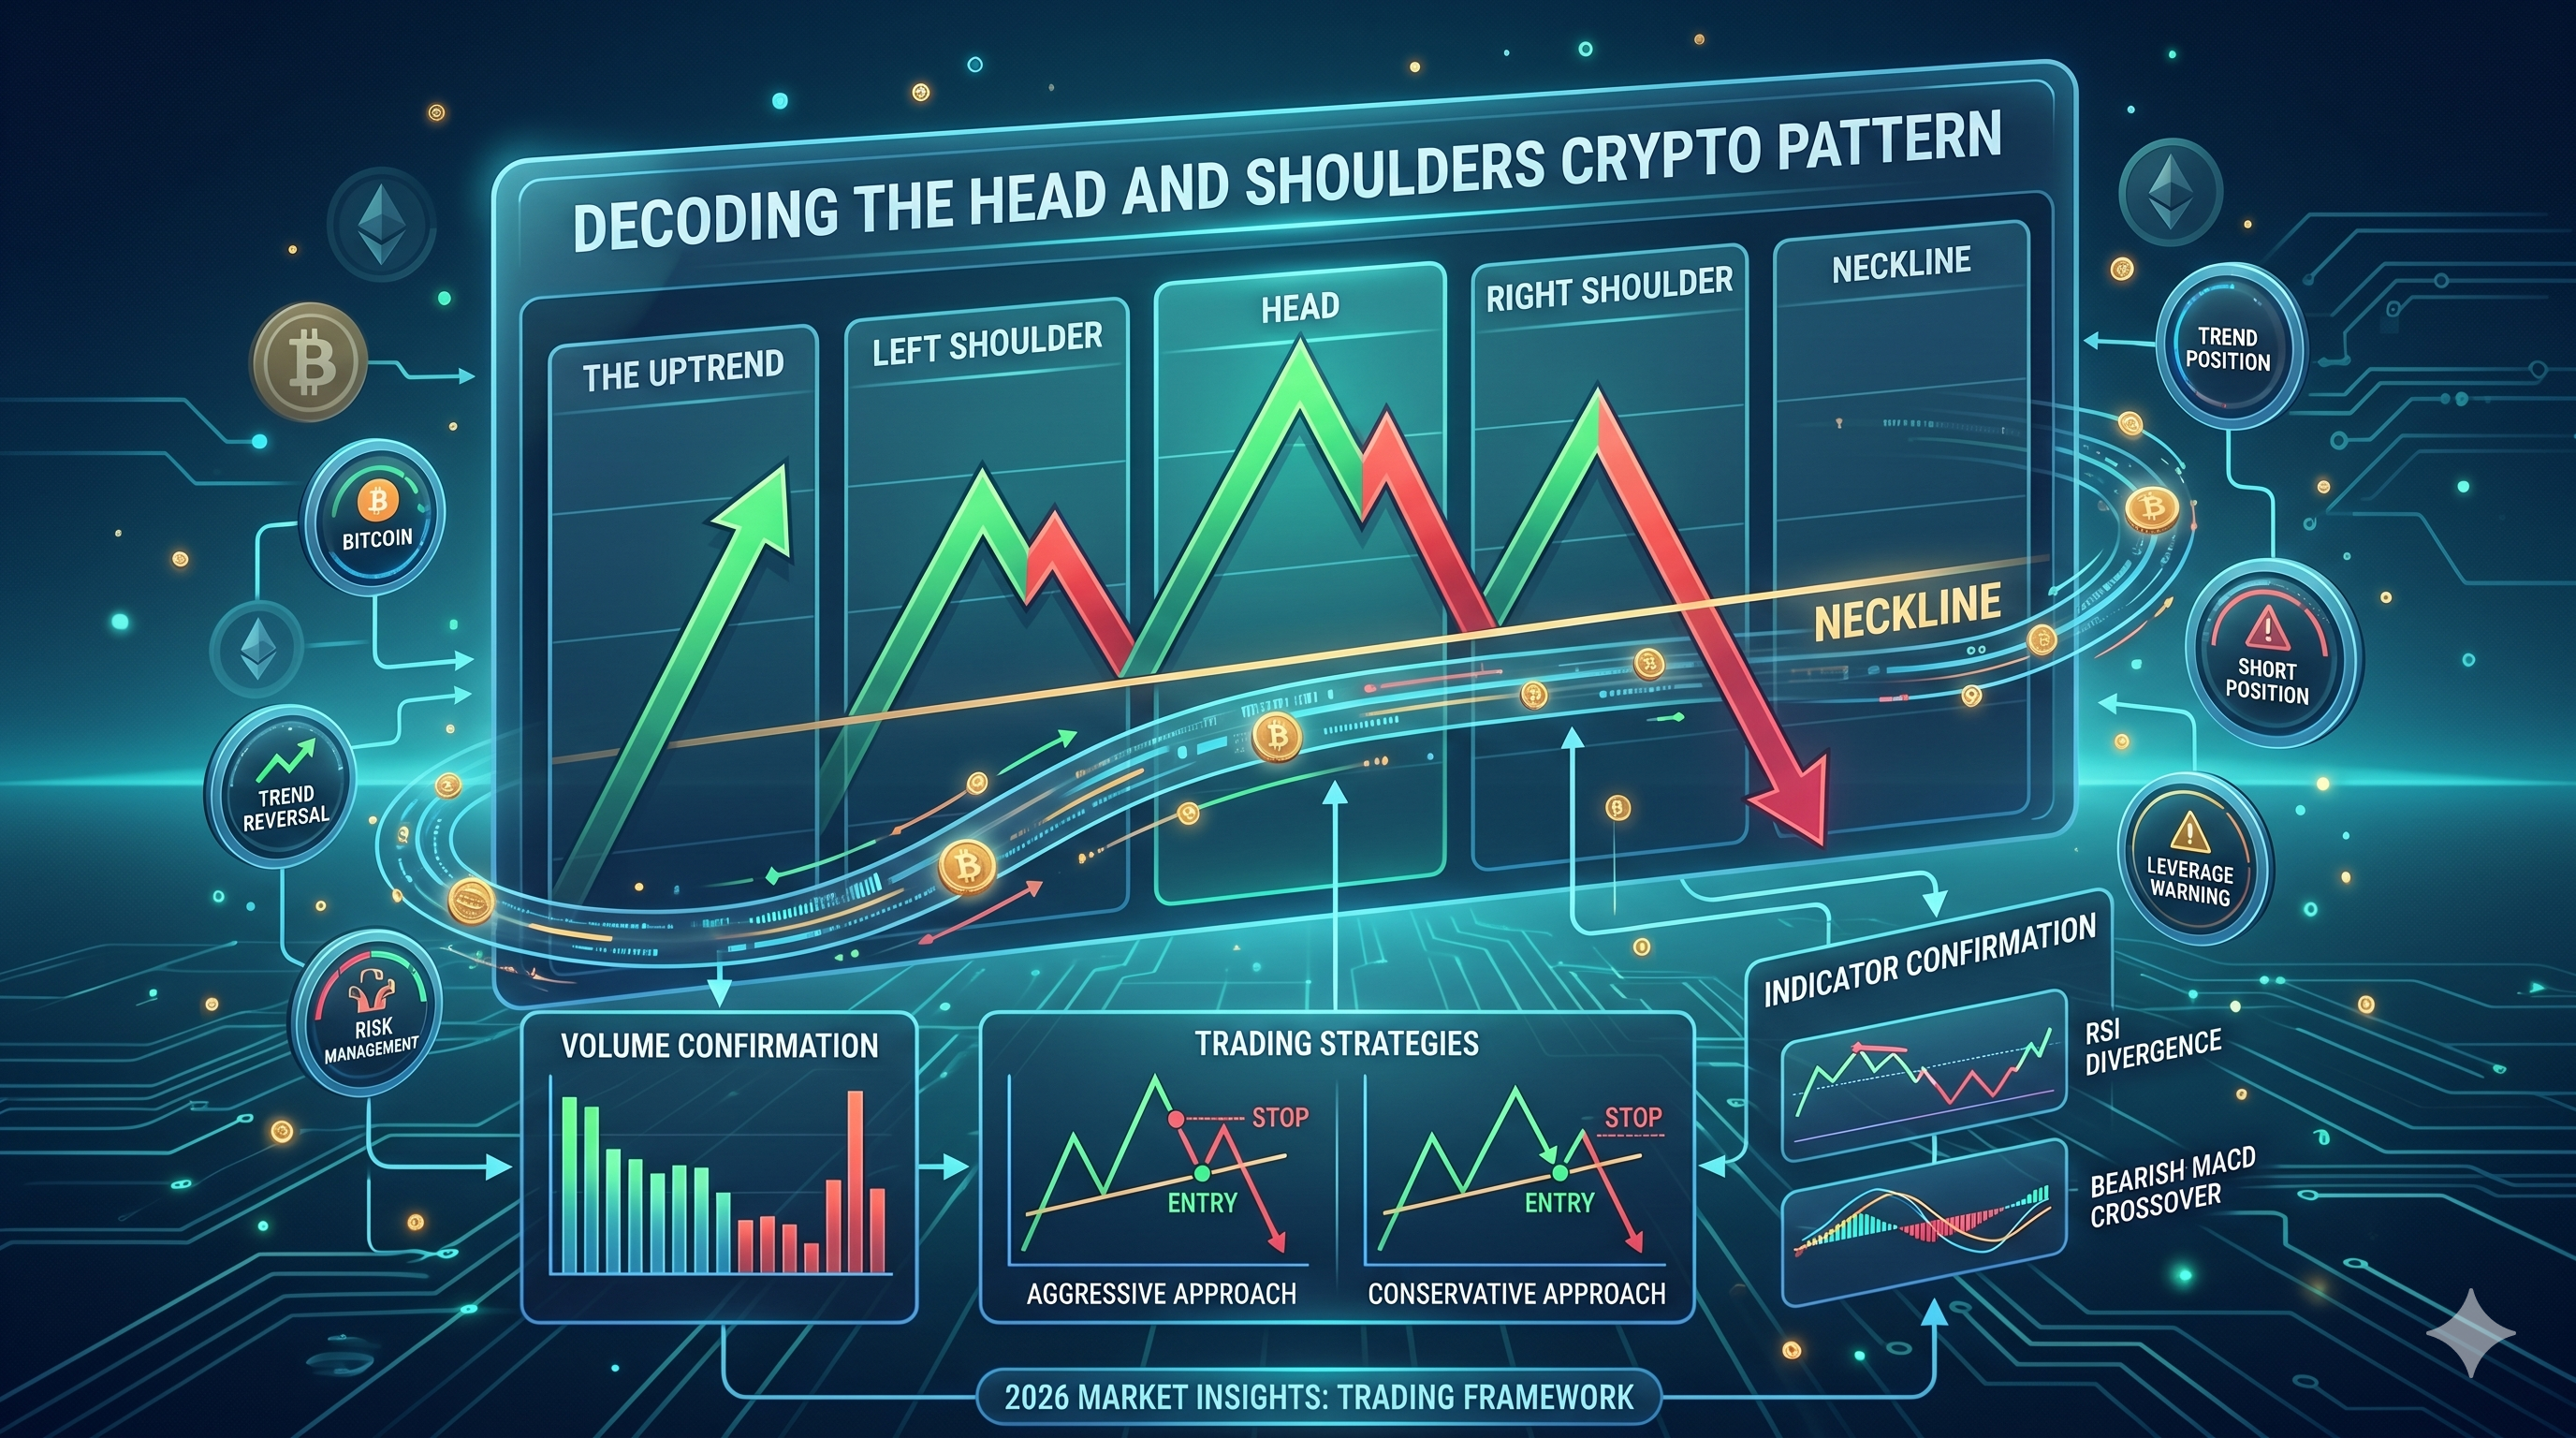
This chart pattern has five components – a preceding uptrend, the left shoulder, the head, the right shoulder, and the neckline.

The Uptrend
The initial requirement for the formation of this pattern is a sustained uptrend. Remember that the Head and Shoulders pattern is a reversal pattern.
The Left Shoulder
After the sustained bullish trend, traders embark on profit-taking, which turns them into sellers in the market. This means that there will be net sellers in the market for a brief moment, resulting in a price pullback.
Note that at this moment, it is often impossible to tell whether the Head and Shoulders chart pattern will form because pullbacks occur regularly in a trending market.
The Head
After the initial pullback, short-term buyers return to the market to take advantage of the falling prices. This results in net buyers, pushing the prices upwards. This uptrend pushes the price beyond the peak formed before the initial pullback.
After reaching a new high, the price drops to the level of the first pullback when the left shoulder was formed. At the moment, we have a left shoulder and a head. The neck is also starting to take shape, but we need to wait for the right shoulder to appear before drawing the neckline.
The Right Shoulder
Formation of the right shoulder is when the complete pattern begins to take shape. The right shoulder is formed when the price rises again, forming the third peak, almost at the same level as the first peak where the left shoulder was formed. Note that the left and the right shoulder do not have to be on the same level.
The Neckline
The neckline in the Head and Shoulders pattern is a horizontal line connecting the support levels of the price pullbacks for the left shoulder, the head, and the right shoulder. This line is often used as the trigger entry for a short position.
In practice, the neckline doesn’t have to be a perfect horizontal line. This usually occurs if the right shoulder is higher or lower than the left shoulder. In this case, the neckline is slanting upwards or downwards.
Volume Confirmation in the Head and Shoulders Pattern
In modern crypto trading, volume analysis has become increasingly important when validating the Head and Shoulders pattern. A strong bearish reversal signal is often accompanied by declining buying volume during the formation of the head and the right shoulder, followed by a sharp increase in selling volume when the price breaks below the neckline.
For example, during several major market corrections in 2025 and early 2026, traders observed that many failed Head and Shoulders setups lacked sufficient breakout volume confirmation. This is why experienced crypto traders now combine price structure analysis with trading volume, open interest, and momentum indicators such as RSI and MACD before entering short positions.
A neckline breakdown with weak selling volume may indicate a false breakout, especially in highly leveraged crypto markets where sudden liquidity sweeps are common. Waiting for strong confirmation can help reduce unnecessary losses and improve trade accuracy.
How to Trade with the Head and Shoulder Pattern?
As we’ve mentioned, the Head and Shoulders chart pattern shows an imminent trend reversal from bullish to bearish. However, you must wait for the pattern to be formed fully before you decide to go short. So, where exactly do you short the market?
There is two way you can short the market, by using a conservative or an aggressive approach.
The Aggressive Approach
With the aggressive approach, traders short the market when the price drops below the neckline, which, as we’ve mentioned, acts as the support level. A break below this support level shows that the sellers are taking charge of the market, pushing the prices downwards, solidifying the bearish trend.
Here, the stop loss level is placed around the peak of the right shoulder. The logic behind this is that should the bears fail to take the prices downwards, then the price trending above the right shoulder means that bulls are still in control of the market.

Head and Shoulders Pattern Formation on the Bitcoin Price Chart | Source: BTC/USDT
The Conservative Approach
With the conservative approach, traders wait for the price action to break below the support level (the neckline) and then wait for a price pullback to retest the neckline. With this approach, we expect the neckline to be retested as a resistance level. It allows you to get additional confirmation of the recent bearish trend to avoid false breakouts. However, there is a possibility of missing the entry point if the price continues downward without a pullback. Similar to the aggressive approach, the stop loss is set around the peak of the right shoulder.
Combining the Head and Shoulders Pattern with Other Technical Indicators
Although the Head and Shoulders pattern is considered a reliable bearish reversal signal, professional traders rarely rely on a single indicator alone. In today’s crypto market environment, combining multiple technical indicators can significantly improve trade confirmation and risk management.
One common approach is to use the Relative Strength Index (RSI) to identify bearish divergence during the formation of the head. When the price forms a higher high but the RSI forms a lower high, it often suggests weakening bullish momentum before the neckline breakdown occurs.
Another widely used confirmation tool is the Moving Average Convergence Divergence (MACD) indicator. A bearish MACD crossover near the right shoulder can strengthen the probability of a trend reversal. Traders also monitor funding rates and futures open interest on crypto exchanges to determine whether excessive long positioning could accelerate a downside move after the neckline breaks.
By combining chart patterns with momentum indicators and market sentiment analysis, traders can avoid many false signals that frequently occur in volatile cryptocurrency markets.
Conclusion
The Head and Shoulders crypto pattern remains one of the most recognized bearish reversal patterns in technical analysis. When properly identified, the pattern can help traders detect weakening bullish momentum and prepare for potential downside movements before a broader market correction occurs.
However, no technical pattern guarantees success. In modern cryptocurrency markets, traders should combine the Head and Shoulders pattern with volume confirmation, momentum indicators, market sentiment analysis, and disciplined risk management strategies to improve trading accuracy.
Whether you are trading Bitcoin, altcoins, or crypto futures, understanding how to identify and trade reversal patterns can become a valuable part of your overall trading strategy.
FAQs
Is the Head and Shoulders pattern reliable in crypto trading?
Yes, the Head and Shoulders pattern is considered one of the more reliable bearish reversal patterns in technical analysis. However, traders should still wait for neckline breakout confirmation and combine the pattern with other indicators such as volume, RSI, and MACD to reduce false signals.
What happens if the price breaks above the right shoulder?
If the price moves above the right shoulder after forming the pattern, it may invalidate the bearish setup. This usually indicates that buyers have regained control of the market and the downtrend confirmation has failed.
Can the Head and Shoulders pattern be used for Bitcoin and altcoins?
Yes. The pattern frequently appears on the charts of Bitcoin, Ethereum, and many altcoins across different timeframes. Traders commonly use it in both spot and futures crypto markets.
What is the difference between a Head and Shoulders pattern and an Inverse Head and Shoulders pattern?
The standard Head and Shoulders pattern signals a bearish reversal after an uptrend, while the Inverse Head and Shoulders pattern signals a bullish reversal after a downtrend.
Should beginners trade Head and Shoulders patterns with leverage?
Beginners should be cautious when using leverage. Crypto markets are highly volatile, and leveraged trading can amplify losses quickly. Many new traders prefer practicing with spot trading or low leverage while learning technical analysis and risk management strategies.