


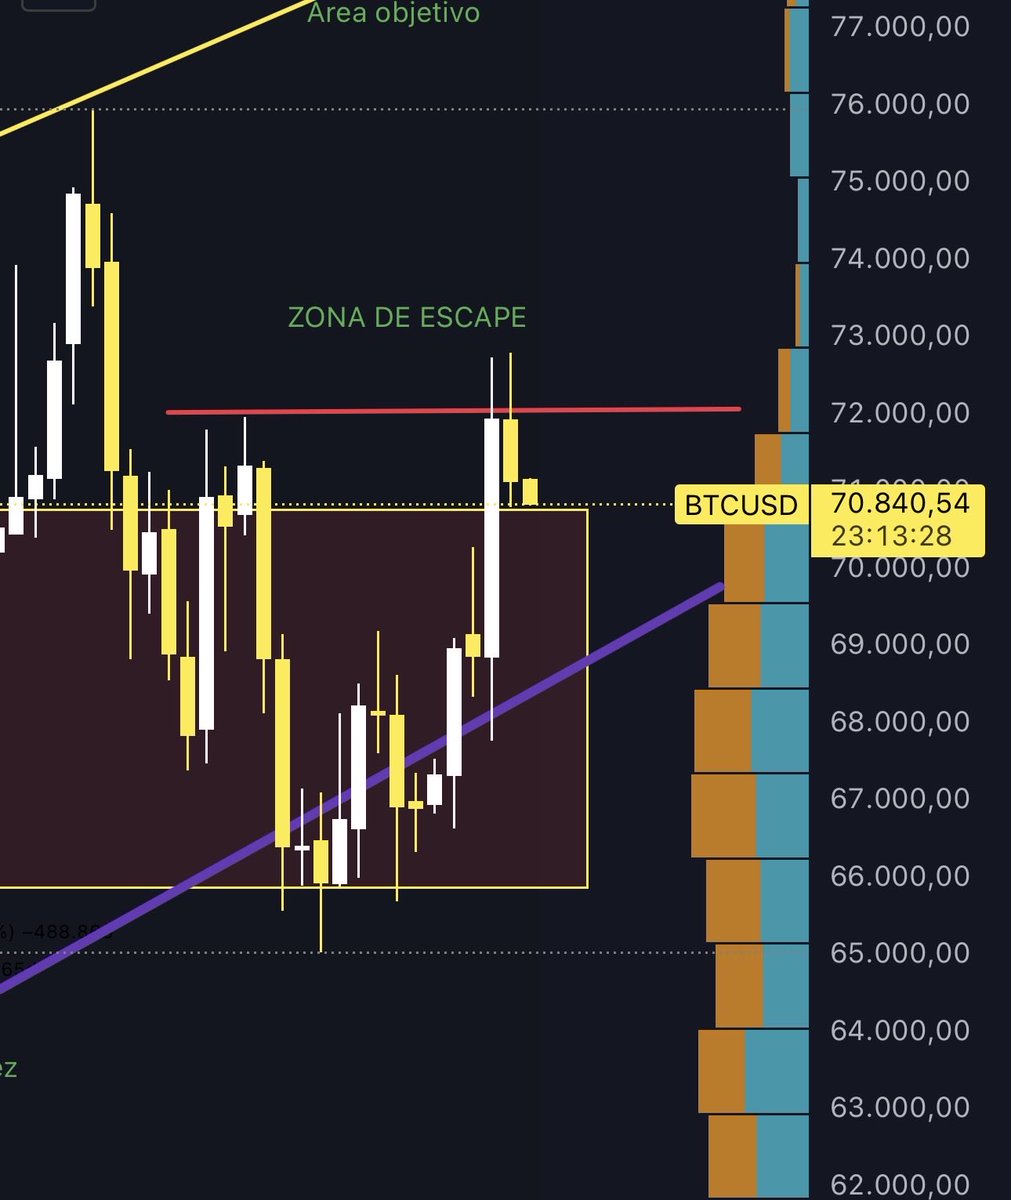
On the 1D chart, we see the reversal pattern from my analysis, showing two wicks—on both a bullish and a bearish candle. This indicates a re-entry into the range by Bitcoin’s price action. I’ll assess how strong the lower boundary of the channel is as support and bring you an update soon. #btc #eth #xrp #xlm #hbar #cardano #algorand #iota #pepe #shiba

Share


Source:Show original
Disclaimer: The information on this page may have been obtained from third parties and does not necessarily reflect the views or opinions of KuCoin. This content is provided for general informational purposes only, without any representation or warranty of any kind, nor shall it be construed as financial or investment advice. KuCoin shall not be liable for any errors or omissions, or for any outcomes resulting from the use of this information.
Investments in digital assets can be risky. Please carefully evaluate the risks of a product and your risk tolerance based on your own financial circumstances. For more information, please refer to our Terms of Use and Risk Disclosure.