


- Stellar price rose to near $0.17 on Thursday, February 26.
- XLM bounced higher as cryptocurrencies recorded gains across the board.
- Bulls could target $0.40 if sentiment holds, but bears remain largely in control.
Stellar (XLM) price rose to near $0.17 early Thursday as a broad market bounce lifted cryptocurrencies.
The altcoin’s price mirrored the movement of major alts and Bitcoin, jumping from lows of $0.15 as sentiment drove buy-side pressure.
Bitcoin’s surge to near $70k came ahead of Nvidia earnings.
BTC is holding above $68k, and this could mean a short-term retest of highs above the psychological level.
However, bulls are at risk of giving up all the intraday gains if bearish sentiment continues to dictate momentum, with analysts pointing to the latest uptick as a potential relief bounce that may yet fade quickly.
XLM price today
XLM price hovers at $0.1647 as of writing, up nearly 8% in the past 24 hours.
The gains put Stellar up about 3% in the past week, and extended the altcoin’s recovery from oversold levels near $0.15.
According to data from CoinMarketCap, the price jump has come amid a spike in daily trading volume.
The spot volume stood at $155 million, up 50% as XLM tested intraday highs around $0.169.
Stellar price technical analysis
Despite notable gains, XLM remains pinned below the 50-day and 100-day SMAs.
The moving averages are clustered near $0.18-$0.21, signalling continued downside pressure.
A descending resistance trendline also caps upside, and bulls need a clean break to sustain the advantage.
In terms of technical indicators, the daily RSI has inched up from oversold territory but stays neutral.
Meanwhile, the MACD shows bullish divergence, but a shrinking histogram suggests limited breakout potential without a notable volume surge.
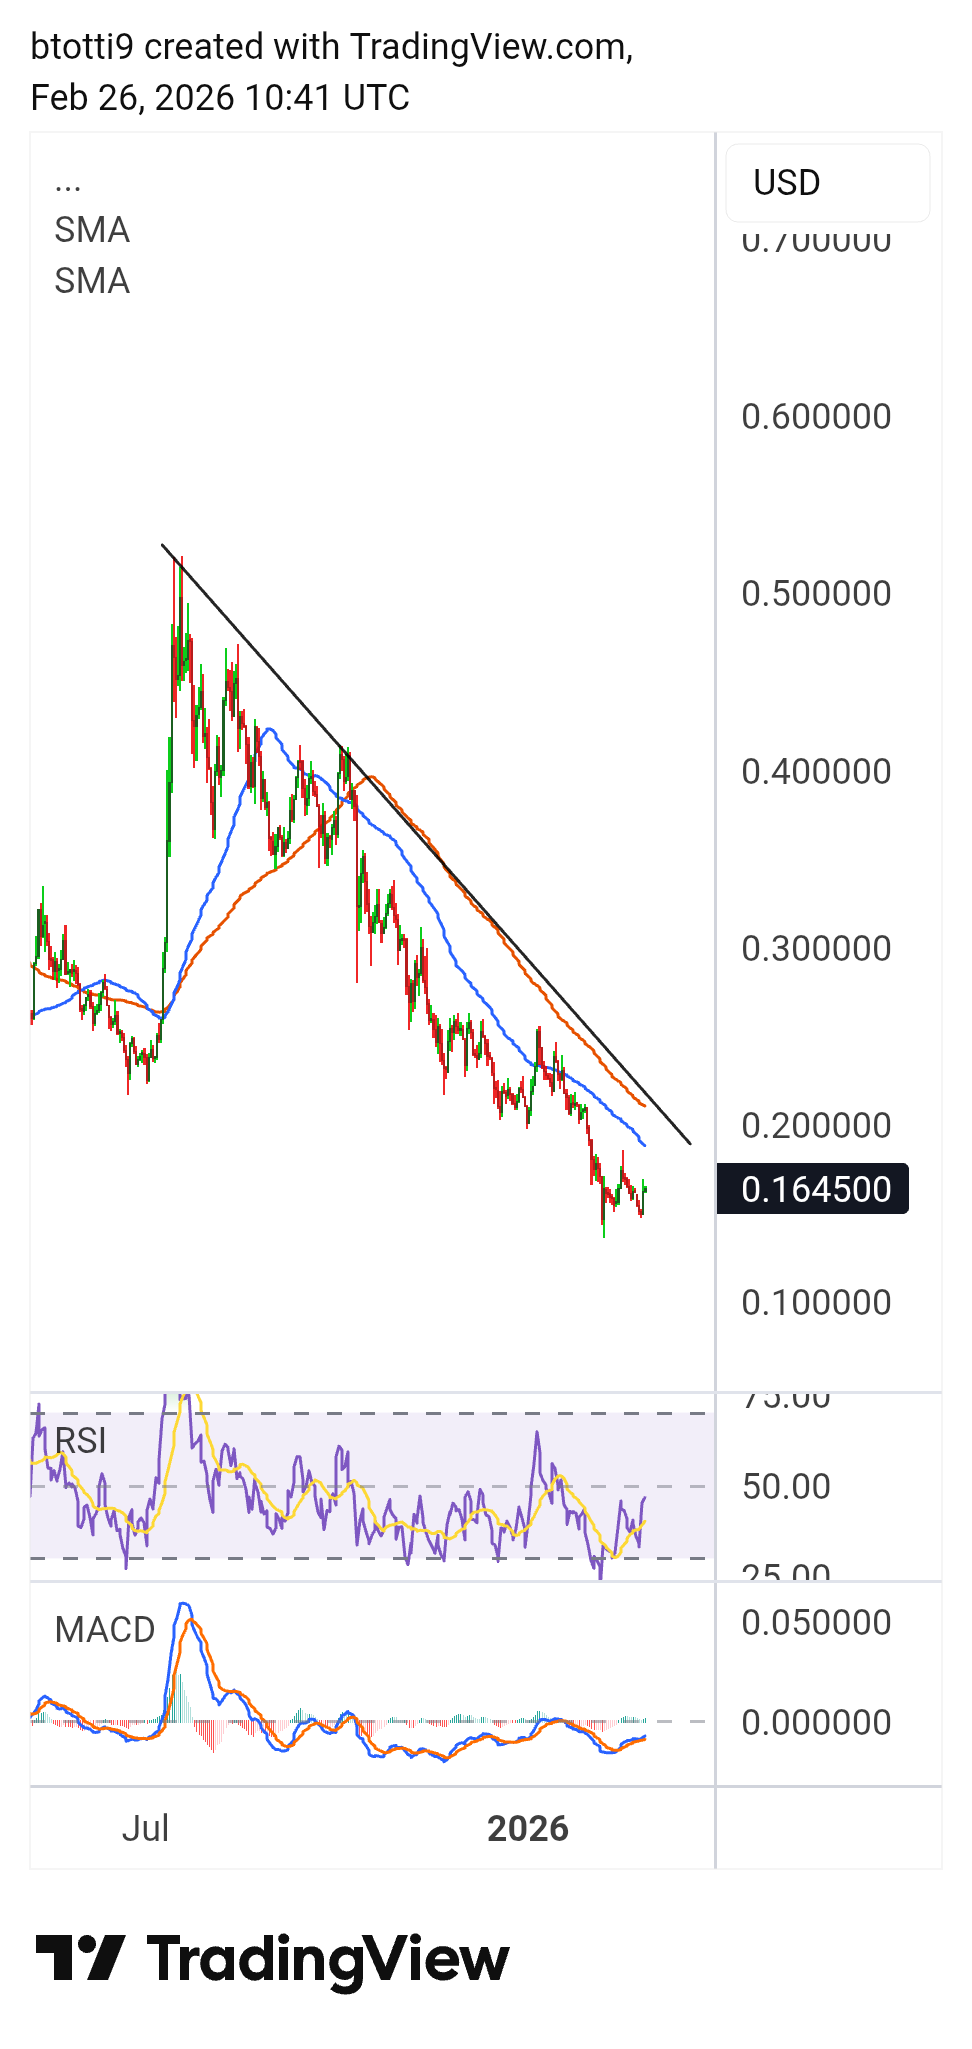
For bulls, near-term recovery hinges on holding $0.16 support.
A push above $0.17 and a retest of highs above the key moving averages will buoy buyers.
Key targets lie in the $0.25-$0.41 area.
Helping Stellar’s bullish outlook is its traction in the payments and tokenization markets.
The blockchain network ranks among the top chains for distributed and represented real-world assets, alongside XRP Ledger and others.
Gains for XRP have often coincided with an uptick for XLM.
On the downside, bears may rely on a bearish tilt supported by negative trends in the derivatives market.
XLM’s futures open interest remains low compared to metrics seen during last year’s peak. Funding rates also reinforce this outlook.
As such, downside risks loom large, and a breakdown below $0.15 could be bad news for XLM bulls.
The post XLM bounces from $0.15 lows, but bears remain in control appeared first on CoinJournal.