


Solana (SOL) has been rejected again at a crucial supply wall around $90 again on Tuesday, March, 3, 2026.
The large-cap altcoin, with a fully diluted valuation of about $51.7 billion, dropped 4% in the past 24 hours to trade around $82.97 at press time. Nevertheless, SOL price has gained 7.82% in the past seven days amid the ongoing Middle East crisis, signaling its market resilience.
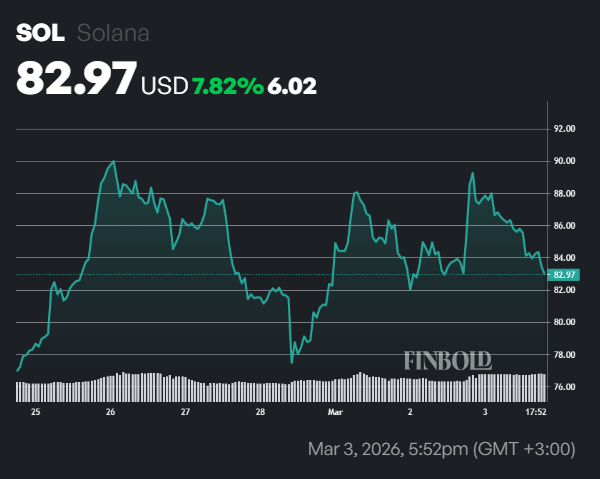
SOL/USD 7-day chart. Source: Finbold
Solana price trapped in a tight range
In the past four weeks, SOL price has been trapped in a tight range between $89 and $77. The recent SOL rejection at the upper border has signaled weak bullish momentum.
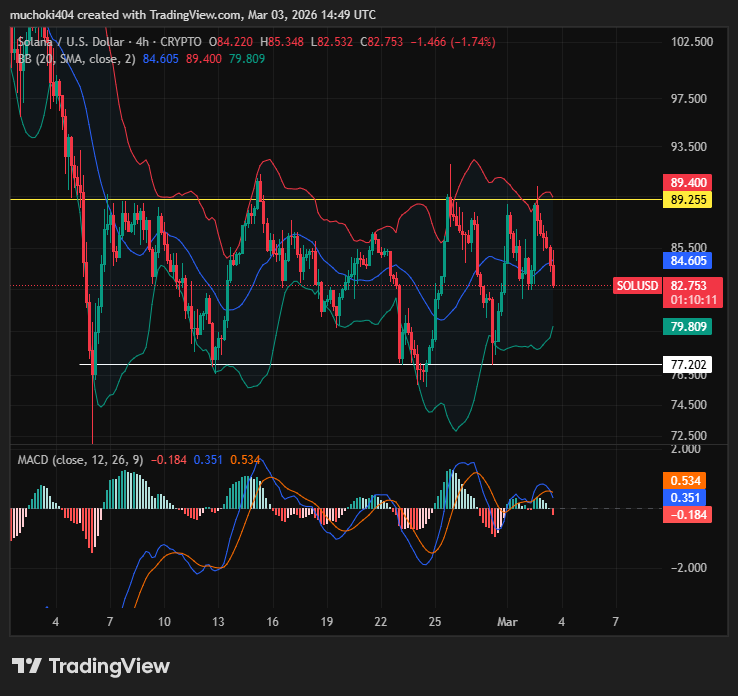
SOL/USD 4hr chart. Source: TradingView
Furthermore, the SOL/USD MACD indicator in the 4-hour timeframe has flashed a sell signal. Notably, the MACD line has crossed below the Signal Line amid a bearish histogram. Additionally, SOL’s 4-hour Bollinger Bands indicator has been squeezing in the last four weeks, signaling an imminent breakout from this range ahead.
What’s next for SOL amid renewed demand?
Amid the ongoing Solana price consolidation, on-chain data analysis shows a renewed demand from institutional investors. For instance, the assets investment products posted a net cash inflow of about $53.8 million last week, thus increasing their total holdings to $2.159 billion, according to data from CoinShares.
The U.S. spot Solana Exchange-Traded Funds (ETFs) have posted net cash inflows in the past four weeks. On Monday, the U.S. spot SOL ETFs posted a net cash inflow of about $16.8 million, thus increasing their total funds to around $79.4 million, based on data from CoinGlass.
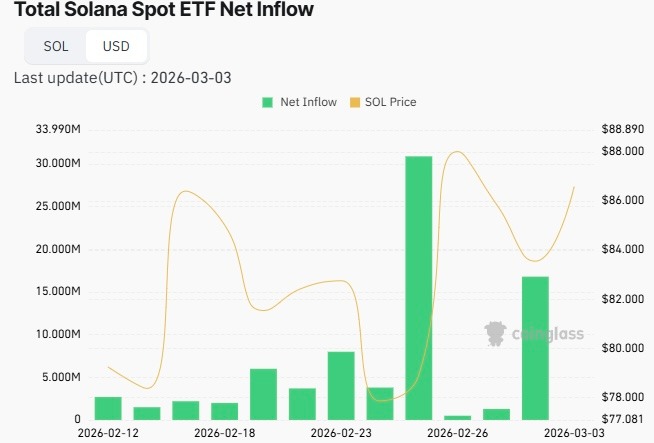
Total SOL spot ETF net inflow. Source: CoinGlass
Despite the renewed demand for SOL from institutional investors, crypto analyst Ali Martinez stated that this altcoin has not yet confirmed a clear trendline. As such, this trading expert expects the SOL price to hit $65 first if it drops below $77 or reach $107 if it rallies above $90 in the near term.