


Key Insights
- Solana approaches $95 Fibonacci resistance as volume jumps to $17 billion and open interest reaches $5 billion, signaling active trader positioning.
- The $92 to $97 zone combines prior support and key moving averages, creating a high impact technical barrier for price.
- Sustained strength above $95 opens room toward $110, while rejection near resistance keeps focus on $85 support.
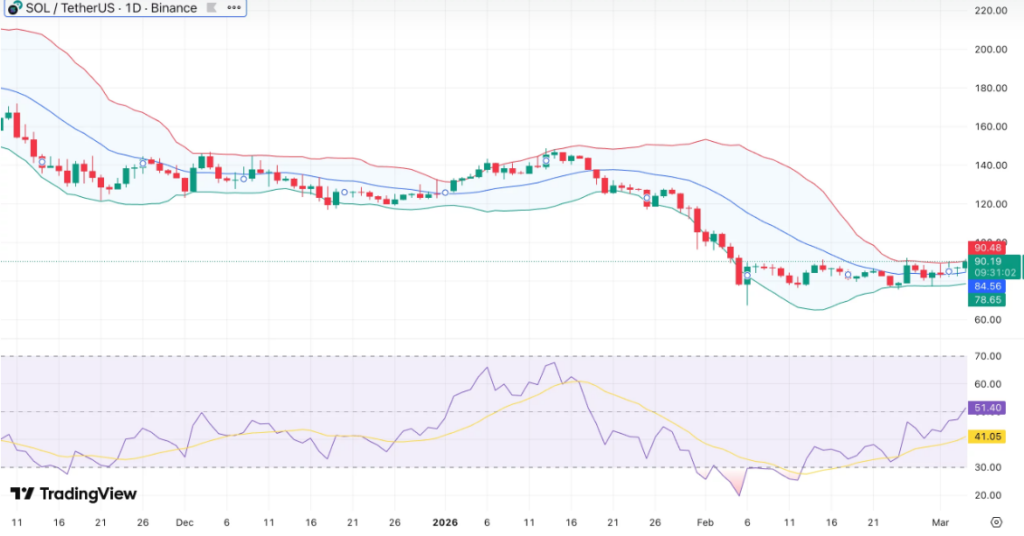
Solana traded at $90.20 at press time, slipping 7.4% over the past 24 hours while pressing against the upper edge of its weekly range. The token touched $90.68 after rebounding from a seven day low near $77.47. Despite the recent bounce, Solana remains down 12% over the past month and nearly 70% below its January 2025 peak of $293.31.
Derivatives data from CoinGlass shows traders returning as price approaches a technical inflection point. Trading volume rose 13 percent to $17 billion, while open interest climbed 6 percent to $5 billion. Consequently, the rise in both metrics suggests fresh positioning rather than simple short covering.
Fibonacci Level Draws Focus
Technical charts place the $95 area at the center of attention. The 38.2% to 50% Fibonacci retracement of the decline from $120 to $80 aligns closely with that level. Moreover, the $92 to $97 zone previously acted as support before the breakdown, and it now stands as potential resistance.
Price also approaches key moving averages including the 50 day EMA and the 100 day SMA. When dynamic resistance meets horizontal supply, the level often gains influence. Hence, traders monitor this zone closely as liquidity likely sits just above $95.
Momentum Signals Mixed Strength
The relative strength index has recovered from oversold territory below 30 and now hovers near the midpoint. However, momentum has yet to confirm a full trend reversal as volume on the rebound remains moderate. Additionally, price must secure a daily close above $95 to shift short term structure decisively in favor of buyers.
If buyers reclaim $95 and sustain momentum, the next upside band sits between $105 and $110. Significantly, a rejection at current levels could expose support near $85 once again. Market participants therefore brace for volatility as price compresses beneath resistance.
Broader Market Backdrop
Institutional flows into Solana related products have increased in recent weeks, supporting on chain activity across DeFi and stablecoins. Moreover, payment integrations such as Visa USDC settlements continue to strengthen network usage. For now, the chart dictates direction as Solana approaches a decisive technical threshold.