


Key Insights:
- Solana price prediction is ranging between $77 and $94 as Bollinger Bands tighten on the 3-day chart.
- SOL trades near $85, with buyers defending support while volume remains weak during consolidation.
- A move above $94 could open a path toward $100, while a drop below $77 may extend weakness.
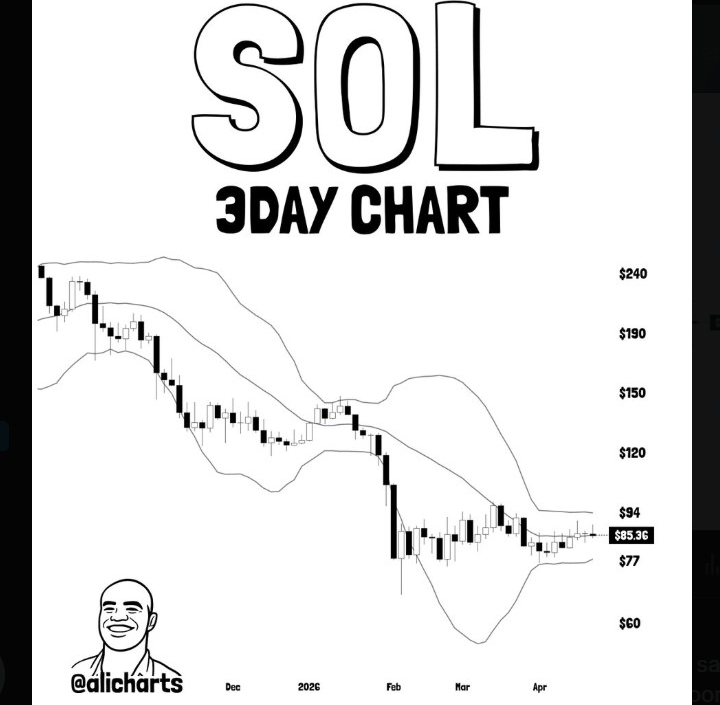
Solana is trading near $86 as traders watch a compressed range on the 3-day chart. Analyst Ali Martinez said SOL is moving inside a tight Bollinger Band zone between $77 and $94. A 3-day candlestick close outside the band could trigger a volatility spike, according to his chart. The Solana price prediction places $94 as the near breakout marker, while $100 sits as the next psychological level for buyers.
Solana Price Prediction: SOL Trades Inside a Tight 3-Day Range
Solana price has moved sideways after failing to hold a push toward $90 earlier in the week. The token recently traded near $86.26, with only a small daily gain, while weekly performance showed a decline of nearly 3%. Price action now sits near the middle of the $77 to $94 band shown on the 3-day chart.
The Bollinger Bands on the 3-day chart have narrowed around SOL price. Traders often track the indicator to measure volatility and identify periods of compression. The squeeze has formed a tight price range, with the longer consolidation building energy for a later breakout.
The chart also shows SOL holding above the lower end of the range. The $77 area acts as nearby support, while the $94 line marks the upper boundary.
Martinez described the $77 to $94 range as a “no-trade zone” for Solana. He said chasing candles within the range can expose traders to choppy price action. His view focuses on waiting for a clear 3-day candle close outside the bands before treating the move as a breakout signal.
Martinez shows SOL moving below the upper Bollinger Band after months of falling pressure. Price has stabilized since March, but it has not broken above the upper range. The latest candle formation shows narrow movement near $85.36, according to the chart.
Solana Price Prediction Watches $94 Breakout Level
The Solana Price Prediction now centers on whether SOL can break above $94 with enough volume. The token has traded between $80 and $92 in recent sessions, while broader chart levels show support near $75 to $80. Buyers have defended the current range near $85, but participation has not yet expanded strongly.
Volume has reportedly dropped more than 23%, showing lower market activity during the consolidation phase. Lower volume often occurs during sideways moves, while a breakout typically requires stronger trading activity. A rise above $94, with higher volume, would provide the $100 target with more technical support.
The 50-day moving average has also acted as a key support area in recent trading. SOL has maintained an upswing since the start of the month, but resistance near $92 to $94 continues to cap the move. A break above that area would shift focus to the next resistance band.
ETF Inflows and Market Liquidity Stay in Focus
Solana spot ETFs have recorded five straight trading days of net inflows, totaling close to $1.45 billion. The inflows add fresh attention to SOL as traders assess whether institutional demand can support a stronger move. Goldman Sachs also disclosed a nearly $108 million Solana position, adding another data point for market watchers.
Those flows arrive as Solana trades near a technical trigger zone. ETF demand can support liquidity, but SOL price still needs a confirmed breakout on the chart. The current setup keeps $77 and $94 as the main boundaries for traders following Martinez’s 3-day view.
The post Solana Price Prediction: SOL Eyes $100 Breakout as Analyst Flags 3-Day Squeeze appeared first on The Market Periodical.