


- Over 1M SOL have been withdrawn from exchanges in 72 hours as long-term holders show confidence.
- Post-flush price consolidation shows that the market absorption is not renewed selling pressure.
- In February, TVL cooled gradually, as holders redistributed positions to reduce sudden liquidity loss.
Over 1.077 million SOL were withdrawn from exchanges in the past 72 hours. Analytically, reduced exchange supply suggests lower selling pressure. Usually, this creates conditions for potential upward momentum in SOL price.
Exchange Withdrawals Indicate Reduced Sell Pressure
This pattern suggests a shift from distribution to accumulation. With supply leaving exchanges and potentially thinning order books, this could affect future price action.
This signals growing confidence from institutional investors, who may be anticipating higher SOL prices.
Or they could be simply protecting their holdings from short-term market swings. Either way, the trend hints at a cautious yet structurally bullish outlook.
Price Action Shows Post-Capitulation Absorption
SOL price followed a descending structure with lower highs and lower lows, culminating in a sharp flush toward the low-$80s. The capitulation included a high-volume wick, signaling seller exhaustion.
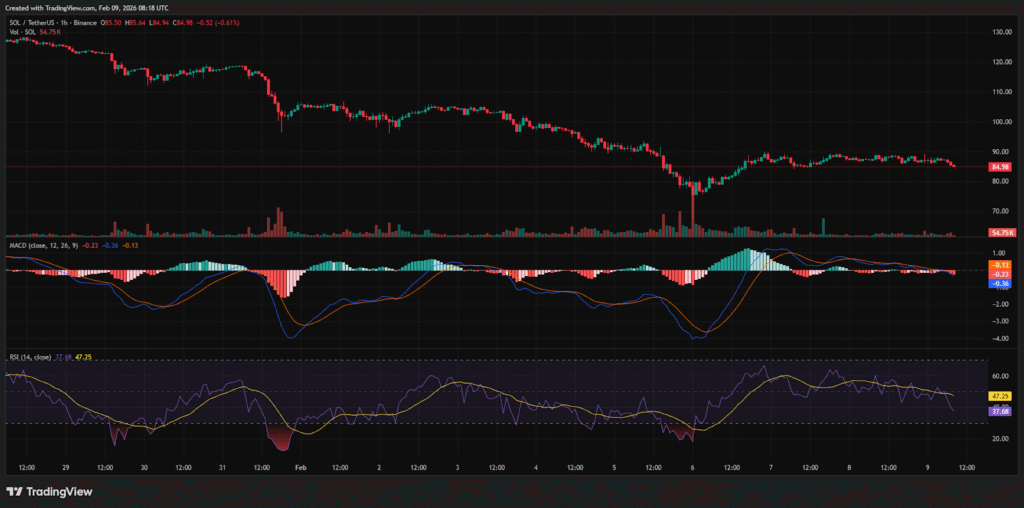
Following the flush, the price rebounded to the mid-$80s, forming a tight consolidation range.
Technical indicators confirm the transition from aggressive selling to market balance. The MACD, which was negative, crossed bullish during the rebound, then flattened near the zero line.
Similarly, RSI recovered from oversold territory to mid-40s and low-50s, then slightly declined. Both indicators suggest compression rather than renewed bearish pressure.
Volume trends during this period declined while price consolidated, indicating neither buyers nor sellers held full control. Market movement in this phase represents absorption, where prior selling is met with cautious accumulation.
Analysts note this creates conditions for a potential upward impulse if resistance levels are breached.
February TVL Movement Suggests Healthy Redistribution
Solana’s total value locked (TVL) data shows that investors are rotating funds into Solana rather than leaving assets idle.
The controlled decline suggests profit-taking and reallocation rather than mass withdrawals. Core liquidity remained, indicating a structurally stronger foundation for Solana heading into March.
The TVL behavior aligns with broader market volatility. Price corrections during this period led to partial unwinding of leveraged or short-term positions.
Despite this, TVL maintained a level above pre-February values, showing that capital was redistributed, not lost. This redistribution underlines a market that absorbed gains while retaining structural strength.