


Key Insights
- Ethereum price has formed a death cross pattern on the daily chart.
- It has formed a head-and-shoulders pattern and moved below the Supertrend indicator.
- Key Ethereum metrics like ETF inflows and network fees have dropped.
Ethereum price remained under pressure on the first day of the year. It was trading at $2,975, inside a range it has been in the past few days. Technical analysis suggests that it may have a bearish breakout in the near term as key metrics deteriorate.
Ethereum Price Technicals Suggest a Dive is Possible
The daily timeframe chart shows that the ETH price peaked at $4,950 in 2025. Then, it resumed a downward trend to a low of $2,617 in November. It then attempted to rebound and faced resistance at $3,450.
A closer look shows that the token has more downside to go in the near term. It remains below the Supertrend indicator, a common bearish continuation signal.
The coin also formed a death cross pattern in November 2024 when the 50-day and 200-day EMAs crossed each other. This pattern often leads to more downside because it signals that the short-term momentum is accelerating.
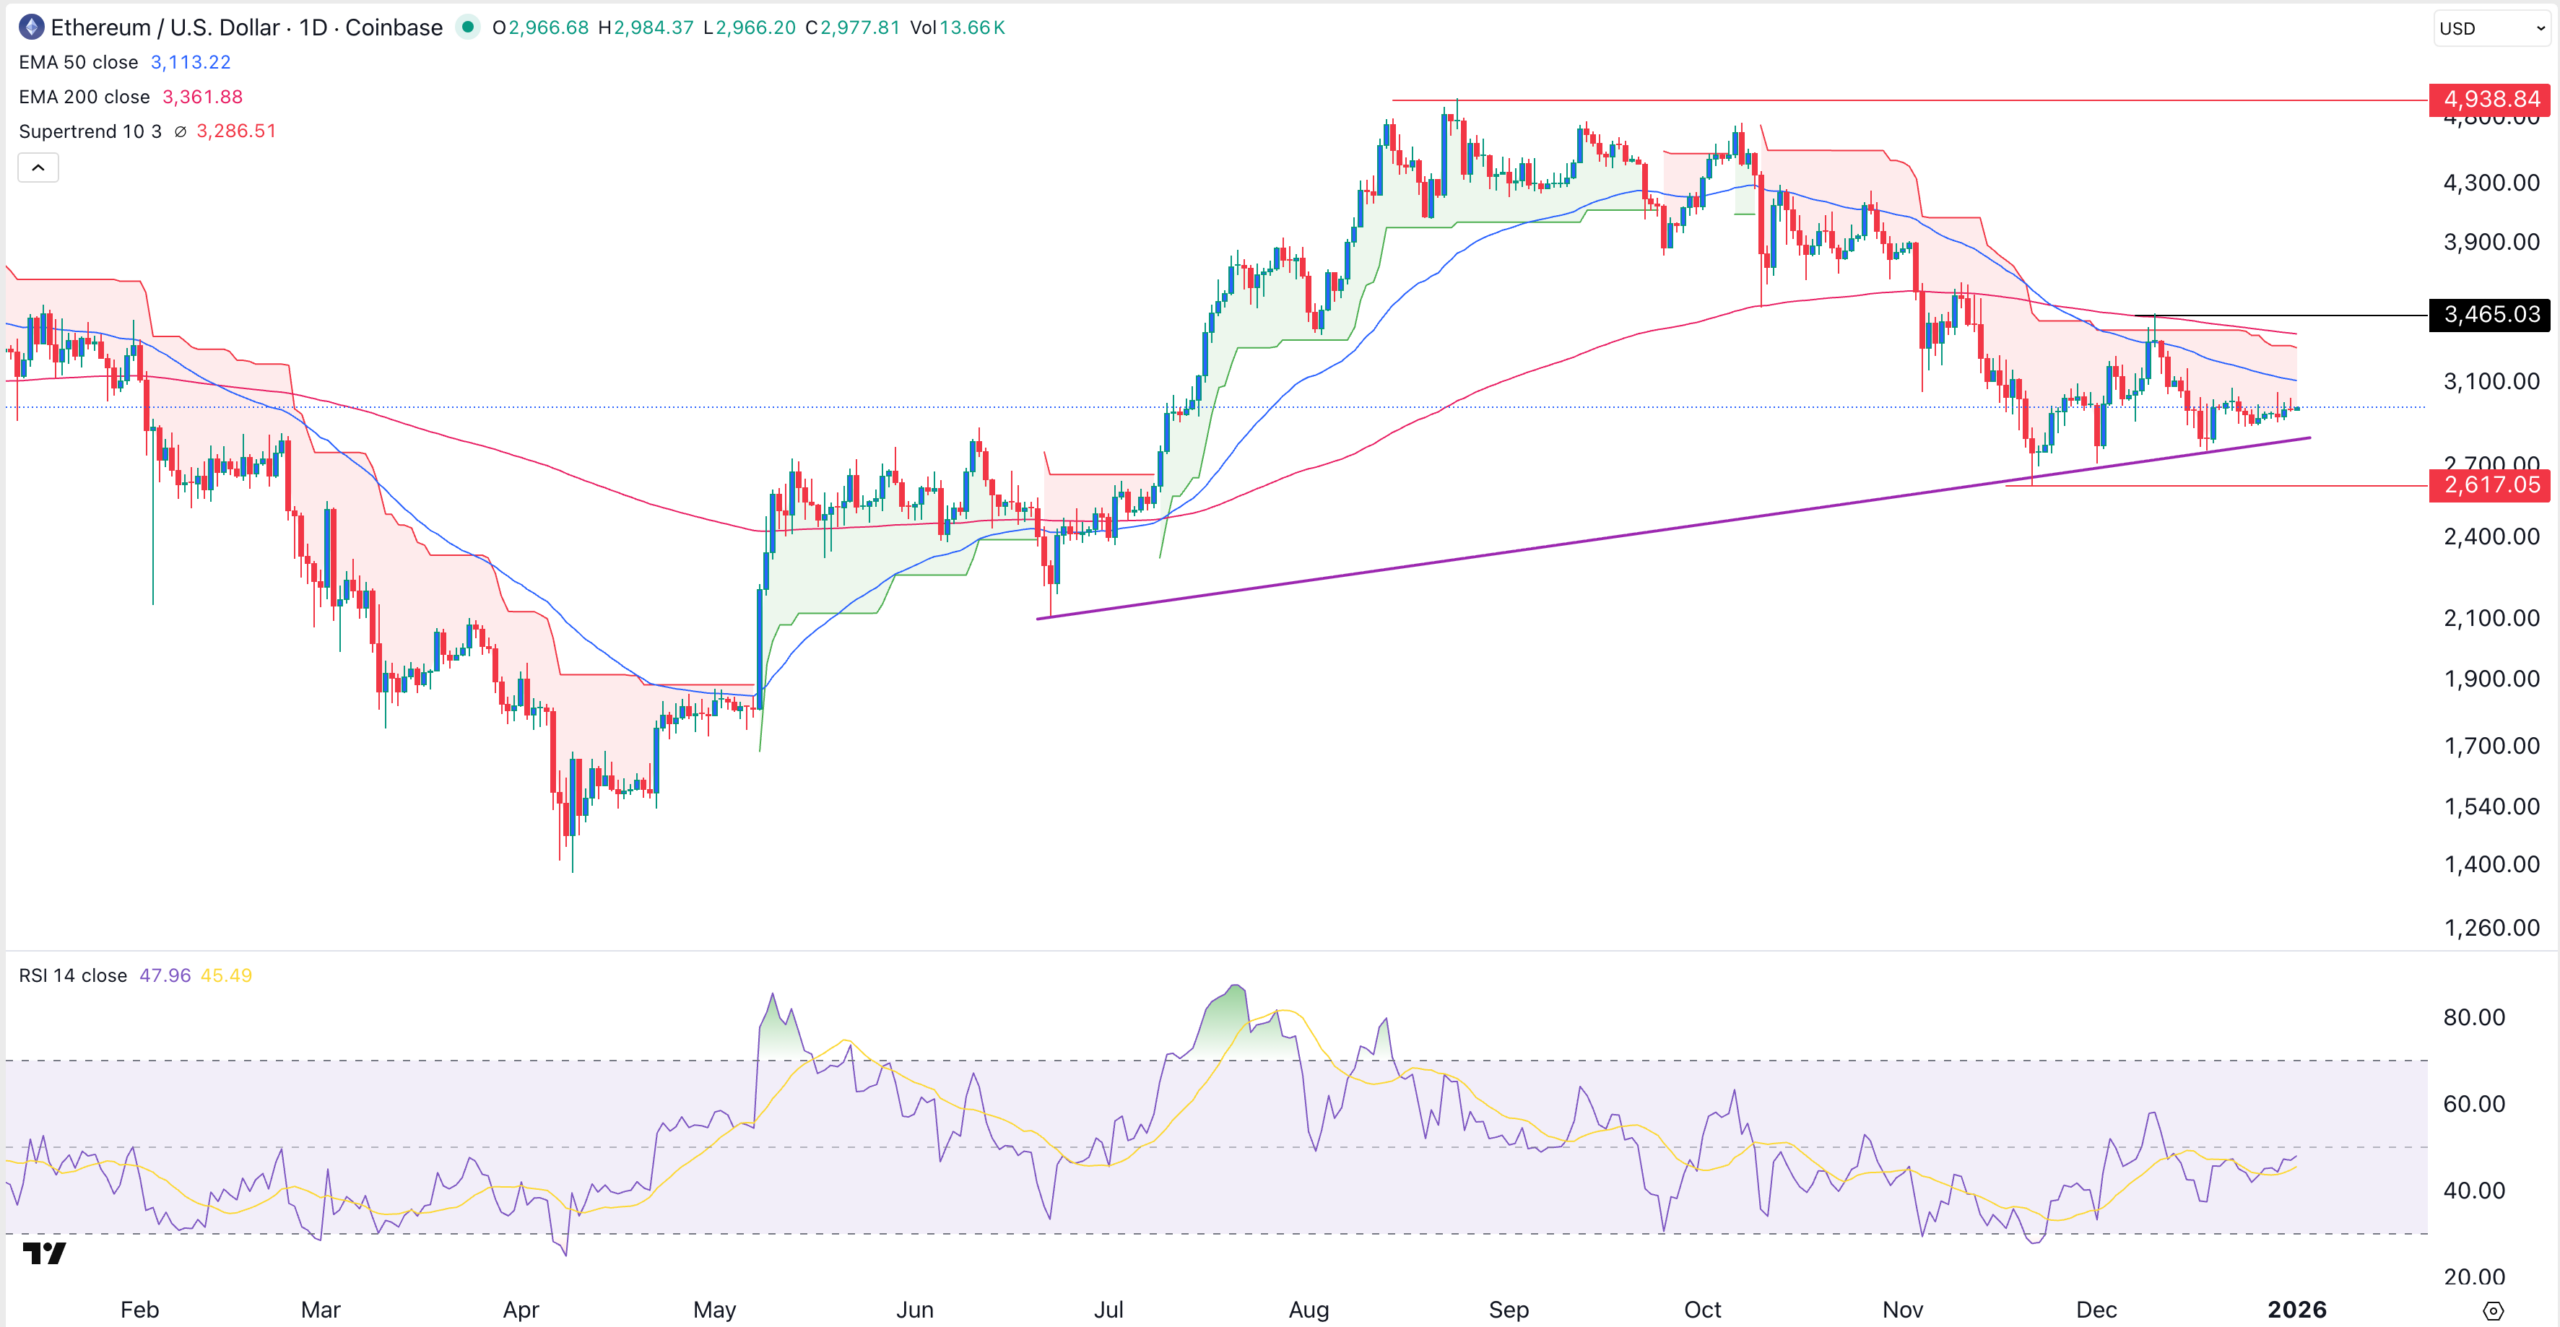
The opposite of the death cross pattern is a golden cross, which the coin formed on July 25. Ethereum price soared by 80% to a record high after this pattern formed.
Ethereum has also formed a small head-and-shoulders pattern, indicating further downside. If this happens, the next key target to watch will be at $2,617, its lowest level in November. A drop below that level will point to more downside, potentially to $2,500.
The bearish ETH price prediction will be invalidated when it moves above $3,465, the highest swing in December.
Ethereum Price Crash Linked to Rising ETF Outflows
One reason why the Ethereum price crash may happen is that demand for its ETFs has continued to wane recently. SoSoValue data shows that spot ETH outflows stood at over $616 million in December last year.
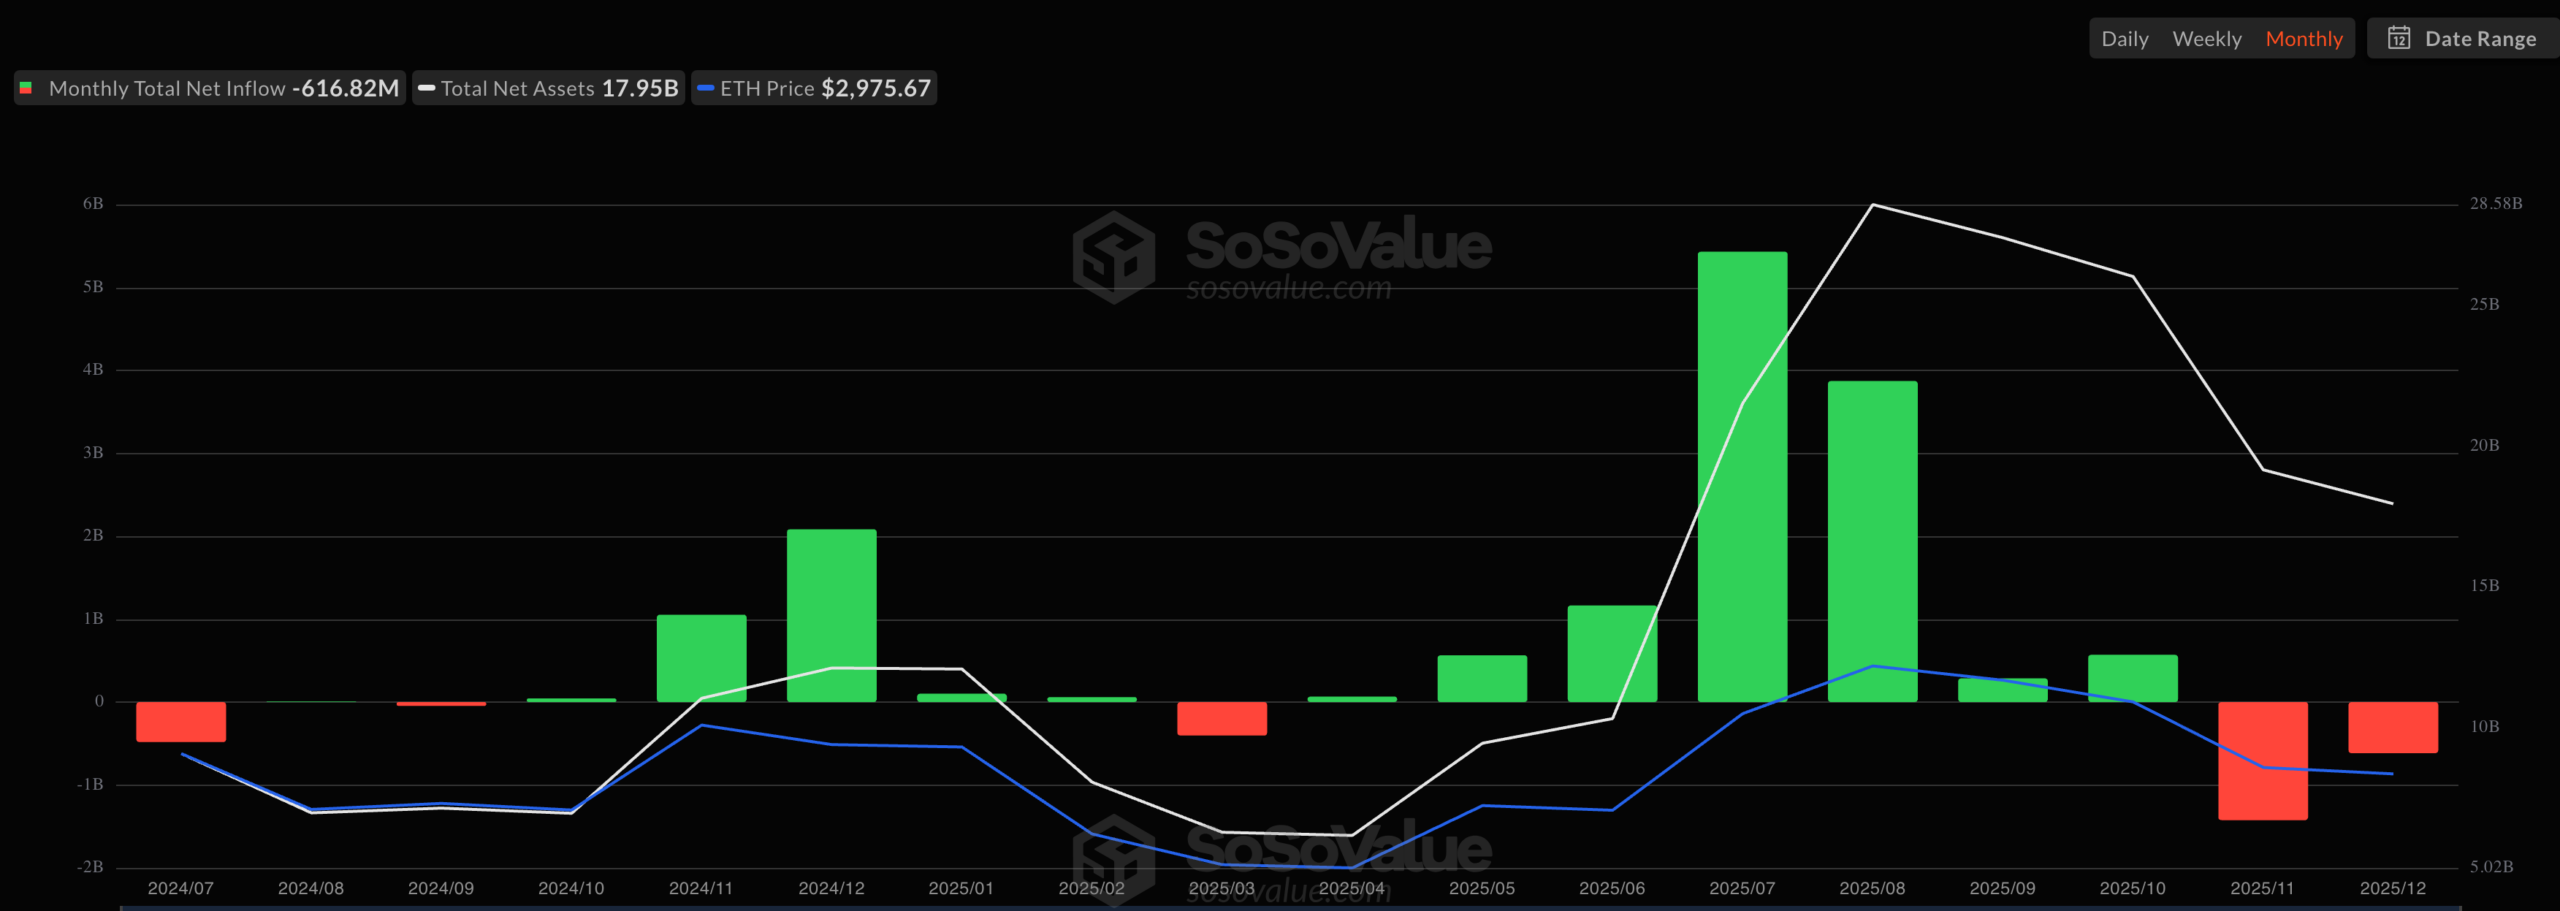
It was the second consecutive month of outflows after the funds shed over $1.42 billion in November. These outflows brought the cumulative net inflows to $12.3 billion and the net assets to $17.95 billion.
ETH ETF outflows have risen as the coin has remained in a technical bear market, falling by 40% to the current level. The outflows have brought BlackRock’s assets to $10.2 billion, while Grayscale’s ETHE has $2.7 billion.
Ethereum Network Fees Have Dropped
Meanwhile, more data shows that Ethereum’s network fees have plunged in the past few weeks. According to Nansen, the fees fell by 55% in the last 30 days to $10.5 million. It’s a drop that coincided with the Fusaka upgrade.
One reason for the decline is that Etheeum’s stablecoin volume pulled back in the last 30 days. Transaction count jumped by 56% to 39.4 million. However, the adjusted volume dropped by 2% to over $984.3 billion.
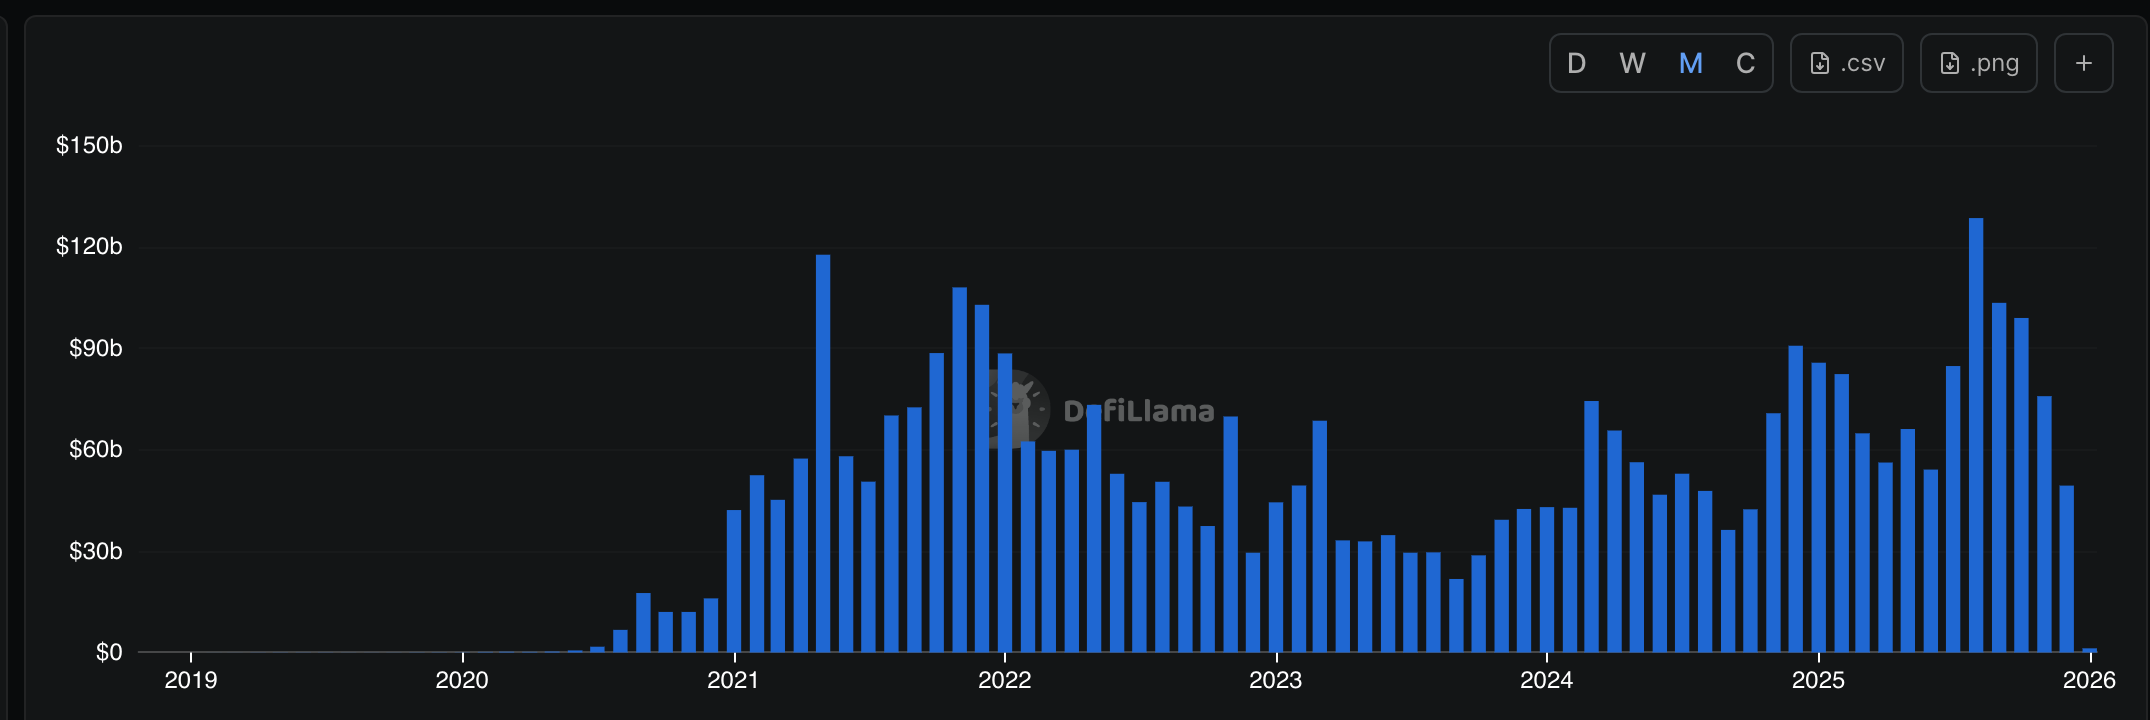
Additionally, the volume on decentralized exchange (DEX) protocols in Ethereum has continued to decline during the ongoing crypto market crash.
According to DeFi lama, the volume in these protocols dropped to $49 billion in December. It was down sharply from last year’s high of $128 billion. This decline happened across all protocols like Uniswap, Curve Finance, Fluid, and Dodo.
More data shows that investors are pulling ETH tokens from their staking pools. StakingRewards data shows that the amount of staked ETH dropped by 29.3k tokens worth $87 million in the last 30 days.
Ethereum price has a combination of bearish technicals and fundamentals that may drive it downwards in the coming weeks.
It has formed a death cross and a small head-and-shoulders pattern. Also, it remains below key indicators like moving averages and the Supertrend.
On the positive side, however, Tom Lee’s BitMine has continued accumulating ETH tokens. It’s a sign that he expects the price to rebound. He has pledged to continue buying in the near term, to hold 5% of the supply.
The post Ethereum Price Forms Risky Patterns as Key Metrics Deteriorate appeared first on The Market Periodical.