


Key Insights:
- Ethereum records 2.2M transactions per day as fees fall to $0.17
- Pectra and Fusaka upgrades help reduce costs and increase mainnet throughput
- Staking demand rebounds, ETH queued to stake doubles withdrawals
Ethereum hit a new network milestone this week as activity spiked and transaction costs continued to decline. Data from Etherscan revealed the blockchain handled 2.2 million transactions in one day, the highest number in its history. At the same time, the average transaction fees fell to about $0.17, adding to Ethereum’s reproductive efficiency.
The record showed increased costs often accompanied a marked change from previous cycles, during which increased usage. Instead, Ethereum is now dealing with increasing demand without driving users away. Analysts view this as evidence that recent protocol upgrades are yielding results.
Daily Transactions Hit All-Time High on Ethereum Mainnet
Ethereum hit the milestone on Tuesday, according to Etherscan data. The 2.2 million daily transactions broke all previous records on the network. Notably, the spike was occurring without congestion-driven spikes in the fees.
In earlier cycles, there were significant spikes in transaction costs due to high activity levels. The most extreme example occurred in May 2022, when the average fee for completing a transaction reached just over $200. That environment drove many users to the less expensive alternatives and layer-2 networks.
This time around, the outcome looks different. Despite sustained growth in usage, Ethereum’s base layer remained stable. Fees have trended lower despite an increase in transactions.
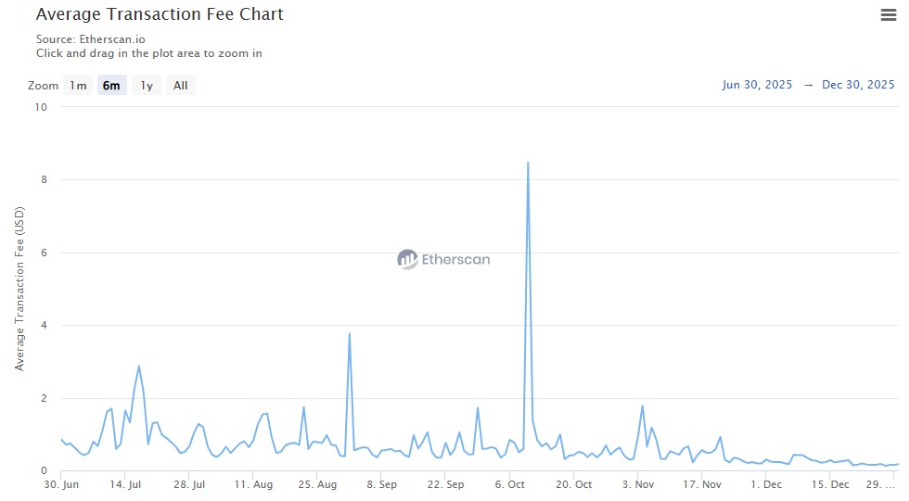
Fee data indicate a steady decline since October 10, when the average cost was near $8.48. That period coincided with a market-wide liquidation event. Since then, activity recovered, but fees continued to fall.
Upgrades in 2025 Drive Efficiency Gains
Analysts largely attribute Ethereum’s 2025 upgrades to the improved performance. The Pectra upgrade, which was activated in May, focused on validator efficiency and staking flexibility. It also provided foundations for future scalability features.
Later on in the year, Ethereum deployed the Fusaka upgrade. This changed the gas limit from 45 million to 60 million per block. The adjustment has increased base throughput by about 33%.
Validator support for higher capacity was great. In February, over 50% of Ethereum validators voted to increase the gas limit. That consensus minimized the risk that the network would strain as activity increased.
Analysts point out that these changes made Ethereum capable of horizontal scaling. Instead of having to force users off-chain, the mainnet absorbed demand directly. This represented a structural change in how the network handles growth.
Developer Activity and Institutional Inflows Accelerate
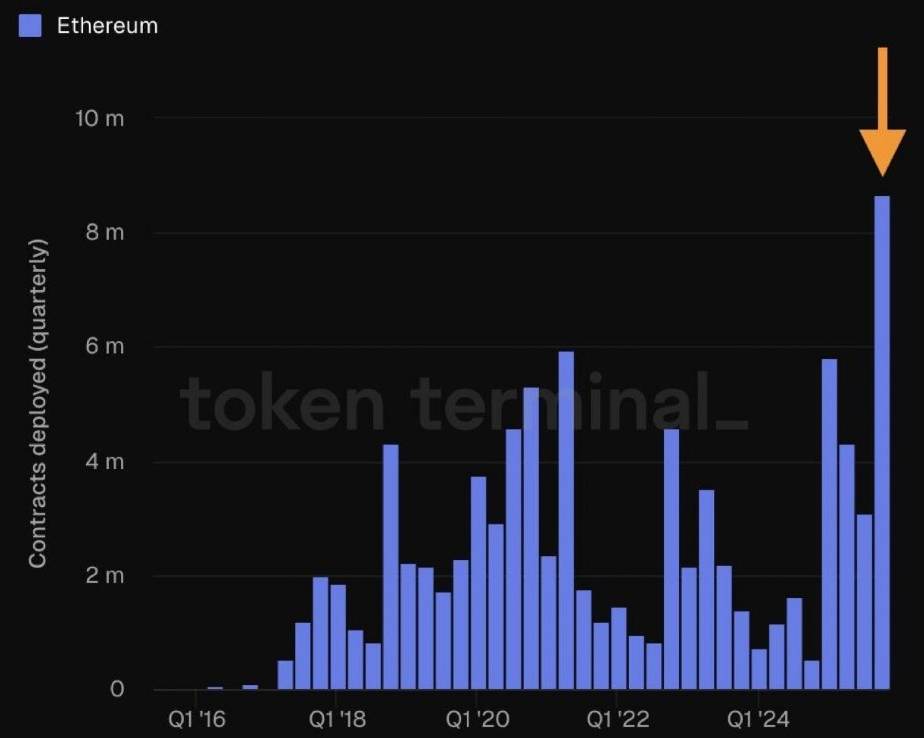
Lower fees have also encouraged developer participation. Data by Token Terminal indicates the number of new smart contracts reached 8.7 million in Q4, a record high. Developers have come to see Ethereum as a reliable settlement layer.
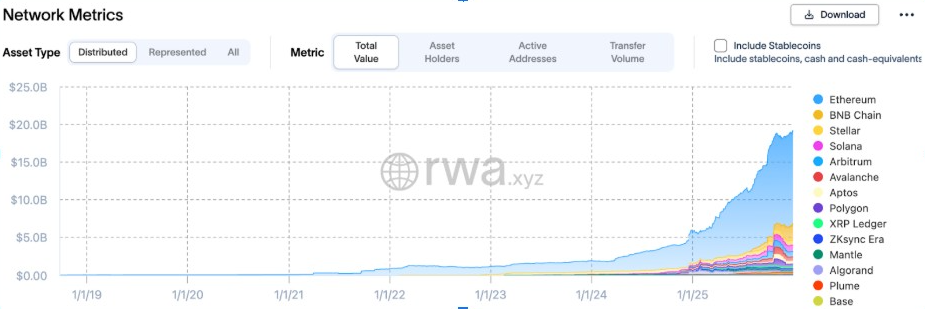
Analysts attribute this growth to three areas: real-world assets, stablecoins, and core infrastructure. Ethereum is still the dominant platform for tokenized assets. According to RWA.xyz, it hosts around $12 billion of the $19 billion total tokenized asset market.
Stablecoin dominance is another strength. DeFi Llama data showed that Ethereum has over $167 billion of circulating stablecoins. That figure is ahead of all other blockchains.
Institutional interest has followed these trends. Research firm Artemis named Ethereum as the leader in the blockchain space for net inflows of funds in 2025. Analysts estimate inflows of about $4.2 billion during the year.
Staking Queue Flips as Confidence Returns
Ethereum’s staking data added one more layer to the picture. This week, the staking queue turned positive for the first time in six months. Nearly twice as much ETH is now waiting to be staked as compared with ETH queued for withdrawal.
Unstaking is considered a sign of possible selling. By contrast, increased demand to stake implies long-term confidence among validators. It also decreases the liquid supply available on the market.
Analysts experience the change as being consistent with overall network health. Improving efficiency helps reduce the cost of functioning for validators. That is a dynamic that makes staking more attractive in times of steady growth in usage.
The post Ethereum Sets Transaction Record as Fees Slide and Staking Demand Rebounds appeared first on The Market Periodical.