



Bitcoin [BTC] has pulled back sharply after being rejected at $66,000, with a massive wave of capital exiting the market over the same period.
BTC is now making another attempt to cross this level after the 4.8% drop that pushed it lower on the chart. Although bullish optimism has returned, the market still faces the risk of a drag lower, according to recent liquidation data.
Is there a chance of a BTC pullback?
The renewed optimism does not remove the key risk posed by liquidation levels on the chart, which could weigh heavily on price. Liquidation cluster analysis shows a build-up of liquidity sitting below price, concentrated around the $60,000 to $61,500 level.
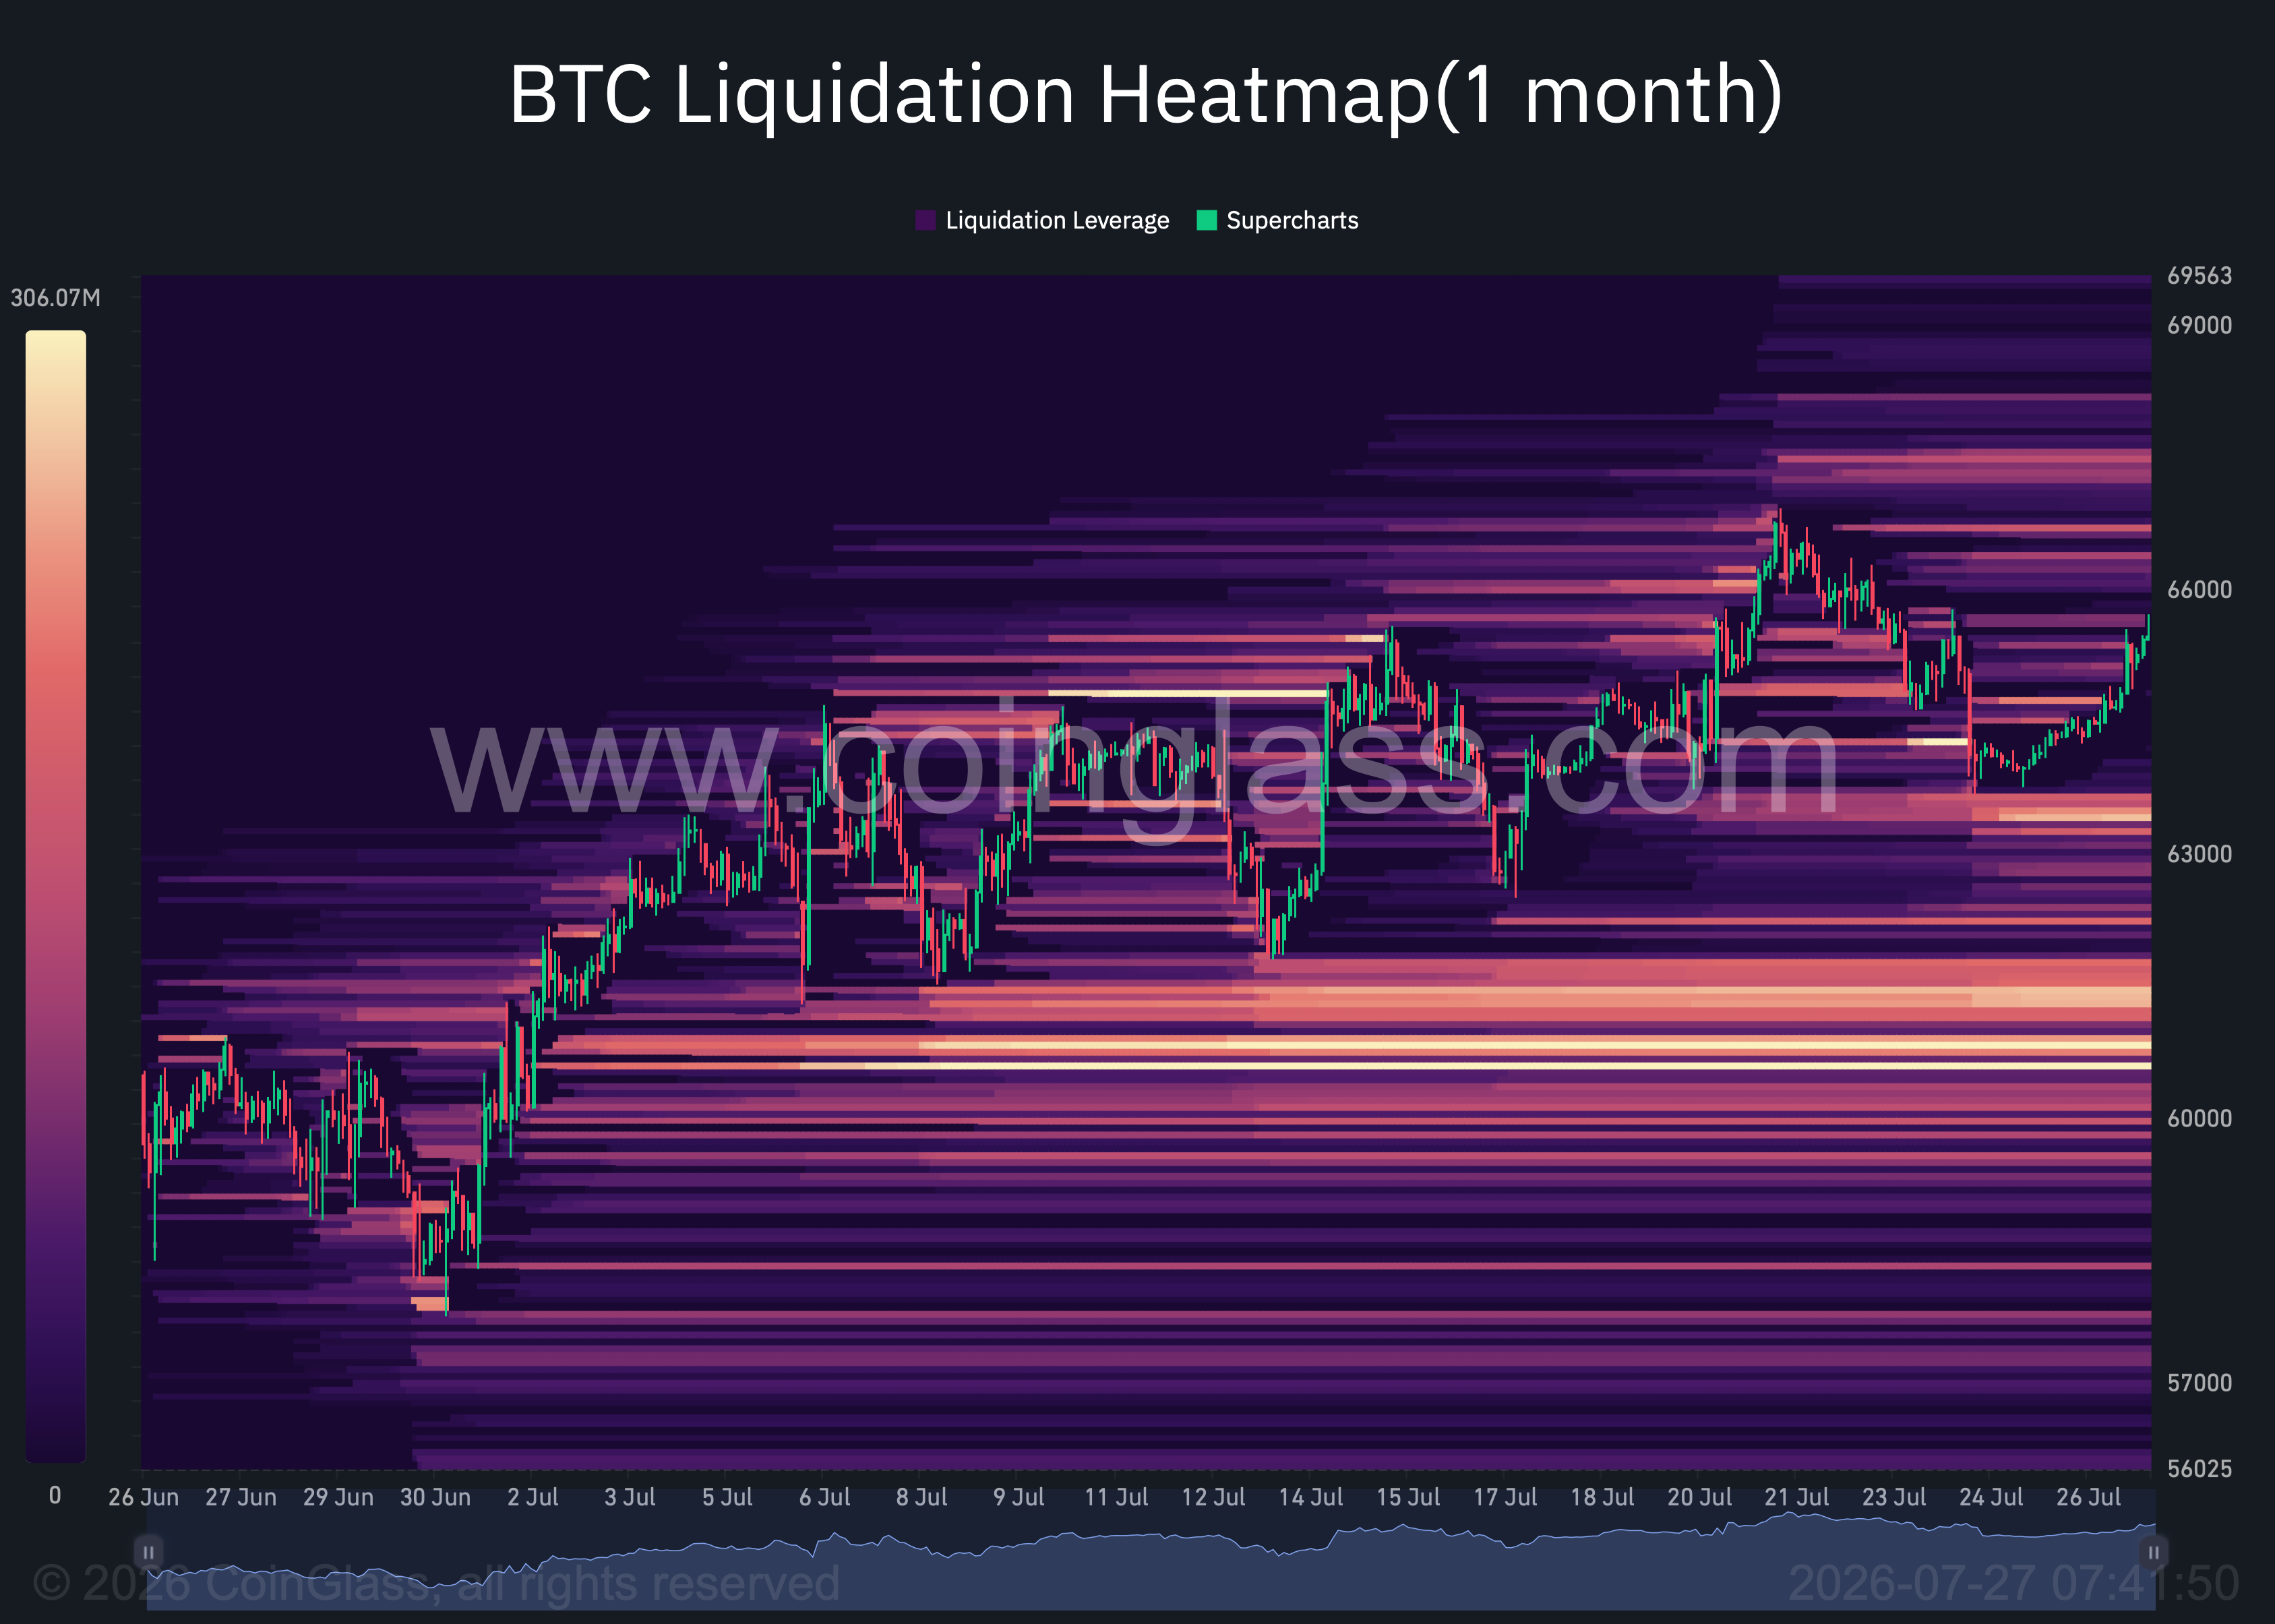
For context, liquidity clusters often act as a magnet, pulling price toward them, and that possibility remains in play here, with price potentially getting dragged down to fill the buy orders in this zone before resuming its upward rebound.
Nothing guarantees this outcome yet, particularly when weighing the losses short and long traders absorbed over the past day.
Short liquidations amounted to $35.56 million against $3.03 million in long positions, an 11.7-times gap that underscores how much weight long traders carry on Bitcoin at the moment.
Bitcoin sentiment remains long
The Funding Rate, which gauges whether investors are largely financing long or short contracts based on available capital, shows the bulls in control. At the time of writing, the Funding Rate climbed to 0.0067%, signaling that bulls are dominating the market.
For context, this confirms the majority of the $48.34 billion in open positions leans heavily toward the long side, as traders anticipate a short-to-near-term upswing in price.

Additionally, the Long/Short Ratio stood at roughly 1.04, pointing to growing long volume in Bitcoin’s perpetual market that could sustain the run. Therefore, with ratios on these venues sitting well above 1, the data confirms long exposure that could help the price scale higher.
Bitcoin whale accumulation and scarcity
Bitcoin is growing scarcer, especially as whale influence across the market continues to expand.
According to one report, a massive whale accumulation of slightly more than 3,000 Bitcoin, worth $198 million at the time, coincided with Bitcoin’s stock-to-flow ratio, an indicator measuring scarcity relative to supply and annual issuance, spiking over 350% in the past day.
An increment of this kind implies growing scarcity is driving the asset further up the chart, shaped by the influence of key players including Bitcoin miners, who have sold less Bitcoin than their one-year average.
Final Summary
- BTC short liquidations outpaced longs by nearly 12 times over the past day.
- Bitcoins’ liquidity clustered around $60,000 to $61,500 could pull the price lower to fill buy orders before any sustained rebound.