What Is MACD, and How to Use It in Crypto Trading?
This guide will demystify the MACD Indicator, break down its components, and reveal how you can harness its power to make informed decisions in the ever-evolving cryptocurrency market.
Welcome to the exciting world of cryptocurrency trading! As you dive into this digital realm, you'll quickly realize that having the right tools and strategies is crucial for success. One such tool that has gained immense popularity among traders is the MACD Indicator. But what exactly is this mysterious acronym, and how can it help you navigate the volatile waters of crypto trading?
Following the RSI and Stochastic RSI on KuCoin Learn, the MACD is the next handy indicator. The Moving Average Convergence Divergence (MACD) indicator is a momentum oscillator well-known for producing powerful trading signals. It is widely used in cryptocurrency, forex, commodity, and stock trading. Traders prefer this indicator over others because it uses moving averages (MAs) to define momentum. It is often used in trading strategies to help determine the trend of a specific asset.
Traders use a variety of technical indicators from their toolkits to anticipate or find profitable trading signals. Typically, traders will combine three or four indicators to confirm the signal they have generated, and if confirmed, they enter the trade. However, before combining indicators, we must first understand how they work.
What Is MACD (Moving Average Convergence Divergence)?
The MACD is an oscillator and stands for Moving Average Convergence Divergence. It is an indicator that follows the trend and tells us whether it will vary in the future. It compares the direction of the short-term price momentum with the long-term price momentum to provide robust trading signals. MACD belongs to a group of oscillator-type indicators known for defining an asset's or cryptocurrency's momentum and predicting possible trends.
The Moving Average Convergence Divergence indicator tracks the trend of an asset and displays the trend's momentum and the connection between two moving averages. It is a momentum indicator that gives you an insight into how overbought and oversold the specific asset is and shows the inconsistencies between the moving averages.
This indicator was developed in 1979 by Gerald Appel, who invented it to help traders calculate the strength, length, direction, and momentum of the price of a given asset.
Calculation of MACD Indicator
Nowadays, you can easily apply the technical indicators on price charts to interpret them and generate trading signals. However, to learn what MACD does, we must go through the mathematics of the formula.
MACD = 12 Period EMA – 26 Period EMA
As we can see, the formula for calculating MACD is simple and only needs to subtract the 26-period exponential moving average from the 12-period exponential moving average.
If you don’t know what EMA is, check out our in-depth analysis of what EMA is and how to use it in crypto trading.
How to Read MACD
Four components of MACD appear on the price chart when it is applied, namely:
- MACD Line
- Signal Line
- Zero Line
- Histogram
MACD Line: It is calculated using the abovementioned formula, where 26-EMA is subtracted from 12-EMA. Exponential moving averages increase the sensitivity to changes in trends and the momentum of a given asset's price.
Signal Line: The signal line is a 9-period EMA by default. Crossing the MACD line and the signal line is used to find convergence, divergence, and trading signals. You can combine them to find entry and exit levels or reversal points.
Zero Line: The straight zero line represents that MACD equals zero here. It means that the 26-EMA and the 12-EMA are both the same.
Histogram: The histogram symbolizes the difference between the signal and MACD lines. The histogram is positive when the MACD line is above the signal line and negative when the signal line is above the MACD line. A histogram is a graphical representation of the convergence and divergence of the MACD and signal lines.
MACD is an oscillator indicator, but unlike other indicators from this group, like RSI, MACD does not have an absolute range. Other oscillator indicators have a maximum and minimum range, so they are suitable for defining an asset's overbought and oversold conditions. However, MACD is inappropriate for such a calculation, as its value is not confined to a range.
How to Apply MACD Indicator to KuCoin Charts
Here's how you can add the MACD to the chart on the KuCoin Trading page:
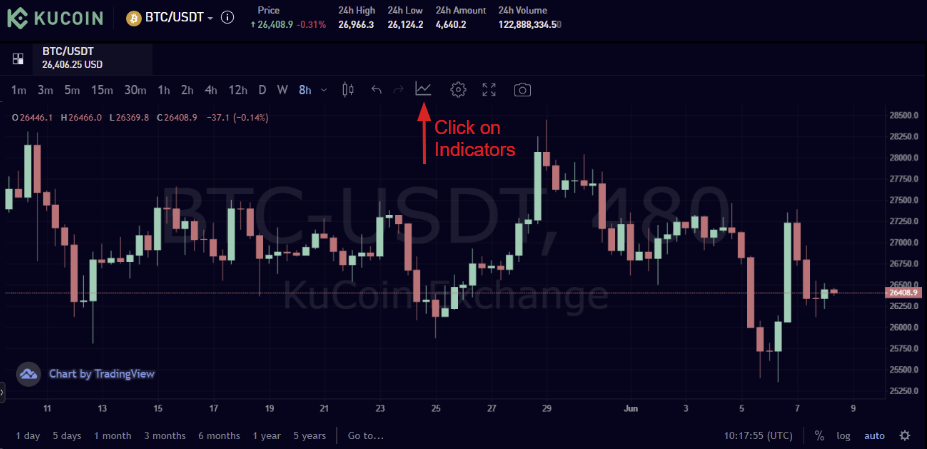
Step 1: Choose Indicators
Choose the indicator from the options in the KuCoin trading chart, as shown below.
Step 2: Search For MACD Indicator
Type MACD in the search bar, and the MACD indicator will appear on a list of indicators in the search list.
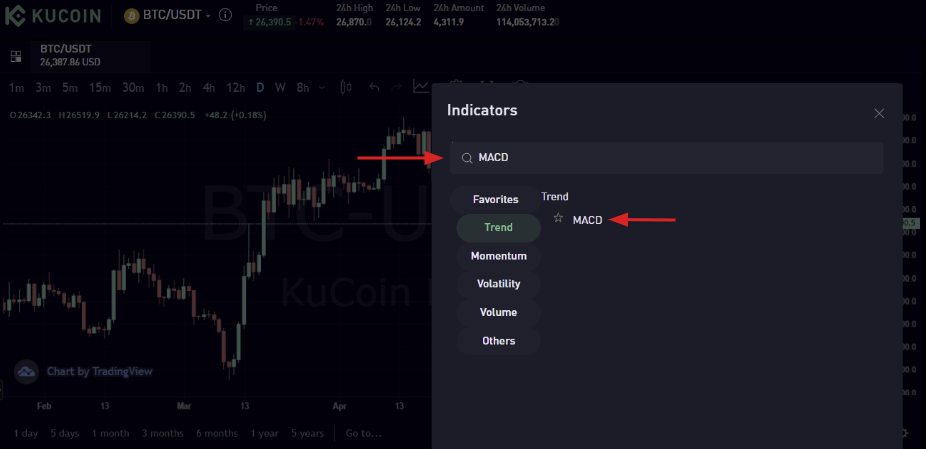
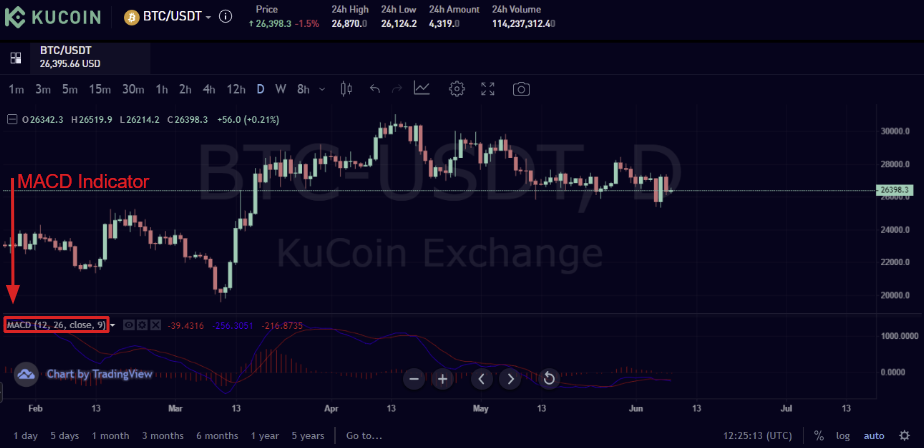
Step 3: Select MACD From Momentum Indicators
Choose the MACD from the list of momentum indicators, and it will be automatically applied to your chart.
How to Use MACD in Crypto Trading
We have gathered data on the following trading strategies, which include using MACD to forecast trading signals in the cryptocurrency market. As we all know, cryptocurrency investment can be extremely risky, and you require some assurance before making a move, so you perform technical analysis before opening a trade position. The MACD indicator is a popular and preferred technical indicator among cryptocurrency traders because it produces stronger signals than other indicators.
Let's look at how you can use MACD in your trading strategies!
MACD and Signal Line Crossover
The most basic and widely used MACD trading strategy is to look for a bullish or bearish signal at the crossover of the MACD line and the signal line. The rule is simple: whenever the MACD line crosses above the signal line, it is a bullish signal.
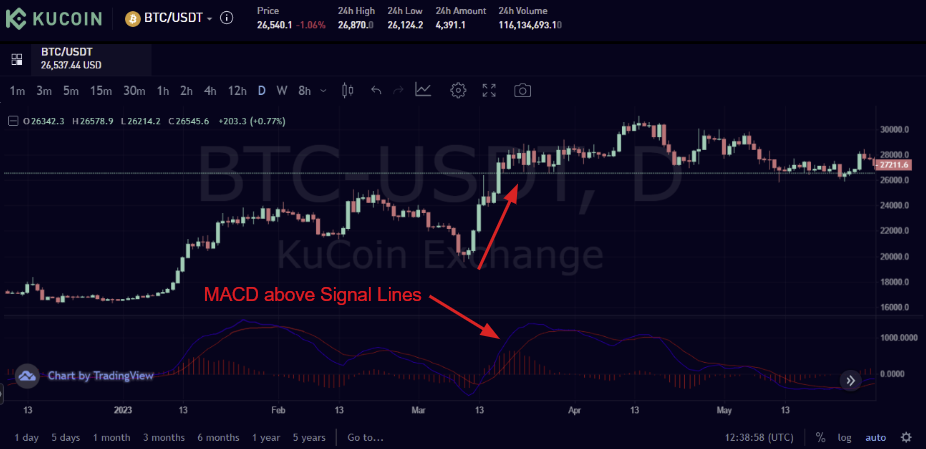
It is a bearish signal when the signal line crosses the MACD line from above.
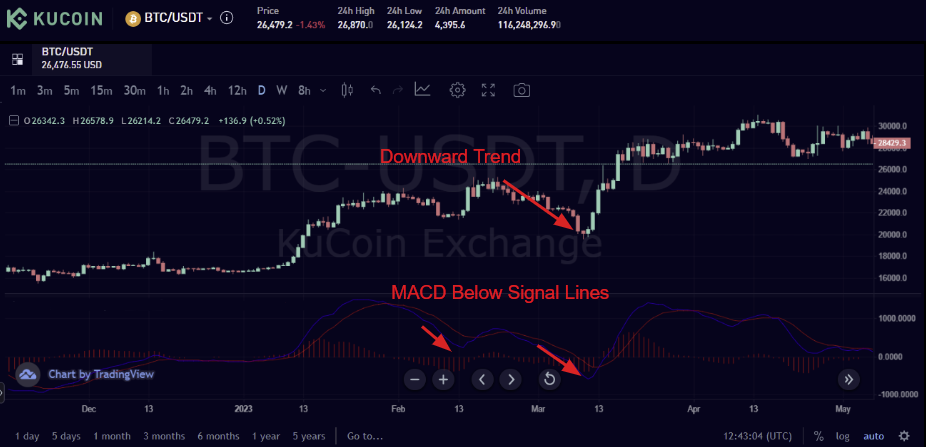
However, even though the crossover occurs only infrequently, these signals can be false most of the time. This is why it is recommended that you do not rely on a single trading strategy or technical indicator but rather have at least 2-3 in your toolbox to confirm your signal before applying it to live trade.
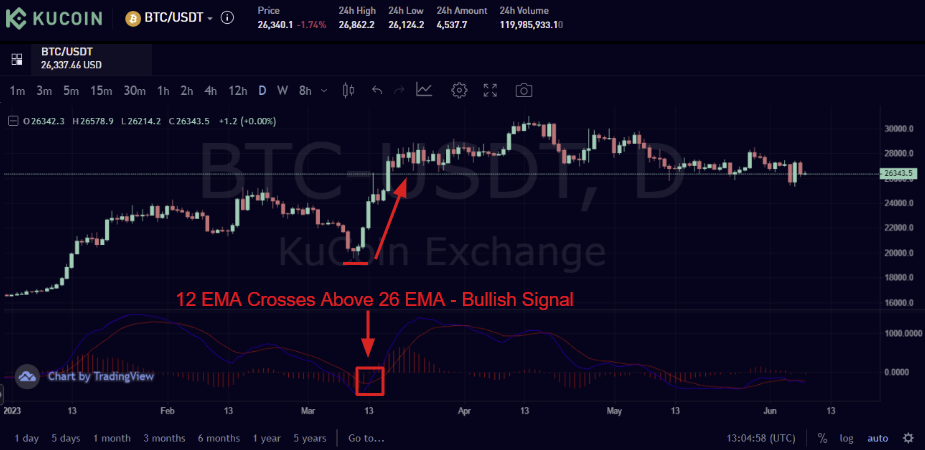
MACD and Zero Line Crossover
This type of trading strategy involves discovering the momentum of the price of a given asset. The centerline or zero-line crossover can provide an idea of the upcoming trend in the market. For instance, when the MACD line touches the zero line from below and reaches above the centerline, MACD is positive. Furthermore, it indicates that the 12-EMA is higher than the 26-EMA.
Whenever the MACD line crosses the zero line from above and reaches below the centerline, the MACD is negative, and 26-EMA is higher than 12-EMA.
The positive MACD specifies that there are odds that the price will move upward, while the negative MACD represents a strong downside momentum building. So, you can open long positions when MACD turns positive and take short positions when MACD turns negative.
MACD Divergences
MACD's divergence rules are also the same. For instance, a divergence occurs when the price of a cryptocurrency moves in the opposite direction of the MACD line. Similarly, the MACD divergence indicates a trend reversal for a specific cryptocurrency.
Divergences are classified into MACD Bullish Divergence and MACD Bearish Divergence.
MACD Bullish Divergence
Two conditions cause a MACD bullish divergence:
- When the price of cryptocurrency prints higher lows while the MACD line prints lower lows.
- When the price of a cryptocurrency makes lower lows while the MACD makes higher lows simultaneously.
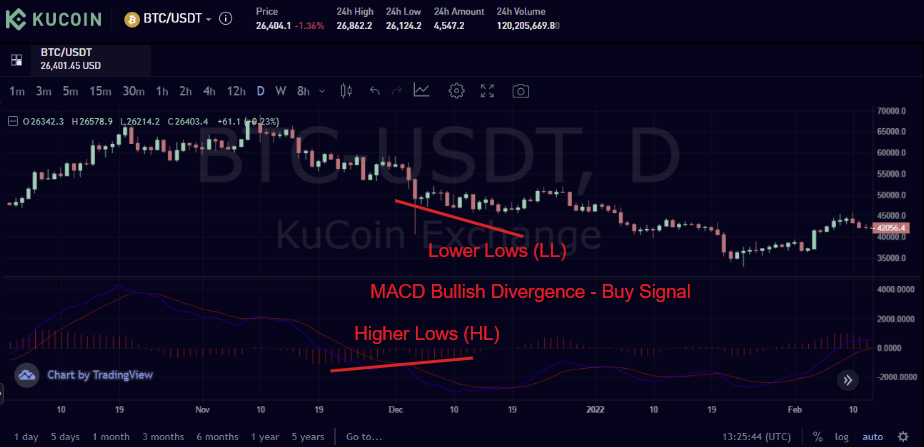
Such conditions indicate that a cryptocurrency's price is losing momentum, and a possible reversal is coming. When MACD bullish divergence develops at the end of a downtrend, an ideal reversal signal can be easily generated to take a position in the market. The bullish MACD divergence provides an excellent buy signal.
MACD Bearish Divergence
Similar to bullish divergence, bearish divergence in MACD is also caused by two conditions:
- When the price of a cryptocurrency reaches higher highs while the MACD reaches lower highs simultaneously.
- When the price of a cryptocurrency reaches lower highs while the MACD reaches higher highs simultaneously.
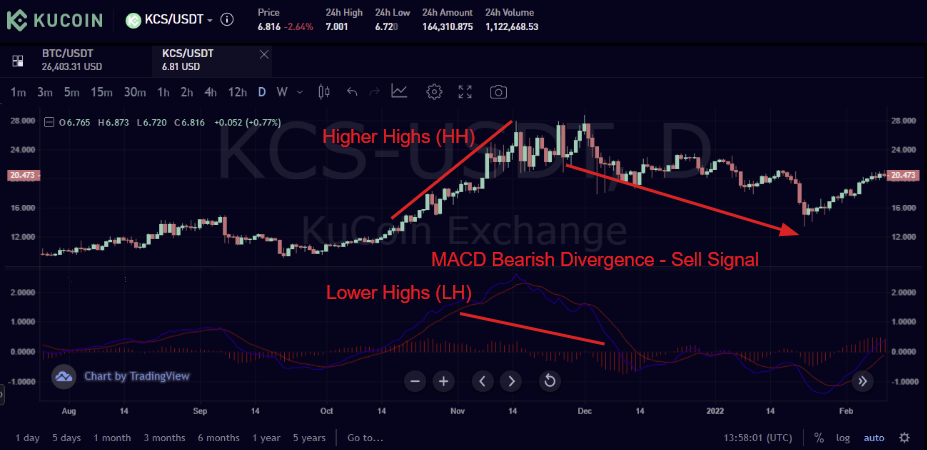
A divergence occurs when MACD does not confirm price momentum and continues to move in the opposite direction. A bearish divergence indicates that the cryptocurrency is about to reverse its trend, which you can interpret as a strong sell signal.
MACD vs. RSI
Undoubtedly, MACD is the most popular technical indicator among cryptocurrency traders. However, the Relative Strength Index (RSI) is another important and widely used indicator. You can use both indicators simultaneously to generate even stronger trading signals. So let's take a look at how they differ from one another.
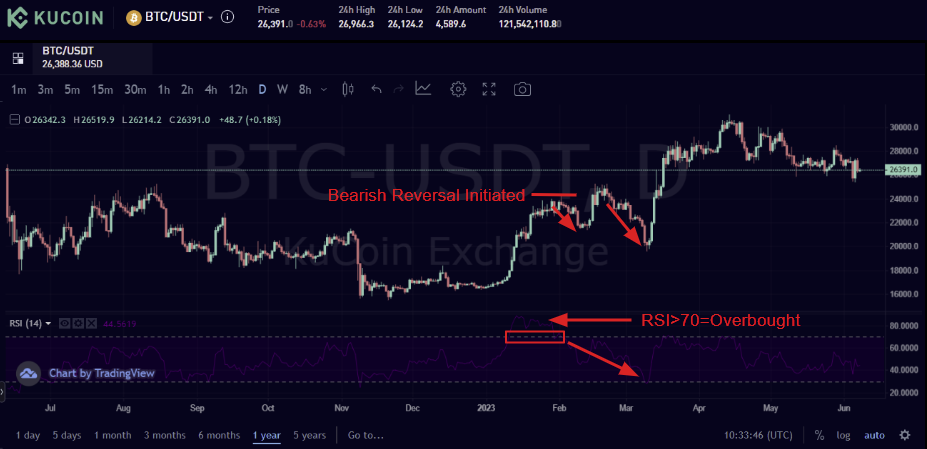
The RSI indicator provides a value between 0 and 100. Any value below 30 is considered oversold, and above 70 is deemed overbought. If the RSI is above 70, the cryptocurrency is overbought, and a trend reversal is possible, providing a selling opportunity. Similarly, if the RSI falls below 30, the given cryptocurrency has been oversold, and a buying opportunity awaits.
MACD, on the other hand, measures the distance between the 26-EMA and the 12-EMA. It is also used to determine the market's trend and find a trend reversal. However, it could be more suitable for generating overbought and oversold cryptocurrency levels.

Because RSI and MACD use different approaches to generate buy and sell signals, they can sometimes produce opposite signals. As a result, most experienced traders combine these indicators to generate a stronger signal.
Conclusion
The Moving Average Convergence Divergence (MACD) indicator is a powerful ally for cryptocurrency traders, offering valuable insights into trend reversals and price momentum. However, relying solely on MACD-generated signals can lead to suboptimal trades. To mitigate this risk, savvy traders combine MACD with additional technical indicators, such as RSI and stochastic RSI, to confirm and validate their signals.
By skillfully integrating the MACD indicator into your trading strategy, you can identify lucrative entry and exit points, anticipate potential price reversals, and navigate the dynamic cryptocurrency market with confidence. But remember, the key to success lies in corroborating your MACD-generated signals with other indicators to minimize false signals and maximize your trading potential. So, embrace the power of the MACD indicator and elevate your crypto trading skills to the next level!
Disclaimer: The information on this page may come from third parties and does not necessarily reflect KuCoin’s views. It is provided for general reference only and should not be interpreted as financial or investment advice.
Virtual asset investments may involve risk. Please carefully assess the product risks and your own risk tolerance. For more information, please refer to our Terms of Use and Risk Disclosure.