What Is RSI, and How to Apply It to Crypto Trading?
Discover RSI in crypto trading! Learn what Relative Strength Index is, how it works, and master its application for profitable trades.
The RSI stands for Relative Strength Index, one of the most popular momentum oscillators. The RSI holds popularity among professional traders due to its effectiveness in providing the rate of speed of an asset's price movement. It is used by cryptocurrency traders and is regarded as one of the best technical indicators in cryptocurrency trading and other types of financial trading.
When newbie trader starts learning about technical analysis, they prefer to start their learning process with this indicator. The reliable indicator measures an asset's momentum and exhibits if the market price is overbought or oversold. You can use this indicator to build a profitable trading strategy.
The following guide will teach you everything you need to know about RSI and how to use it when trading cryptocurrency with KuCoin.
What Is RSI (Relative Strength Index)?
Most crypto traders rely on technical analysis to predict future price movements. They perform the analysis using different kinds of technical indicators available in the market. Apart from the news and economic figures, the prices of financial assets, including forex, commodities, stocks, bonds, and cryptocurrencies, are also affected by market trends.
The prices of financial instruments and crypto assets tend to move in a specific trend or pattern. These patterns and trends can be predicted through technical analysis of price charts. However, most indicators use historical price data to anticipate future price movements.
The Relative Strength Index is also a type of technical indicator that falls under the category of momentum oscillators or indicators, which provides knowledge about whether the market is overbought or oversold.
The RSI was initially made in 1978 by J. Welles Wilder. The outcome of this indicator comes on a scale between 0 and 100. It evaluates the price change of a specific asset over a default 14-period timeframe, which can be changed as per your needs.
RSI can also be measured over time, such as weeks, days, hours, and even minutes. Moreover, it's so popular that every trading or cryptocurrency exchange or platform provides access. The RSI is computed automatically by an oscillator indicator, and you only need to analyze the value to take appropriate action.
How to Apply RSI Indicator to KuCoin Charts
Here's how you can add the RSI to the chart on the KuCoin Trading page.
Step 1: Choose Indicators
Choose an indicator from the options in the chart below.

Step 2: Search For RSI Indicator
Type Relative Strength Index in the search bar, and the RSI indicator will appear on a list of indicators in the search list.

Step 3: Select RSI From Momentum Indicators
Choose the Relative Strength Index from the list of momentum indicators, and it will be automatically applied to your chart.

How to Calculate RSI
The formula for measuring Relative Strength Index (RSI) is very simple:
RSI = 100 – [100/ (1 + RS)]
Where:
- RS = Average Gain / Average Loss
- Average Gain = sum of gain per period/time frame
- Average Loss = sum of loss per period/time frame
The Relative Strength (RS) is the average of upward and downward price changes over a given time period. The RSI's result/value falls between 0 and 100, indicating that the indicator is an oscillator.
The RSI timeframe on available platforms is set to 14 by default. It means that applying RSI indicators to a daily chart will consider the data from the previous 14 days; when you apply it to a weekly chart, it will consider the data from the previous 14 weeks.
On the other hand, custom settings allow you to change the value based on your needs and strategy.
How to Read RSI
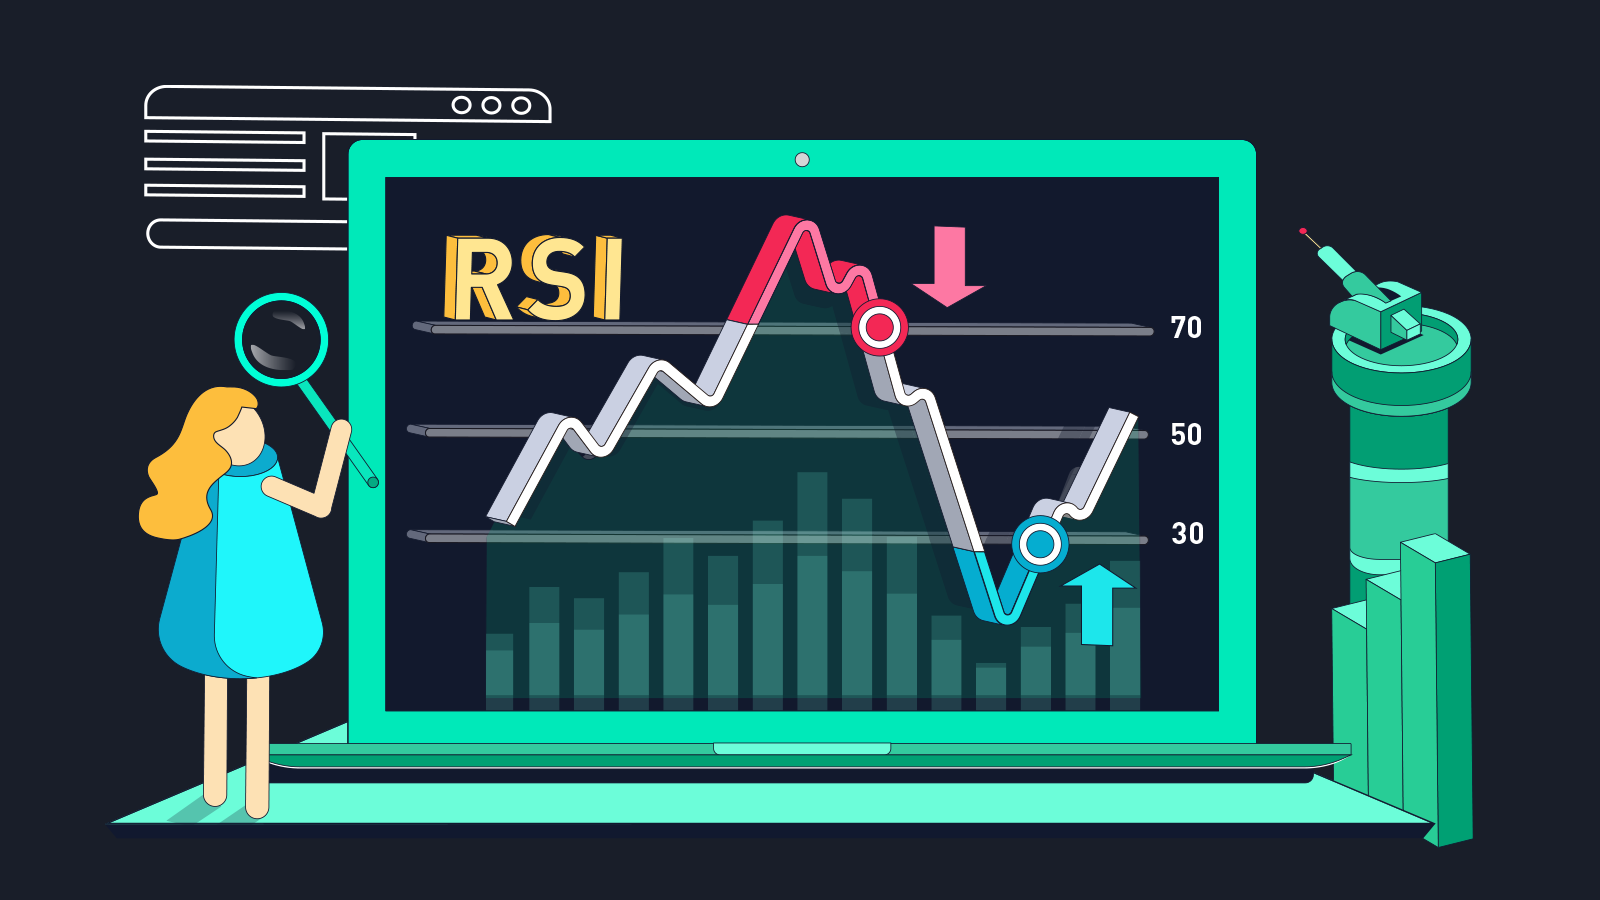
The Relative Strength Index (RSI) provides insight into the situation of an asset, whether and how much it is oversold and overbought. For instance, if the value of the RSI falls below 30, the asset is flashing an oversold signal. Similarly, if the RSI exceeds 70, the asset is in overbought territory.
Sell Signal: Overbought RSI Indicator
When the Relative Strength Index rises above 70, the underlying asset's value rises but could reverse or fall at any time. Take a look at the Bitcoin chart shown below. The RSI value rose above 70, prompting investors to enter the market and initiate a bearish trend.

Buy Signal: Oversold RSI Indicator
On the flip side, if the RSI falls below 30, the asset is decreasing in value and could reverse or move on the upside.

Reading the RSI is not that difficult. That is why people first choose this indicator when learning technical analysis. However, you must remember that, like many other indicators, the RSI can also provide false alarms. Therefore, you must learn to recognize when the indicator is giving a good signal and providing a bad call.
A good trader doesn't just use one indicator to predict how the price will move in the future. Instead, he or she looks at many different indicators to make a good prediction.
Another exciting thing about RSI is that you can get an idea about the rate of speed of an asset’s price movement, but you can also look for solid signals like convergence and divergence.
Finding Moving Average Convergence and Divergence Through the RSI
First, we need to learn about these terms to understand them better. Convergence and divergence are popular terms in technical analysis. They can help you discover the market's possible future direction.
Convergence
Convergence is when an asset's price and RSI's value move in the same direction. In technical terms, when the price of an asset provides a lower high or lower low, and the value of the RSI indicator offers a higher high or higher low simultaneously, it is said to be convergence.
Divergence
Divergence is a situation in which the price of an asset moves in the opposite direction to the value of the RSI. In technical terms, divergence occurs when the price of an asset is given a higher high or higher low, and the RSI value gives a lower high or lower low at the same time.
Convergence and Divergence: Explained
To understand and analyze these concepts, imagine a market moving at its peak. The price of an asset retraces slightly but reaches a new high. However, the technical indicator RSI is indicating less strength in the meantime.
It's the same as in the real world; when the price of something rises, the number of people buying it decreases. As a result, the salesman is forced to lower the price to attract new buyers. Similarly, the low strength of the RSI in a technical analysis indicates fewer buyers in the market while the price of an asset is moving higher. Therefore, you can predict that the bullish trend in the market will reverse or that the price could go down.
The same rule applies to the opposite movement of the price when prices are moving downwards, whereas the RSI shows strength, which means the price is likely to move higher. While determining the convergence and divergence points, you must look for signs that the price will change and then bet on the expected change.
How to Apply RSI in Crypto Trading
Before using the Relative Strength Index in crypto trading, you should understand that strong signals are generated on higher timeframes. It means that when the RSI indicator is applied to a 4-hour chart, the signal generated is stronger than when applied to a 15-minute chart.
In other words, when applying the RSI indicator, you may see a bullish divergence on a 15-minute chart but not on a 1-hour one. Another important consideration is to keep the RSI settings at 14 because this is the standard size. Numerous digital asset trading strategies use the RSI to generate trade signals.
Let's look at how RSI calculations can be used to forecast the future of trading.
Finding Overbought & Oversold Signals
Using a single indicator to generate a trading signal can be risky and not advised. You must use a mixture of technical indicators to confirm the one signal provided by a single indicator.
You can go for that trade after confirming the signal from various indicators. You can use the RSI to find the overbought and oversold levels in the market. However, it can be risky as the market can keep moving in the same direction after hitting the oversold or overbought level.
Using the RSI indicator to define these levels can give you an insight into the market situation, which can be useful for making a final decision after receiving further confirmation from different indicators.
Bullish and Bearish Divergence & Convergence
Trading cryptocurrency based on divergence and convergence can be interesting as it gives deep insight into the market and helps generate strong signals. The phenomenon where the price chart of crypto is rising and showing bullish momentum, but the RSI value is moving on the downside, is known as bearish divergence.
RSI values give us a warning that the bullish trend of crypto is going to be weak or end in the near future. You can find these divergences and start opening positions in the market accordingly.
Similarly, bullish/bearish convergence can also be found in the price chart of a cryptocurrency to make bets on the future price momentum of the crypto.
One thing to remember about divergence is that it usually occurs at the end of a trend. In this case, price lines are used in conjunction with the RSI indicator to determine whether a price chart is overbought or oversold. Typically, the price does not move in the opposite direction immediately after the signal appears on the chart, so the price lines are adjusted to avoid gaps.
Using the Relative Strength Index, you can generate fewer trade signals if he sets the overbought and oversold levels to 80 and 20 instead of 70 and 30. The price lines will lengthen, allowing for more reliable trading signals.
Conclusion
The Relative Strength Index (RSI) is widely regarded as the best technical indicator, particularly for day and swing traders. The indicator lets you see what is happening in the market and hints at making appropriate decisions.
The RSI crypto indicator aids in determining market conditions by indicating whether crypto is overbought or oversold. Furthermore, it can help detect market divergence and convergence, which is incredibly helpful for swing traders.
Calculating RSI is simple; you can find it for free on almost every crypto trading platform. Although a widely used technical indicator, it is not recommended for making price predictions solely based on RSI. However, combining RSI with indicators such as Stochastics, MACD (moving average convergence divergence), and trend lines increases synergy.
A successful trader should not rely on a single indicator but ensure that the signals generated by different indicators point in the same direction. As a result, there are fewer chances of losing a trade and more chances of profiting.
Disclaimer: The information on this page may come from third parties and does not necessarily reflect KuCoin’s views. It is provided for general reference only and should not be interpreted as financial or investment advice.
Virtual asset investments may involve risk. Please carefully assess the product risks and your own risk tolerance. For more information, please refer to our Terms of Use and Risk Disclosure.