


How to Use Fibonacci Retracement for Crypto Trading: A Complete Guide for 2026
2026/05/18 07:03:02
Introduction
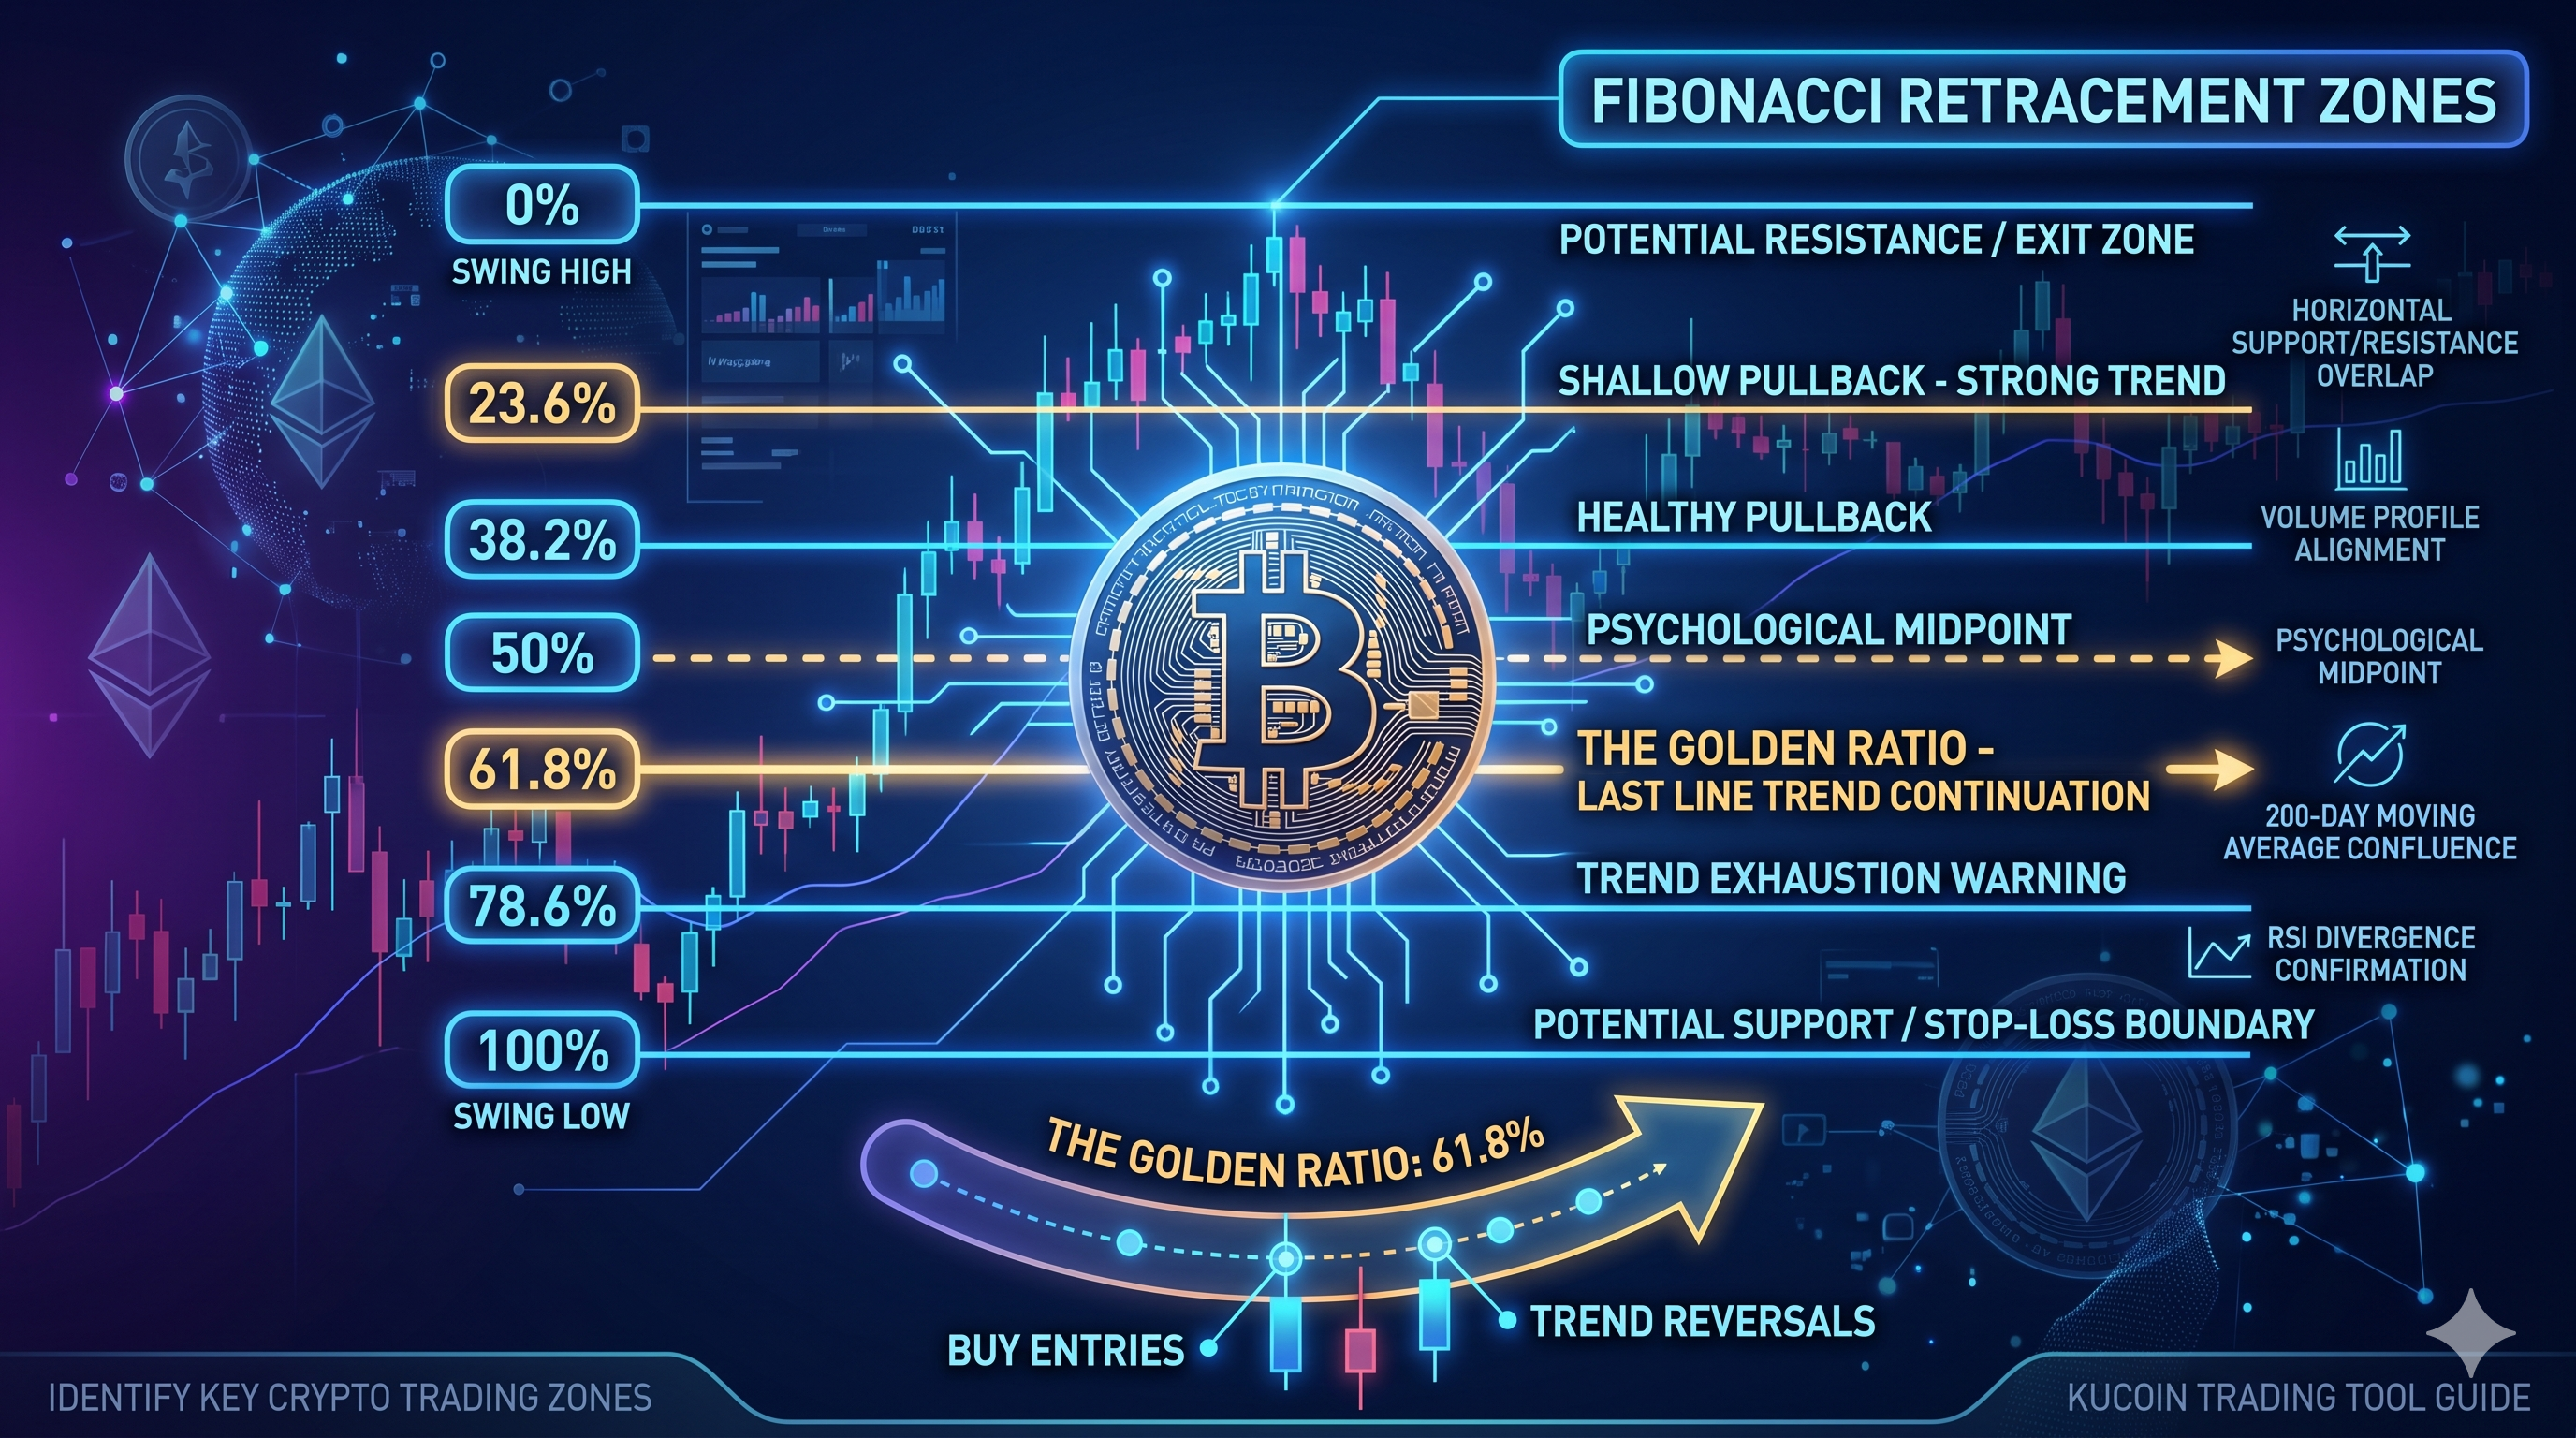
Over 70% of professional crypto traders incorporate Fibonacci retracement levels into their technical analysis toolkit, according to a 2026 TradingView survey of active derivatives traders. This centuries-old mathematical sequence has become indispensable for identifying support and resistance zones in volatile cryptocurrency markets, where price swings of 10-20% in a single day are routine. Fibonacci retracement works by plotting horizontal lines at key percentage levels — 23.6%, 38.2%, 50%, 61.8%, and 78.6% — between a significant high and low, helping traders anticipate where reversals or continuations might occur.
This guide explains exactly how to draw Fibonacci retracements on crypto charts, interpret the levels, combine them with other indicators, and avoid the most common mistakes. Whether you trade Bitcoin, Ethereum, or altcoins, mastering this tool can sharpen your entries, exits, and risk management decisions.
What Is Fibonacci Retracement in Crypto Trading?
Fibonacci retracement is a technical analysis tool that identifies potential support and resistance levels by measuring the distance between a price high and low using ratios derived from the Fibonacci sequence. The tool helps traders predict where an asset's price might pause, reverse, or resume its trend after a pullback.
The Fibonacci sequence — 0, 1, 1, 2, 3, 5, 8, 13, 21, 34, 55, 89 — was introduced to Western mathematics by Leonardo of Pisa in 1202. The key ratios used in trading come from dividing numbers in the sequence: 61.8% (the "golden ratio"), 38.2%, and 23.6%. The 50% level isn't technically a Fibonacci ratio but is included because markets often retrace half of a prior move.
Why Fibonacci Levels Matter in Crypto Markets
Crypto markets respect Fibonacci levels because of self-fulfilling prophecy and natural market psychology. When thousands of traders watch the same 61.8% retracement level on Bitcoin's daily chart, their collective buy and sell orders cluster around that price — creating actual support or resistance.
Cryptocurrencies are particularly suited to Fibonacci analysis because they trade 24/7 with high liquidity on major pairs, producing clean trend structures. According to CoinGecko's Q1 2026 market report, Bitcoin and Ethereum spot markets generated over $1.2 trillion in combined monthly volume, providing the depth needed for technical levels to hold meaningfully.
How Do You Draw Fibonacci Retracement on a Crypto Chart?
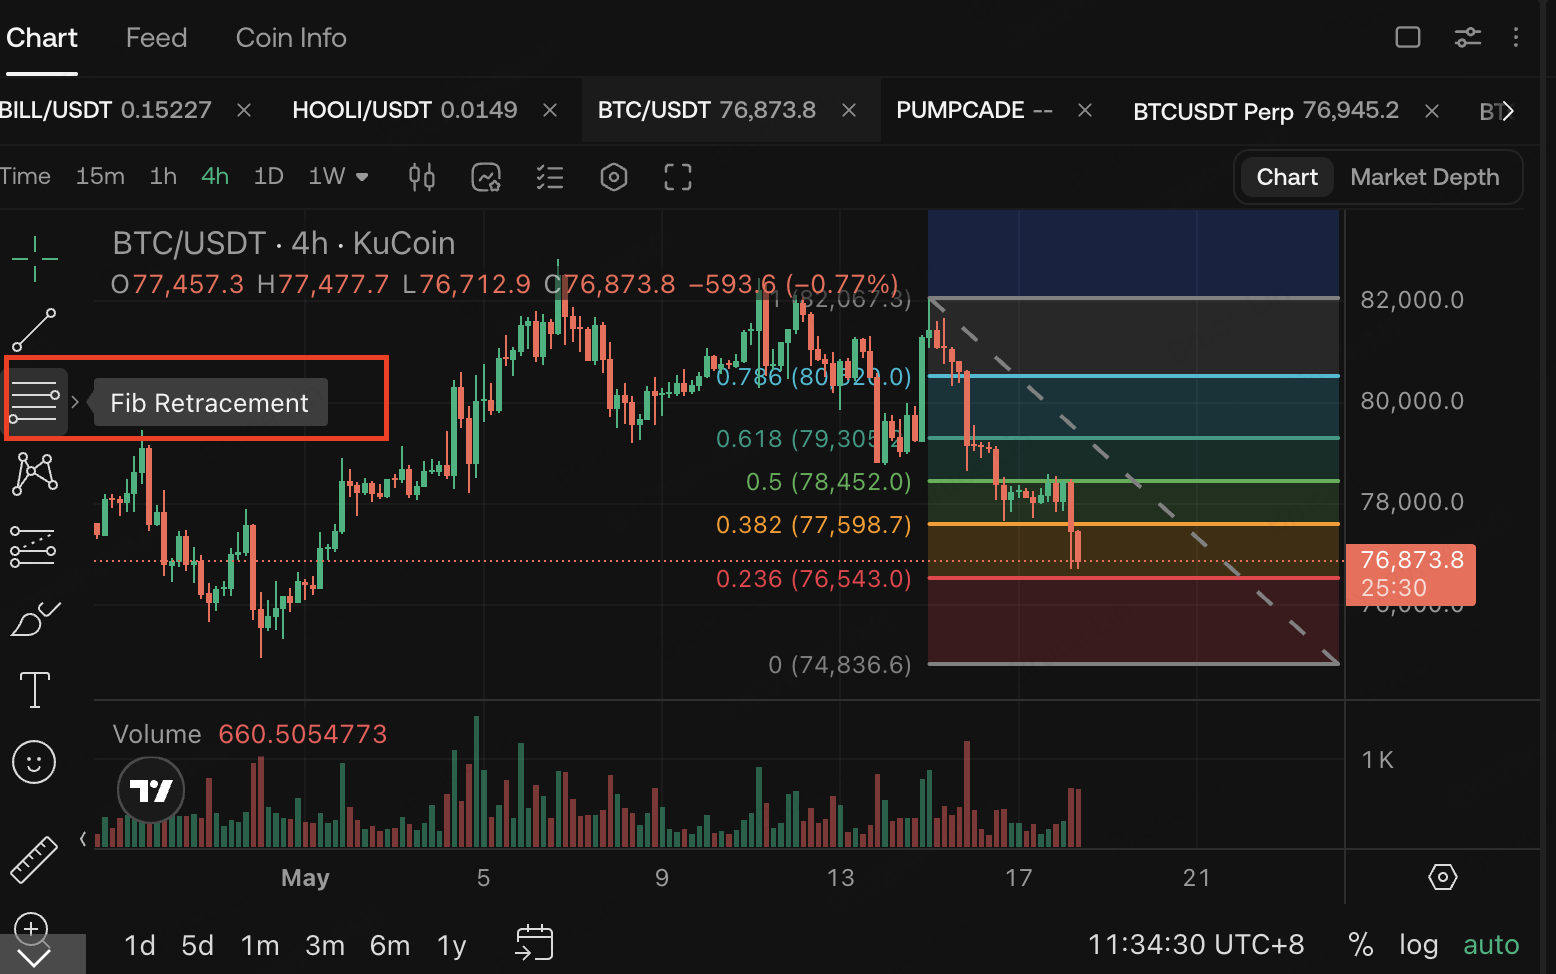
Draw Fibonacci retracement by selecting the Fib tool on your charting platform, for example, on KuCoin, clicking on a significant swing low, and dragging to a significant swing high — or vice versa for downtrends. The platform automatically plots horizontal lines at the standard retracement levels between those two points.
Step-by-Step Drawing Process
Step 1: Identify the trend direction. Look at a higher timeframe — typically the 4-hour or daily chart — to determine whether the asset is in an uptrend or downtrend. Fibonacci retracement only works within a clearly defined trend.
Step 2: Locate the swing high and swing low. For an uptrend, find the lowest low before the rally began and the highest high before the pullback started. For a downtrend, reverse the order.
Step 3: Apply the Fibonacci tool. On KuCoin's charting interface or TradingView, click the Fib retracement icon, then click the swing low first and drag to the swing high for uptrends. The 0% line will sit at the high, and 100% at the low.
Step 4: Analyze the levels. Watch how price reacts at each retracement zone. The 38.2%, 50%, and 61.8% levels are the most actionable for entries.
Common Drawing Mistakes to Avoid
Drawing from the wrong swing points produces useless levels. Many beginners pick minor highs or lows instead of the most extreme points of the move, leading to retracement zones that price ignores. Always anchor your Fib tool to the most prominent swing points visible on the chart.
What Do the Fibonacci Retracement Levels Mean?
Each Fibonacci retracement level represents a different probability and depth of pullback within a trend. Shallow retracements (23.6%, 38.2%) suggest strong trend momentum, while deeper retracements (61.8%, 78.6%) indicate weakening momentum but still valid trend continuation zones.
|
Fibonacci Level
|
Interpretation
|
Typical Use Case
|
|
23.6%
|
Shallow pullback, very strong trend
|
Aggressive trend-following entries
|
|
38.2%
|
Moderate pullback, healthy trend
|
Standard pullback entries
|
|
50%
|
Psychological midpoint
|
High-probability reversal zone
|
|
61.8%
|
Golden ratio, deep pullback
|
Last-line trend continuation
|
|
78.6%
|
Very deep retracement
|
Trend exhaustion warning
|
The Golden Ratio: Why 61.8% Is the Most Important Level
The 61.8% level is the most-watched Fibonacci zone because it derives from the golden ratio found throughout nature and mathematics. When Bitcoin or Ethereum retraces to this level during an uptrend and holds, it often signals that the broader trend remains intact — making it a high-conviction entry point for swing traders.
If price breaks through 78.6% with strong volume, the original trend is likely invalidated. Many traders treat the 78.6% level as a stop-loss boundary rather than an entry zone.
How to Use Fibonacci Retracement to Enter and Exit Trades
Use Fibonacci retracement levels as entry zones during pullbacks in a trending market, with stop-losses placed just beyond the next deeper level. The most reliable setups occur when a Fib level aligns with other technical signals — confluence is what separates winning trades from random entries.
Entry Strategy for Uptrends
Wait for price to pull back into the 38.2%-61.8% retracement zone after a clear impulse move higher. Place a limit buy order at the 50% or 61.8% level. Confirm the entry with bullish price action — such as a hammer candle, bullish engulfing pattern, or RSI bouncing from oversold on a lower timeframe.
For example, if Bitcoin rallies from $58,000 to $72,000, the 61.8% retracement sits at approximately $63,348. A long entry at this level with a stop below $61,000 (just under the 78.6% level) offers a defined risk setup.
Entry Strategy for Downtrends
Short into the 38.2%-61.8% retracement zone after a strong move lower. The same confluence principles apply — look for bearish candlestick patterns, declining volume on the pullback, or rejection from a prior support-turned-resistance level.
Setting Stop-Losses and Profit Targets
Place stop-losses just beyond the 78.6% level for trend-following entries. If price breaks that zone, the trend structure is broken and the trade thesis is invalid.
For profit targets, use Fibonacci extension levels — 127.2%, 161.8%, and 261.8% — which project beyond the original swing high. Many traders take partial profits at the prior swing high (100% level) and let the rest run to the 161.8% extension.
How Do You Combine Fibonacci Retracement With Other Indicators?
Combine Fibonacci retracement with moving averages, RSI, volume profile, and horizontal support/resistance for the highest-probability setups. A single Fib level in isolation has roughly 50-50 odds — but when three or more indicators converge at the same price, win rates can climb substantially.
Fibonacci Plus Moving Averages
The 200-day moving average frequently aligns with the 61.8% retracement during major corrections. When Bitcoin pulled back during the early 2026 consolidation, the 200-day MA sat within 2% of the 61.8% Fib level on the weekly chart, creating a powerful confluence zone that held for weeks.
Fibonacci Plus RSI Divergence
Watch for bullish RSI divergence — where price makes a lower low at a Fib level but RSI makes a higher low — to confirm reversal setups. This combination is particularly effective at the 61.8% and 78.6% levels, where exhaustion often coincides with momentum shifts.
Fibonacci Plus Volume Profile
High-volume nodes from the volume profile indicator often line up with Fibonacci levels. When a Fib retracement intersects a volume shelf where significant trading previously occurred, the level gains additional weight as institutional and retail traders defend their existing positions.
Fibonacci Plus Horizontal Support and Resistance
The strongest setups occur when a Fibonacci level overlaps with prior horizontal support or resistance. These confluence zones attract algorithmic and discretionary orders alike, producing sharper reactions and cleaner reversals.
What Are the Common Mistakes Traders Make With Fibonacci Retracement?
The biggest mistake is treating Fibonacci levels as exact price points rather than zones. Price rarely reverses at the precise 61.8% line — instead, it reacts within a band around that level. Traders who place tight orders at exact prices frequently miss entries or get stopped out by minor wicks.
Mistake 1: Using Fibonacci in Ranging Markets
Fibonacci retracement assumes a trend exists. In sideways markets where price oscillates between horizontal support and resistance, Fib levels become meaningless because there's no directional bias to retrace from.
Mistake 2: Cherry-Picking Swing Points
Some traders redraw their Fibs repeatedly until they "find" levels that fit their bias. This is confirmation bias in action. Commit to the most obvious swing high and low, and let the levels speak for themselves.
Mistake 3: Ignoring Volume
Volume confirms whether a Fibonacci level is being respected by real money flow. A bounce at the 61.8% with declining volume is weaker than one with rising volume — the latter indicates genuine buying interest, not just short covering.
Mistake 4: Over-Reliance on a Single Tool
No indicator works in isolation. Traders who base entries solely on Fibonacci without considering trend context, volume, or market structure will eventually face strings of losing trades that damage both capital and confidence.
How to Trade Crypto With Fibonacci Retracement on KuCoin
KuCoin offers built-in Fibonacci retracement tools on its integrated TradingView charts, giving traders professional-grade technical analysis directly within the exchange interface. KuCoin provides the liquidity and asset variety needed for Fibonacci-based strategies across both major coins and altcoins.
To start trading with Fibonacci retracement on KuCoin:
-
Create and verify a KuCoin account at kucoin.com — complete identity verification to unlock full trading limits.
-
Deposit funds via crypto transfer, credit card, or P2P trading.
-
Activate the Fibonacci retracement tool in the chart's drawing toolbar.
-
Draw your retracement from the relevant swing low to swing high.
-
Place limit orders at key Fib levels with predefined stop-losses and take-profits.
Conclusion
Fibonacci retracement remains one of the most reliable technical analysis tools for crypto traders, providing objective levels for entries, exits, and risk management within trending markets. The key levels — 23.6%, 38.2%, 50%, 61.8%, and 78.6% — work because thousands of traders watch them simultaneously, creating real liquidity clusters at predictable prices.
Success with Fibonacci comes from confluence, not isolation. The strongest setups occur when Fib levels align with moving averages, RSI signals, volume profile nodes, or horizontal support and resistance. Beginners should focus on daily and 4-hour charts, anchor their retracements to the most obvious swing points, and treat each level as a zone rather than a precise price.
Avoid the common pitfalls — applying Fibs in ranging markets, redrawing levels to fit your bias, ignoring volume confirmation, and trading around major news events. With disciplined application, structured risk management, and patience for high-probability setups, Fibonacci retracement can become a foundational element of your crypto trading toolkit on KuCoin and beyond.
Frequently Asked Questions (FAQs)
Is Fibonacci retracement reliable for trading altcoins?
Fibonacci retracement works on liquid altcoins but becomes unreliable on low-volume tokens. Stick to altcoins with at least $50 million in daily trading volume — assets with thin liquidity produce erratic price action that doesn't respect technical levels. Top-100 altcoins by market cap generally show clean Fibonacci reactions on the 4-hour and daily timeframes.
What's the difference between Fibonacci retracement and Fibonacci extension?
Fibonacci retracement measures pullbacks within an existing trend, with levels between 0% and 100% of a prior move. Fibonacci extension projects targets beyond the 100% level — at 127.2%, 161.8%, and 261.8% — to identify where a trend might exhaust. Retracements are for entries; extensions are for profit targets.
Can Fibonacci retracement predict exact reversal points?
No — Fibonacci retracement identifies probability zones, not exact reversal points. Price typically reacts within a range around each level rather than at the precise line. Use the 50% and 61.8% levels as approximate decision zones, and always wait for confirming price action before entering trades.
How long do Fibonacci levels remain valid?
Fibonacci levels remain valid until price either decisively breaks the 78.6% retracement or completes a new swing structure that requires redrawing. On daily charts, levels can hold for weeks or months. On lower timeframes like 15-minute charts, they typically remain relevant for hours to a few days.
Should beginners use Fibonacci retracement on their first crypto trades?
Beginners can use Fibonacci retracement, but only as part of a broader trading plan that includes trend analysis, risk management, and position sizing. Start by paper trading on the 4-hour chart of Bitcoin or Ethereum, focus on the 50% and 61.8% levels, and risk no more than 1-2% of your account per trade until you build consistency.