
Will Bitcoin Recover? A Comprehensive 2026 Market Analysis and Recovery Roadmap
2026/03/27 16:39:02
The question "Will Bitcoin recover?" has become the defining inquiry of the 2026 financial landscape. Following the historic bull run of late 2025, where Bitcoin (BTC) reached a staggering peak of approximately $126,000, the market has entered a period of intense volatility and consolidation. As prices currently fluctuate between the $67,000 and $75,000 support zones in March 2026, both retail traders and institutional allocators are searching for a definitive recovery roadmap. Is this a healthy correction in a maturing cycle, or the beginning of a structural shift in the "four-year" rhythm?
In this comprehensive analysis, we deconstruct the core drivers of the 2026 Bitcoin economy. From the resilient inflows of Spot Bitcoin ETFs and the potential legislative breakthrough of the CLARITY Act, to critical technical signals like on-chain accumulation and miner difficulty adjustments, we provide an authoritative look at the market's trajectory. Whether you are a long-term HODLer or a strategic investor, understanding these fundamental shifts is essential for navigating the next phase of Bitcoin's price discovery.
Key Takeaways
-
Current Market State: Bitcoin is currently in a "Stage 4" consolidation phase after a 30% retracement from its $126,000 all-time high (ATH).
-
Institutional Support: Spot ETFs now hold over $115 billion in AUM, creating a "permanent bid" that prevents the 80% crashes seen in 2014 and 2018.
-
Regulatory Milestone: The expected full implementation of the CLARITY Act and the GENIUS Act in late 2026 is projected to unlock trillions in sidelined "Tier-1" bank capital.
-
Scarcity Dynamics: With inflation now below 1% following the 2024 halving, Bitcoin’s stock-to-flow ratio has officially surpassed that of gold.
-
Recovery Timeline: Expert consensus points toward a slow "grind" through Q2 2026, with a high probability of a new ATH attempt in Q4 2026 as global liquidity expands.
Decoding the 2025-2026 Correction: Why Did Bitcoin Drop?
To accurately predict a recovery, we must first diagnose the "ailment" that caused the recent downturn. The drop from $126,000 wasn't a failure of the Bitcoin protocol; it was a necessary deleveraging event fueled by a "perfect storm" of macro and technical factors.
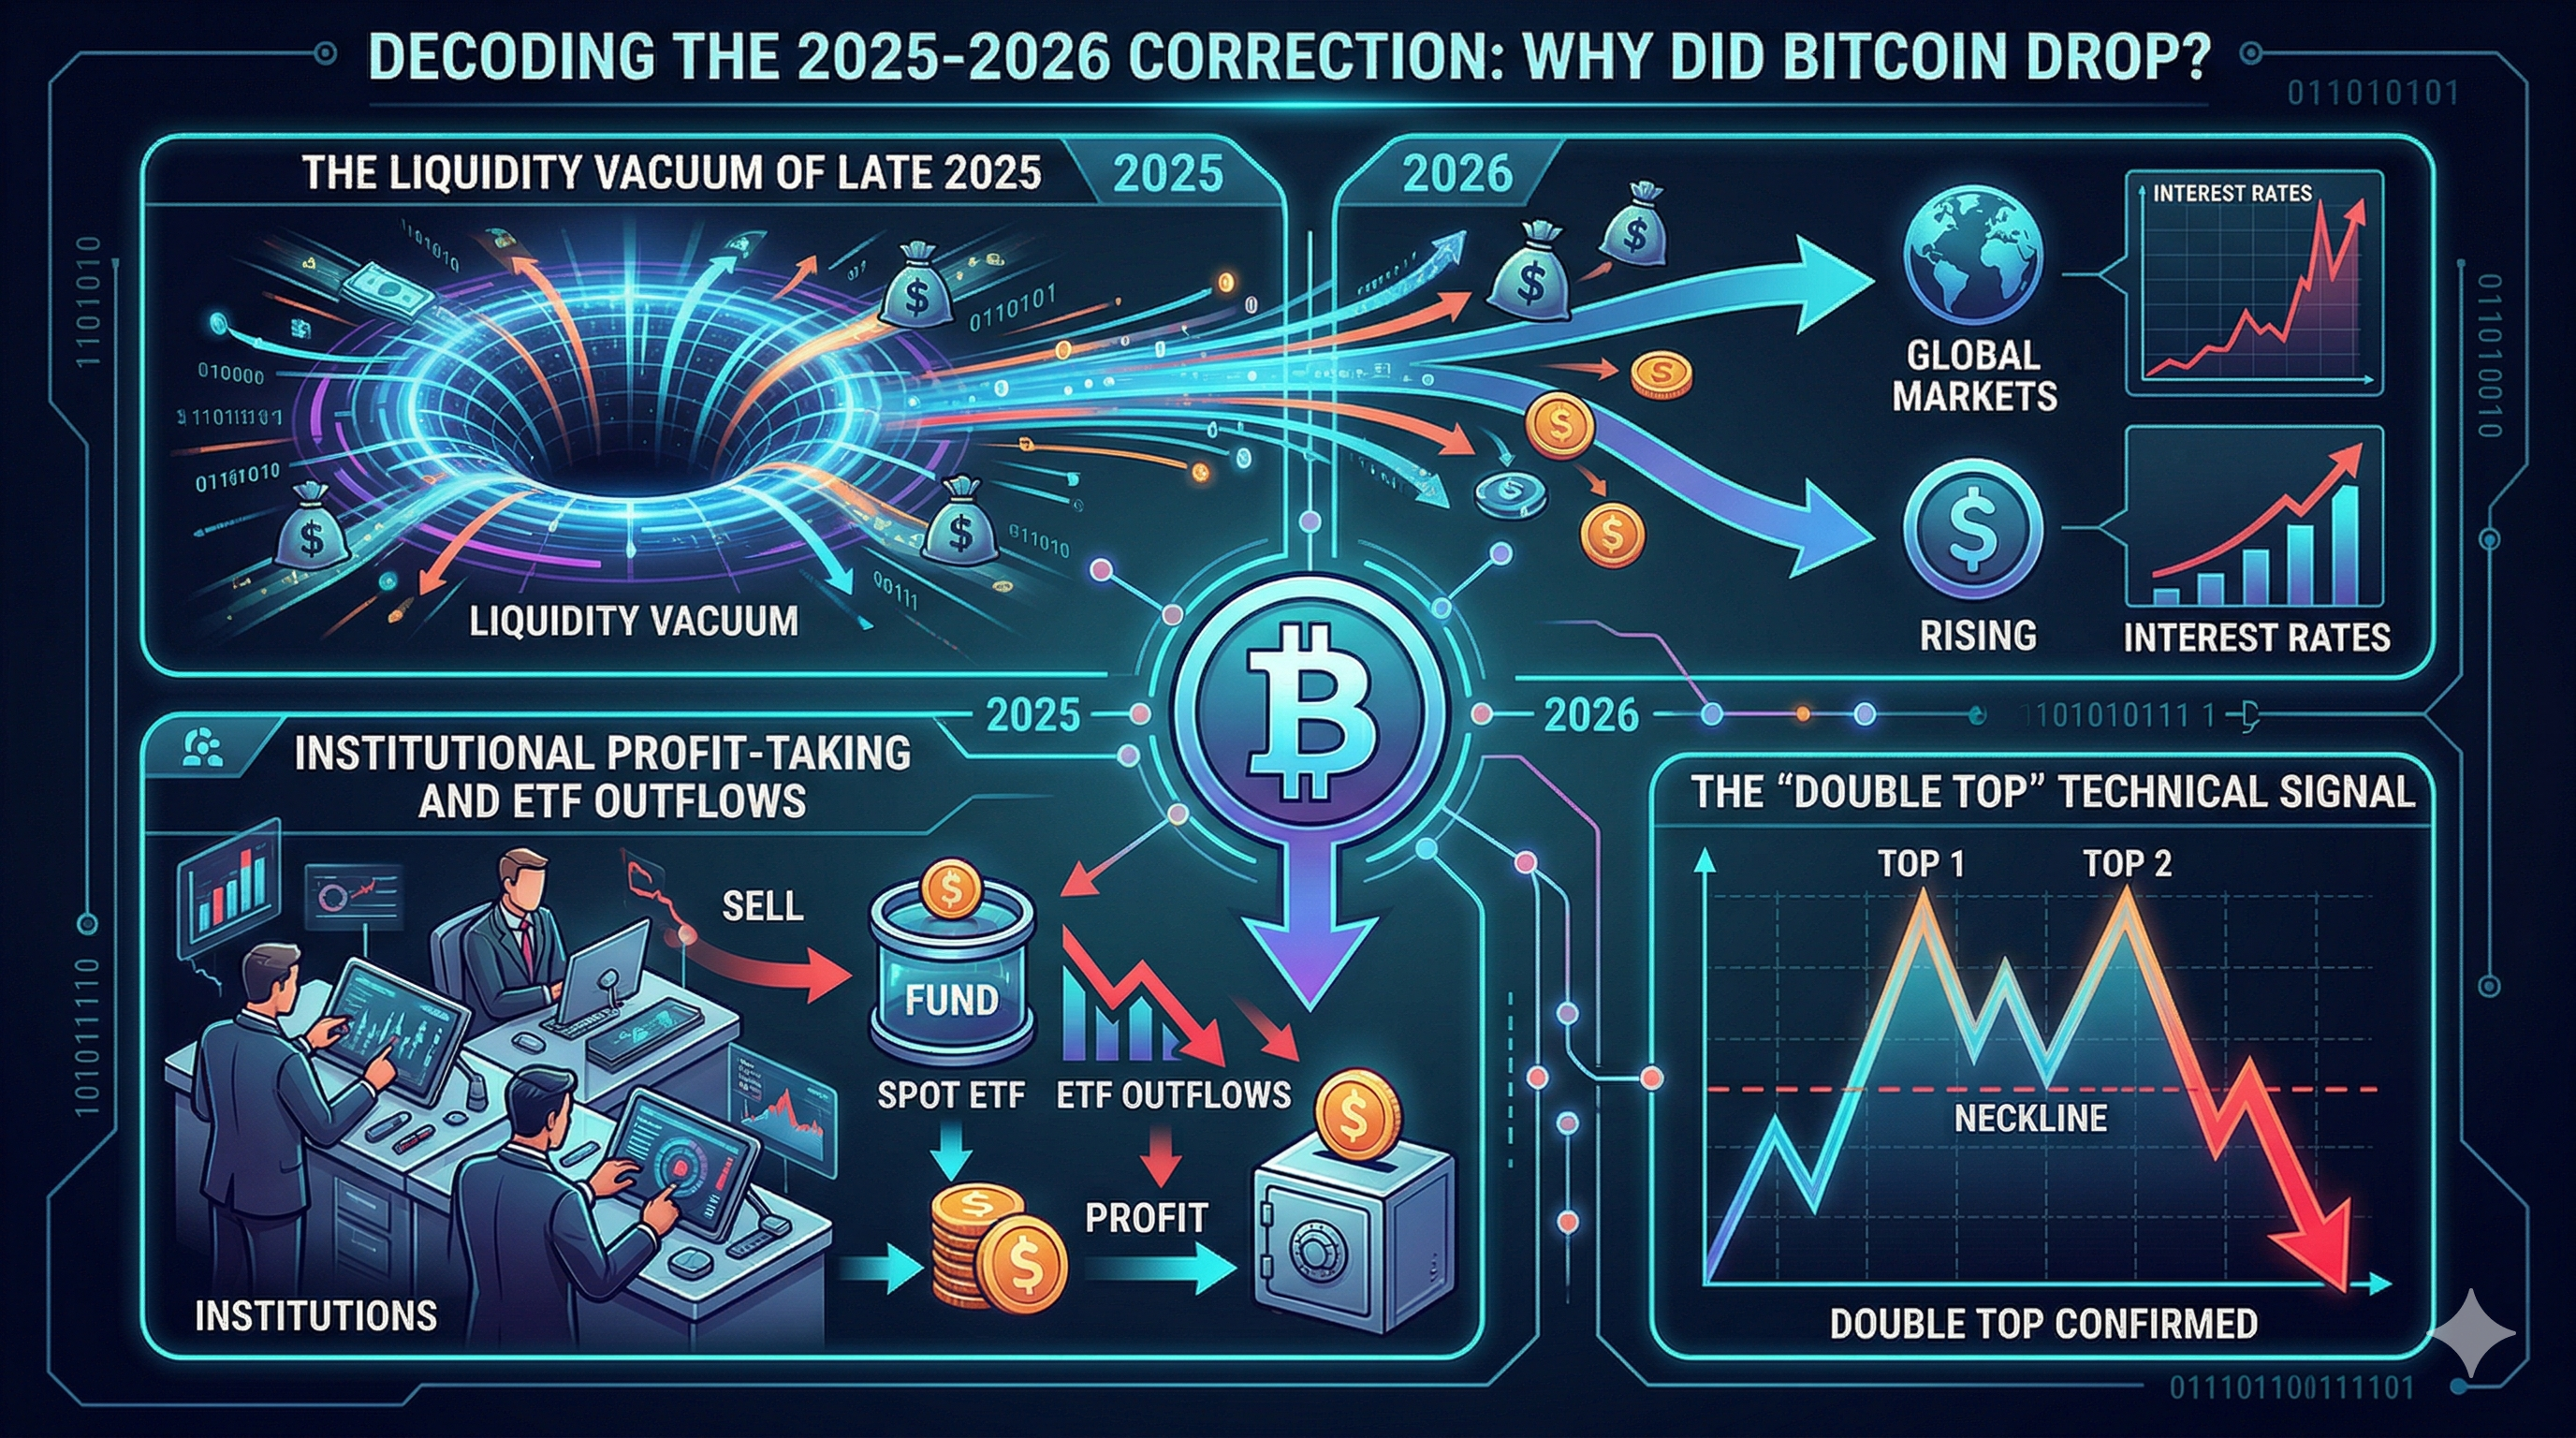
The Liquidity Vacuum of Late 2025
Throughout 2025, Bitcoin benefited from a "simultaneous easing" cycle where 70% of global central banks were cutting interest rates. However, as we entered 2026, this shifted. The Federal Reserve transitioned to a "higher for longer" hold to combat sticky inflation. This reduced the "excess liquidity" that typically flows into high-risk assets like BTC.
Institutional Profit-Taking and ETF Outflows
For the first time in history, Bitcoin's price discovery is heavily influenced by Wall Street. When BTC hit $126,000, many institutional funds hit their "rebalance" triggers. We saw a period where BlackRock’s IBIT and Fidelity’s FBTC experienced their first sustained weeks of net outflows as pension funds locked in 100%+ gains. This institutional "sell-side" pressure met a thin retail order book, leading to the rapid slide back toward $80,000.
The "Double Top" Technical Signal
From a technical perspective, Bitcoin formed a classic "double top" on the weekly chart near $125k. This signaled to professional traders that the "momentum-driven" phase of the cycle had exhausted. According to Elliott Wave Theory, the market entered a "Wave C" corrective phase, which typically seeks out strong historical support levels—specifically the previous cycle's peak near $69,000.
Historical Context: Do Bitcoin Halving Cycles Still Matter?
The most common argument against Bitcoin recovery is the claim that "the cycles are broken." However, a look at the data suggests that while the cycles are evolving, the underlying math remains intact.
The Evolution of Volatility
Historically, Bitcoin bear markets resulted in 80-85% drawdowns.
-
2013-2015: -85%
-
2017-2018: -84%
-
2021-2022: -77%
-
2025-2026: -35% (Current)
This "dampening" of volatility is a sign of asset maturation. As the market cap increases, it requires exponentially more capital to move the price, which conversely makes it harder for the price to collapse. The 2026 recovery is likely to be a "u-shaped" accumulation rather than the "v-shaped" bounces of the past.
The Post-Halving Scarcity Squeeze
April 2024 halving reduced the daily issuance from 900 BTC to 450 BTC. In 2026, we are feeling the "delayed effect" of this supply shock. Historically, the true supply squeeze didn't hit the price until 12–18 months post-halving. We are currently in that "Golden Window" where the available supply on exchanges is at its lowest level in over a decade.
The Institutional Floor: Why This Recovery Might Be Different
In 2018, when Bitcoin dropped, there was no safety net. In 2026, the "safety net" is composed of the largest financial institutions on Earth.
The ETF "Black Hole" Effect
As of 2026, spot Bitcoin ETFs manage over $115 billion in combined assets.() These are not speculative "day traders." These are institutional holdings where Bitcoin is increasingly treated as a "Strategic Reserve Asset." When BTC price drops below the "Institutional Cost Basis" (estimated to be between $65,000 and $72,000), these funds see massive inflows as long-term allocators "buy the dip" to rebalance their portfolios.
The Rise of Digital Asset Treasuries (DAT)
Companies like Strategy Inc. (formerly MicroStrategy) have pioneered the "Bitcoin Standard" for corporate balance sheets. With the implementation of the FASB fair-value accounting rules in late 2024, it is now easier for S&P 500 companies to hold BTC without penalizing their earnings reports.() This creates a "structural demand" that didn't exist in previous cycles.
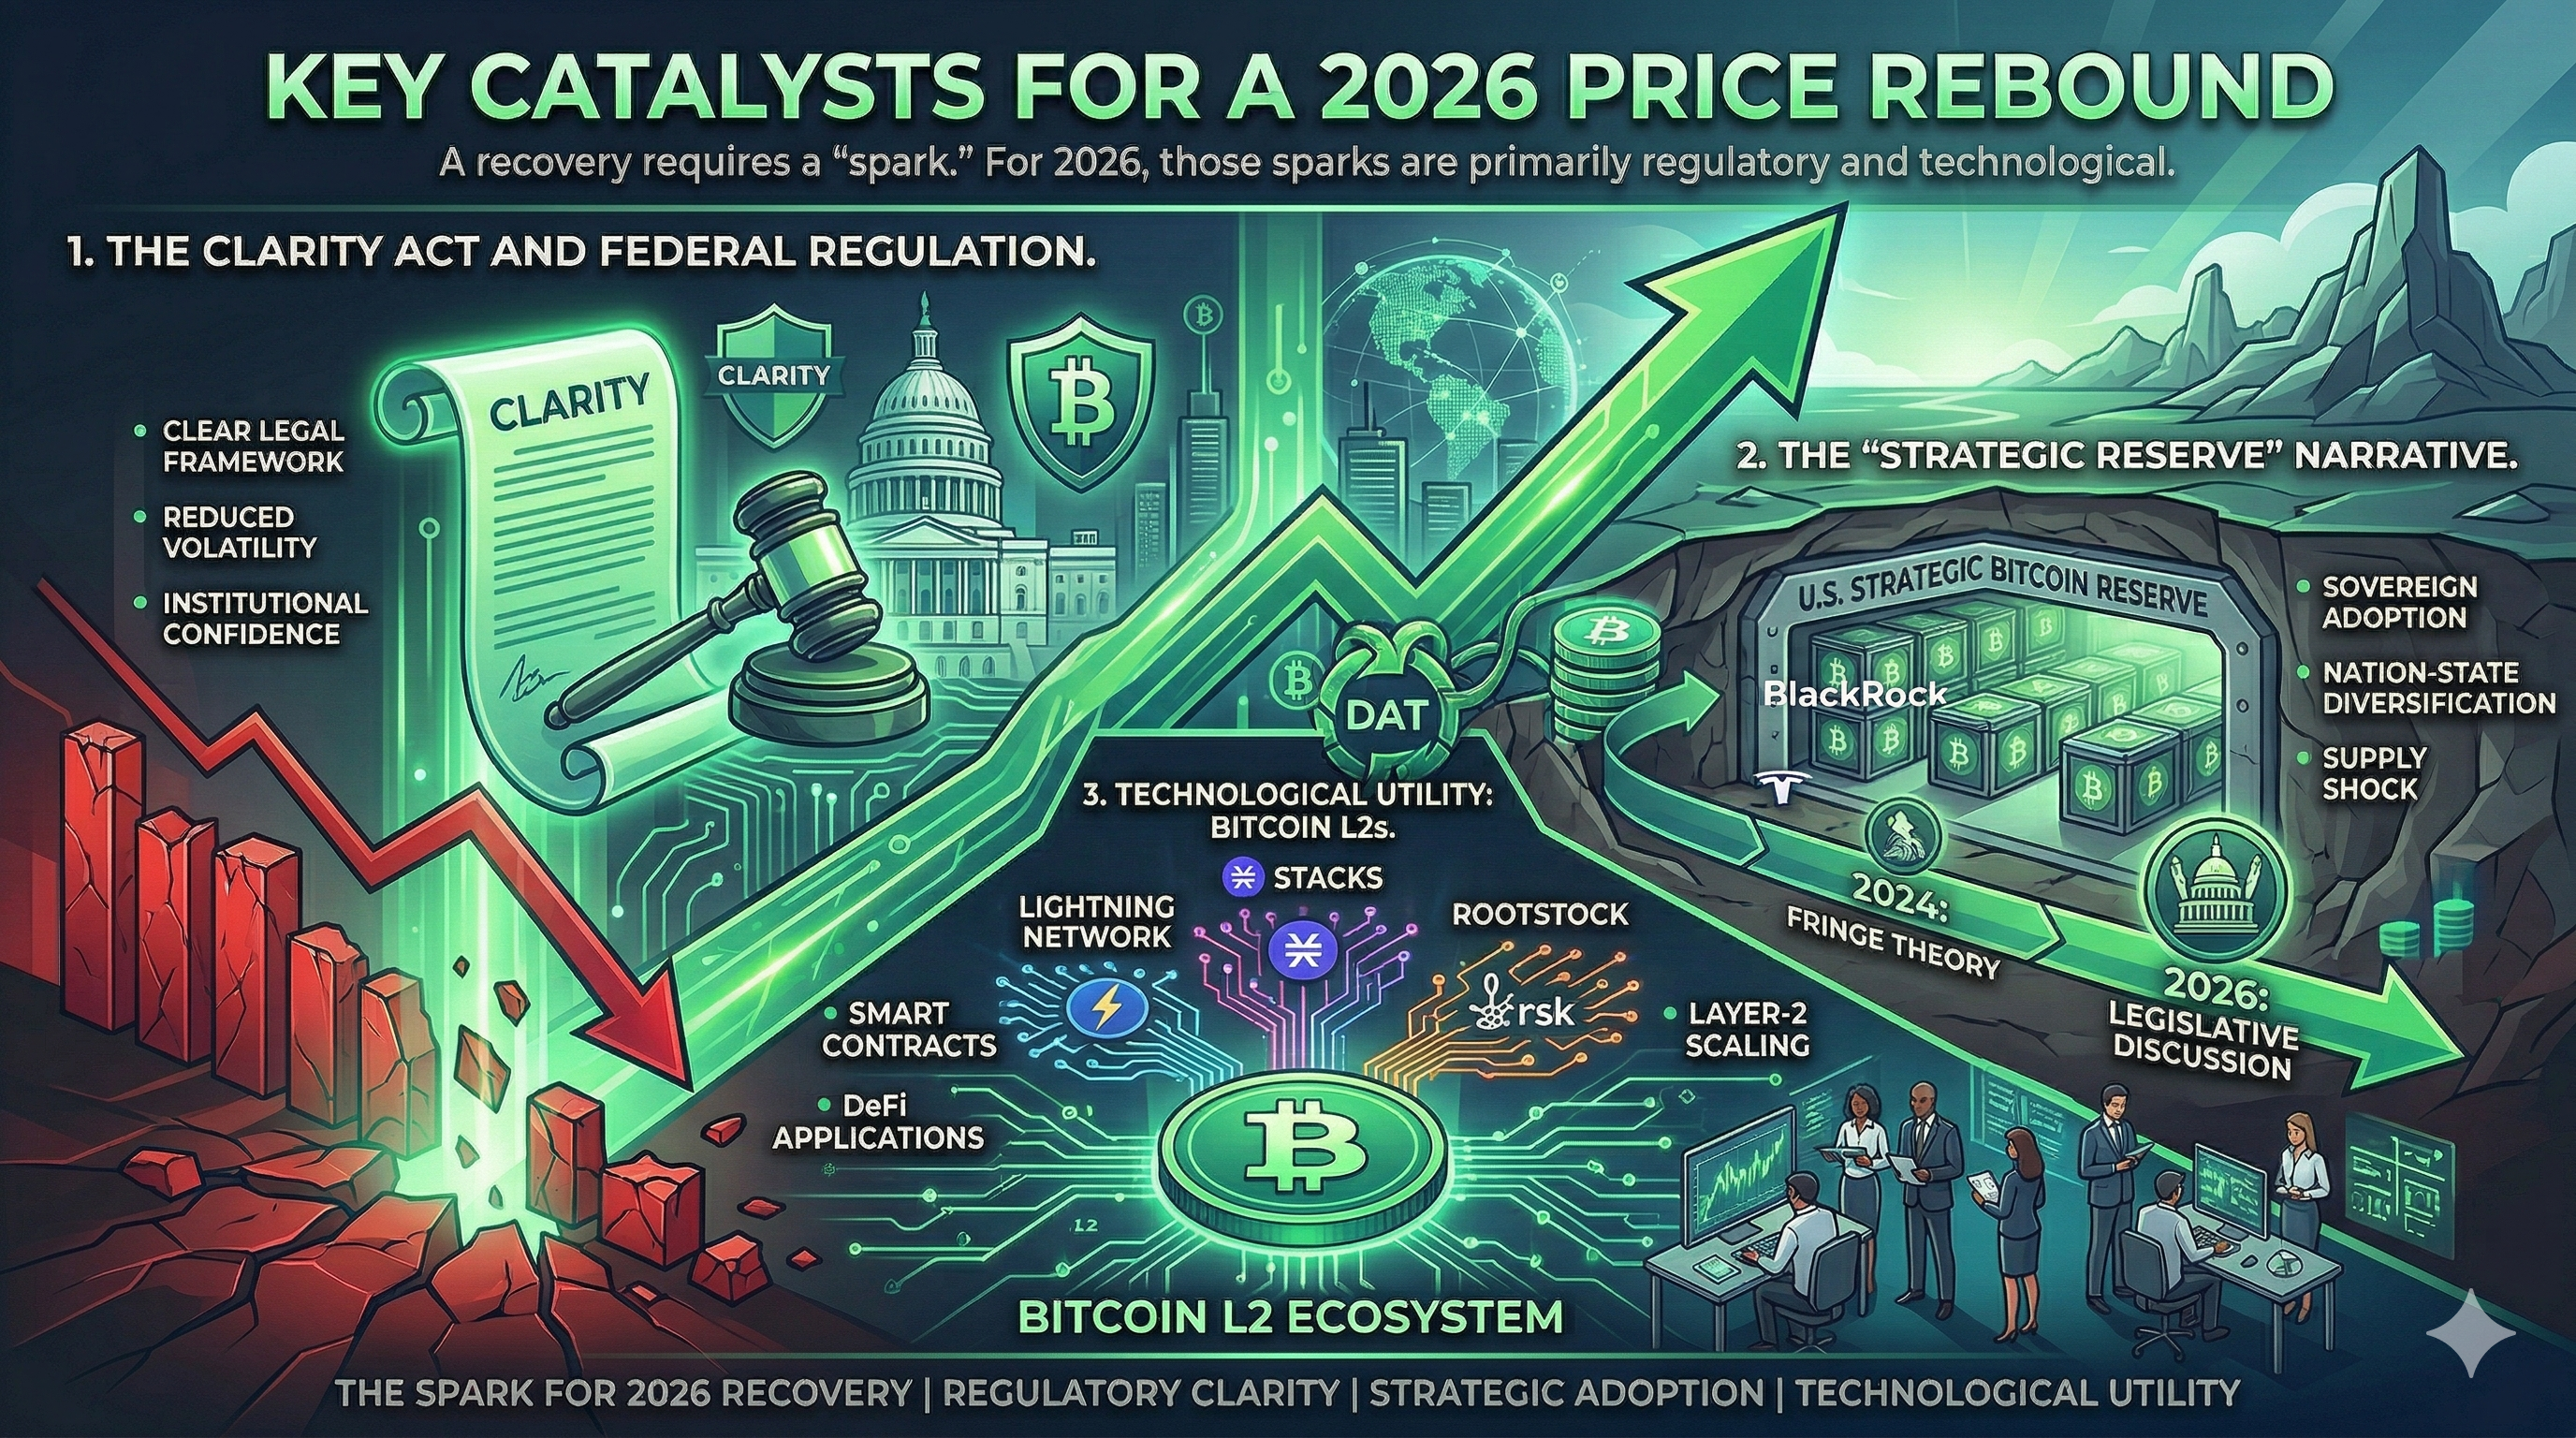
Key Catalysts for a 2026 Price Rebound
A recovery requires a "spark." For 2026, those sparks are primarily regulatory and technological.
-
The CLARITY Act and Federal Regulation
The CLARITY Act is the most significant piece of crypto legislation in U.S. history. Expected to be fully operational by Q3 2026, it provides a clear legal definition for "Digital Commodities" and "Digital Securities." This removes the "Legal Risk" that has prevented trillions of dollars from U.S. banks and insurance companies from entering space.
-
The "Strategic Reserve" Narrative
Talk of a U.S. Strategic Bitcoin Reserve transitioned from a "fringe theory" in 2024 to a "legislative discussion" in 2026. While not yet law, the mere discussion of nation-states competing for BTC supply creates a powerful "FOMO" (Fear Of Missing Out) effect among other sovereign wealth funds, particularly in the Middle East and Asia.
-
Technological Utility: Bitcoin L2s
Bitcoin is no longer just a "store of value." The explosion of Bitcoin Layer-2 (L2) solutions like the Lightning Network, Stacks, and Rootstock has enabled smart contracts and DeFi on top of the world’s most secure network. This increases the "Network Velocity" of Bitcoin, giving it fundamental utility value beyond speculation.
Expert Price Predictions: What the Analysts Are Saying
The financial world is divided, but the "smart money" remains overwhelmingly constructive on Bitcoin’s recovery potential.
Standard Chartered (Bull Case): Analysts maintain a target of $150,000 to $200,000 by the end of 2026, citing the "Gold ETF" trajectory as a roadmap for BTC’s price discovery.
JPMorgan (Conservative Case): Their "volatility-adjusted" model suggests a fair value of $110,000, assuming Bitcoin eventually matches gold's allocation in private investor portfolios.
Bernstein: Remains the most aggressive, calling for $500,000 by 2030, viewing the current 2026 correction as a "generational buying opportunity."
Cathie Wood (ARK Invest): Continues to point toward $1 million by 2030, emphasizing the role of Bitcoin as a hedge against "currency debasement" in emerging markets.
Technical Indicators to Watch for Recovery
If you are looking for the "Bottom Signal," these are the three metrics that professional traders are watching in 2026:
-
MVRV Z-Score: This on-chain metric measures the ratio between Market Cap and Realized Cap. When it enters the "Green Zone," it indicates that Bitcoin is extremely undervalued relative to its "fair cost" and historically precedes a 100%+ recovery.
-
The 200-Week Moving Average: Often called the "Ultimate Support," this line currently sits near $62,000. Bitcoin has almost never spent significant time below this level in its history.
-
Bitcoin Dominance: Watch for BTC Dominance to climb back above 60%. Historically, a recovery starts with Bitcoin sucking the liquidity out of altcoins before the rest of the market follows.
Conclusion: A Matter of "When," Not "If"
The question of whether Bitcoin will recover in 2026 is fundamentally tied to its maturation as an institutional asset. While the days of 1,000% annual gains may be over, the structural supports—ranging from Spot ETFs to the CLARITY Act—provide a foundation that was non-existent in previous cycles. Bitcoin is no longer an experiment; it is a global financial infrastructure. As global liquidity returns and the "scarcity shock" of the 2024 halving continues to thin out exchange reserves, the current consolidation phase will likely be remembered as the last "great accumulation zone" before Bitcoin enters its permanent six-figure era.
For investors looking to capitalize on this recovery, choosing a secure and liquid platform is paramount. KuCoin remains a top-tier recommendation for both retail and professional traders, offering an extensive range of trading pairs, advanced charting tools for tracking the technical indicators mentioned above, and robust security protocols. Whether you are looking to execute a long-term DCA (Dollar Cost Averaging) strategy or trade the volatility of the $70,000 support level, KuCoin provides the depth and reliability needed to navigate the 2026 market.
FAQs
Has Bitcoin ever failed to recover from a 30% drop?
No. Historically, Bitcoin has experienced multiple 30% to 50% drawdowns in every single bull cycle (2013, 2017, 2021). Each time, it has gone on to reach a new all-time high.
What is the "Floor Price" for Bitcoin in 2026?
Most analysts point to the $60,000 to $65,000 range. This is the level where the "average cost basis" for most spot ETFs resides, creating a strong zone of "buy-the-dip" institutional interest.
How does the "CLARITY Act" affect the price?
It removes "Institutional Friction." Many large banks and pension funds have internal mandates that prevent them from investing in assets with "unclear regulatory status." The CLARITY Act provides that status, potentially allowing hundreds of billions of new capital to enter the market.
Will Bitcoin ever hit $1 million?
While price predictions vary, firms like ARK Invest and Fidelity have published models suggesting that if Bitcoin captures 10-15% of the global gold and "store of value" market, a $1 million price tag is mathematically feasible by the early 2030s.()
Should I wait for a lower price to buy?
"Timing the market" is a losing strategy for 95% of investors. Most experts recommend Dollar Cost Averaging (DCA)—investing a set amount at regular intervals—to smooth out volatility and build a long-term position.