
Bollinger Bands (BOLL) Indicator Explained: How to Read Volatility and Trade Smarter in Crypto
Introduction
A cryptocurrency can appear completely stuck for days, moving sideways with no clear direction, only to suddenly break out in a sharp move that most traders catch too late. In fast-moving markets, these quiet phases often conceal the buildup that precedes volatility, making it difficult to know when momentum is about to shift.
Bollinger Bands (BOLL) are designed to help interpret those conditions. Rather than predicting price direction with certainty, they provide a structured way to assess market volatility, showing when price is compressing, expanding, or stretching beyond typical ranges. This makes it easier to recognize periods of potential buildup or exhaustion in the market.
If you have seen a trading chart with three lines wrapping around price like a dynamic channel, you have likely encountered Bollinger Bands. They are among the most widely used technical indicators because they adapt to market behavior in real time and present volatility in a clear, visual format.
This guide explains what Bollinger Bands are, how they work, how to apply them in practical trading scenarios, and where their strengths and limitations lie. Whether you are new to crypto trading or refining your technical analysis approach, this serves as a clear and structured introduction to understanding market volatility through Bollinger Bands.
What Are Bollinger Bands (BOLL)?
At their simplest, Bollinger Bands are a visual envelope plotted around price data on a chart. They consist of three bands that move together as the price evolves. These lines expand and contract based on market volatility, which makes them more adaptive than most fixed indicators.
The name comes from both the function of the tool, which is to create bands around price, and its creator.
Bollinger Bands Origin
Bollinger Bands were created by John Bollinger in the early 1980s. Bollinger was a technical analyst who noticed a fundamental flaw in how traders were using price envelopes at the time: they relied on fixed-width channels that didn't respond to how active or calm the market actually was. A fixed channel set during a quiet period would become meaningless when volatility spiked, and vice versa.
His solution was elegant. He used standard deviation in combination with a moving average to create bands that automatically widen or contract depending on recent price variation. This made the indicator self-adjusting, and that adaptability is what still makes it valuable today in fast-moving markets like crypto.
The Three Bollinger Lines Explained
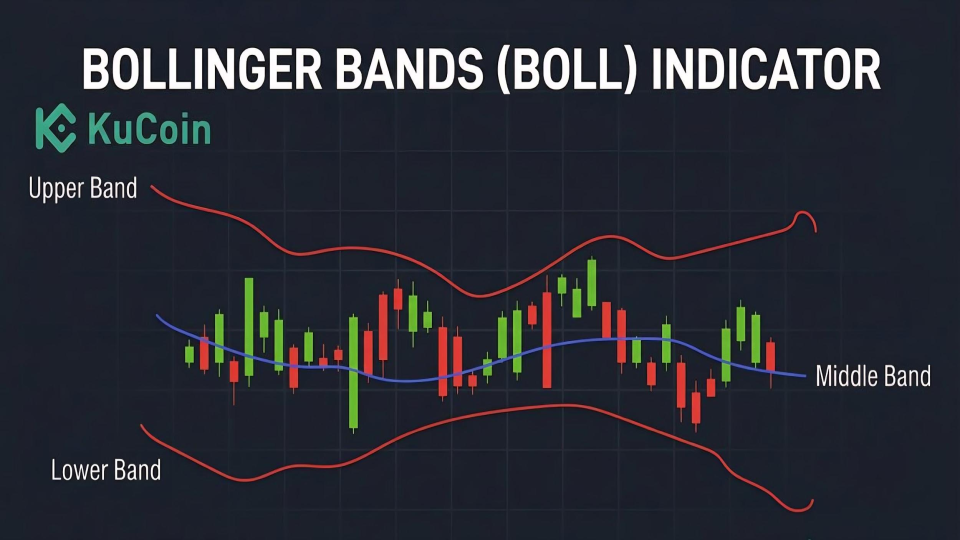
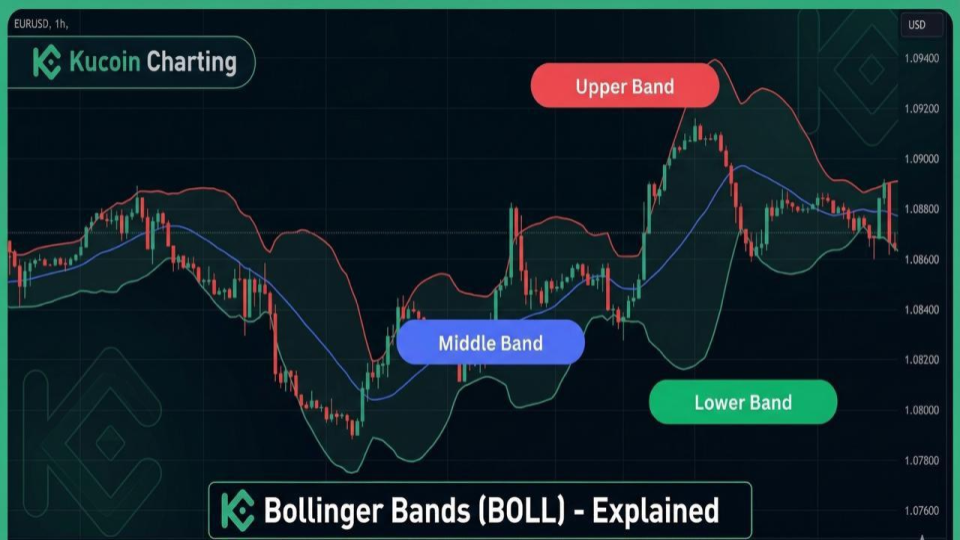
Every Bollinger Band chart displays three components working together:
-
The Middle Band: This is a simple moving average (SMA), typically calculated over 20 periods. It tracks the average price over recent candles and acts as the anchor for the entire indicator.
-
The Upper Band: It sits above the middle band and is calculated by adding a multiple of the standard deviation, usually two, to the moving average. In calm markets, it stays relatively close to the middle line. In volatile markets, it stretches further away.
-
The Lower Band: It mirrors this logic on the downside, sitting below the middle band by the same multiple of standard deviation.
Together, these three lines form a channel that captures roughly 95% of price action under normal conditions. When price breaks outside that channel, something statistically unusual is happening, and that's exactly when traders pay attention.
How Bollinger Bands Work?
Understanding Bollinger Bands properly requires grasping one central concept: they don't measure direction. They measure volatility and relative price position. The direction of the market is something you have to determine through other means. What Bollinger Bands tell you is how stretched or compressed price currently is, and how active the market has been recently.
What is Bollinger Bands Formula?
You do not need to calculate Bollinger Bands manually since charting platforms handle it automatically. However, understanding how the formula works helps you interpret what the bands are showing on your chart.
The middle band is a simple moving average, typically based on the last 20 closing prices. The upper and lower bands are then derived by adding and subtracting two times the standard deviation of price over the same period.
Standard deviation measures how far prices deviate from the average. When prices stay close to the moving average, standard deviation is low and the bands remain narrow. When prices move sharply and fluctuate more widely, standard deviation increases and the bands expand.
In practice, widening bands indicate rising volatility, while narrowing bands suggest a period of lower volatility where the market may be consolidating before a potential move.
What the Bands Tell You in Real Time
Once you're looking at a chart with Bollinger Bands applied, three general states become visible:
-
When the bands are wide, the market has recently experienced significant price movement. This often means momentum is high, but it can also signal that a move is maturing and may be running out of energy.
-
When the bands are narrow, the market is in a low-volatility phase. Price is consolidating. This quiet phase frequently precedes a sharp directional move, though the bands themselves don't tell you which direction.
-
When price is near the upper band, it is trading significantly above its recent average. When it's near the lower band, the opposite is true. Neither condition alone is a signal — context determines meaning.
How to Read Bollinger Bands: Zones and Signals
Reading Bollinger Bands in real market conditions is about more than just watching where price is relative to the lines. It's about understanding what that position means in the context of trend, volume, and momentum.
Overbought and Oversold Conditions
If the price touches or exceeds the upper band, it may indicate overbought conditions. Touching the lower band may signal oversold conditions. But context matters: in strong uptrends, price may hug the upper band for long periods. In downtrends, price may ride the lower band.
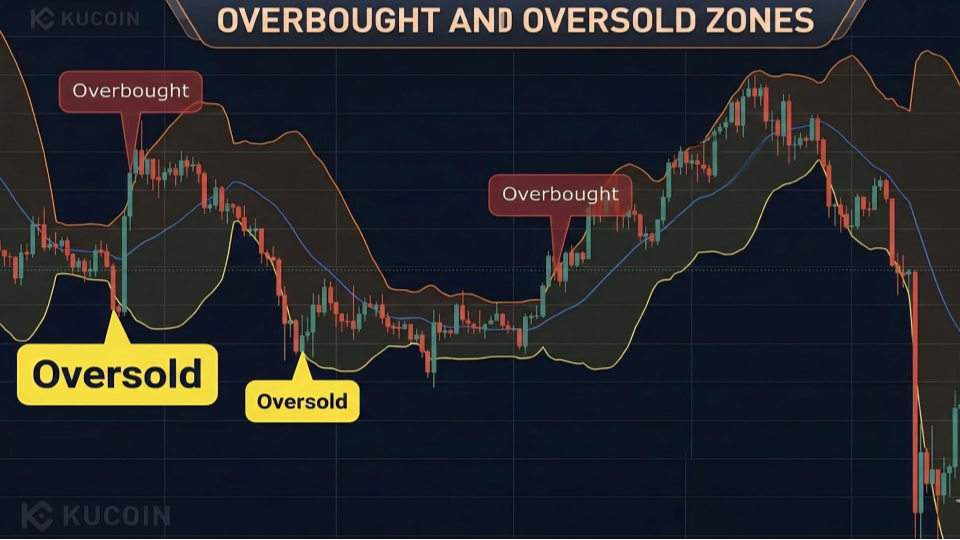
This is one of the most important things to understand about Bollinger Bands, and where many new traders get confused. Touching the upper band does not automatically mean "sell." In a powerful uptrend, price can walk along the upper band for days or weeks, with each candle confirming strength rather than exhaustion. The signal becomes meaningful when price touches the band and then pulls back, or when momentum indicators like RSI confirm that buying pressure is weakening.
The same logic applies in reverse for the lower band. A touch in a severe downtrend might simply mean the market is falling fast, not that it's ready to bounce.
The Bollinger Band Squeeze
One of the most powerful setups with Bollinger Bands is the squeeze: when the upper and lower bands converge tightly, volatility is compressed, and often a big move is waiting.
The squeeze is widely considered one of the most reliable setups the indicator produces. The logic is intuitive: markets alternate between periods of low and high volatility. A prolonged squeeze, where the bands are tighter than they've been in weeks or months, represents built-up tension. When that tension releases, the resulting move can be sharp and sustained.
In crypto markets, where volatility is high and breakout moves are frequent, the squeeze setup can trigger sharp moves in minutes or hours rather than days.
The squeeze itself does not tell you the direction of the breakout. That is why traders typically wait for price to decisively break above the upper band or below the lower band, ideally confirmed by a spike in volume, before committing to a position.
Band Width and What It Signals
Band width, the distance between the upper and lower bands, is a secondary metric some traders track explicitly. When band width reaches historically low levels, a squeeze is confirmed. When band width expands sharply after a squeeze, it suggests a new trend is forming.
Watching band width over time gives you a sense of the market's volatility cycle, helping you stay patient during quiet periods and alert during transitions.
Bollinger Bands Trading Strategies
There is no single "correct" way to trade with Bollinger Bands. The most effective approach depends on market conditions, whether the market is trending or ranging, and how you combine the indicator with other signals. Here are the three most widely used strategies.
Mean-Reversion Strategy
This strategy works best in markets that are moving sideways without a clear directional trend. The premise is that price, when stretched to an extreme, tends to return toward its average.
When price touches or briefly breaks below the lower band and then begins to recover, a trader using this strategy would look for a long entry, targeting the middle band or upper band as a profit zone. The reverse applies on the upside. A touch at the upper band followed by a retreat suggests a potential short trade back toward the middle.
The key discipline here is confirming that the market is actually range-bound before applying this strategy. In a trending market, mean-reversion trades can go badly wrong.
Breakout Strategy
During a squeeze, expect a directional breakout. Wait for price to break out above the upper band with volume, or below the lower band with volume, and ride the move.
The breakout strategy is particularly well-suited to crypto markets, where periods of tight consolidation often precede sharp, momentum-driven moves. The setup requires patience: you identify a squeeze forming, watch the bands narrow, and then set up alerts for a decisive break. The entry comes when price closes convincingly outside the band with volume support.
Stop-losses are typically placed just inside the band that was broken, giving the trade room to develop while limiting downside if the breakout fails.
Trend-Following Strategy in Bull Markets
In trending markets, Bollinger Bands shift from being a reversal tool to a trend-confirmation tool. In trending markets, price may ride the upper band in an uptrend or the lower band in a downtrend. Traders use the middle band as a dynamic stop or exit.
This approach requires a mindset shift. Instead of seeing the upper band as a "sell zone," you see it as evidence of trend strength. Pullbacks to the middle band, the 20-period moving average, become buying opportunities rather than warning signals. Exits are triggered when price fails to hold above the middle band on a sustained basis, suggesting the trend is losing momentum.
Benefits of Using Bollinger Bands in Crypto
Bollinger Bands offer several genuine advantages that make them particularly well-suited to cryptocurrency markets.
-
Adaptability to Volatility: Unlike fixed indicators with static levels, Bollinger Bands respond dynamically to market conditions. Volatility in crypto can spike or collapse within hours, and the bands expand and contract accordingly, giving traders a real-time gauge of market mood. This makes them far more reliable in crypto than in quieter, more predictable markets.
-
Universal Applicability: Bollinger Bands work on any asset that has price data. Whether you're analyzing Bitcoin on a daily chart or a mid-cap altcoin on a 15-minute timeframe, the same logic applies. There's no need to recalibrate your framework for different assets.
-
Visual Clarity: One of the most underrated aspects of Bollinger Bands is how intuitively readable they are. Even someone who has never traded before can look at a chart with Bollinger Bands applied and immediately grasp the concept of price being "stretched" or "compressed." This clarity makes them accessible to all levels of experience.
-
Works Across All Timeframes: In crypto markets, Bollinger Bands work on multiple timeframes. From 5-minute intraday charts to 4-hour and daily frames. This flexibility allows them to be used as part of a layered analysis approach, where a longer timeframe sets the overall context and a shorter one refines entries.
Risk Analysis: Limitations and False Signals
For all their strengths, Bollinger Bands carry real limitations that are often underestimated, especially by newer traders who mistake the three lines for a complete trading system. Understanding these risks is not optional; it is essential.
When Bollinger Bands Can Mislead You
The most common trap is treating a band touch as an automatic signal. Bollinger Bands can give false signals if used alone. Price may break the band and continue in the same direction rather than mean-reverting. During strong trending moves, the bands may be misleading. Price hugging the upper band is not always overbought; it may simply reflect momentum.
There is also a statistical limitation worth noting. The use of standard deviation assumes certain statistical distributions, which do not always hold in crypto markets. Fat tails and extreme moves are common. In plain language, the bands are calculated based on normal market behavior, but crypto regularly produces moves that are far outside normal. During black swan events such as sudden regulatory announcements, exchange collapses, or macro shocks, Bollinger Bands can break down as a reliable reference.
Additionally, the indicator is lagging by nature. Because the middle band is a moving average of past prices, all three bands reflect what has already happened, not what is about to happen. In fast-moving crypto markets, this lag can result in signals arriving after the optimal entry point has passed.
Common Mistakes to Avoid
-
Selling just because RSI is overbought: This logic applied to Bollinger Bands, selling because price touches the upper band, causes traders to exit strong trends far too early or enter short positions that immediately reverse against them.
-
Using Bollinger Bands on low-liquidity assets: On thinly traded altcoins, even small orders can dramatically move the price, creating band touches that have no statistical meaning. The indicator performs best on assets with deep, consistent volume.
-
Ignoring the trend context: Applying a mean-reversion strategy in a trending market is one of the most common and costly errors. Always determine whether the market is ranging or trending before selecting a strategy.
-
Over-relying on the squeeze signal: Not every squeeze produces a significant breakout. Some resolve with a modest move that quickly reverses. Volume confirmation is essential before committing to a breakout trade.
Combining Bollinger Bands with Other Indicators
Bollinger Bands measure volatility and relative price position, but they provide limited insight into direction or momentum. For this reason, they are most effective when used alongside complementary indicators that help confirm signals and provide additional context.
Common pairings include the Relative Strength Index (RSI) for identifying momentum and potential overbought or oversold conditions, volume analysis for confirming the strength behind price moves, and MACD or the Stochastic Oscillator for trend and reversal signals.
For example, if price touches the lower Bollinger Band after a sharp decline and the RSI falls below 30, the combination reflects both a statistical price extreme and weak momentum. When these conditions align, the probability of a rebound is stronger than when either signal appears alone.
In another scenario, a Bollinger Band squeeze followed by low and contracting volume often indicates a period of consolidation. When volume begins to rise as price breaks out of the squeeze, it supports the validity of the move and reduces the likelihood of a false breakout.
The purpose of combining indicators is not to increase complexity, but to improve confirmation. When multiple signals align, traders can better filter out weaker setups and focus on higher-probability opportunities.
Conclusion
Bollinger Bands are a simple yet powerful indicator that helps traders understand market volatility, price extremes, and changing conditions. While they do not predict direction or provide exact buy and sell signals, they offer valuable context for interpreting market behavior, especially in fast-moving crypto markets.
Their usefulness is most evident when identifying volatility patterns such as squeezes, overbought and oversold conditions, and trend continuation through band interaction. However, they should not be used in isolation. Without confirmation from other indicators or consideration of broader market context, they can produce misleading signals.
When applied alongside complementary tools and used with a clear understanding of their limitations, Bollinger Bands become a practical component of a broader trading approach, helping traders make more informed and disciplined decisions.
FAQs
What are Bollinger Bands (BOLL) in crypto trading?
Bollinger Bands are a technical indicator that shows market volatility using three lines around price. They help traders understand whether the market is expanding, contracting, or trading within a range.
How do you use Bollinger Bands in cryptocurrency trading?
Traders use Bollinger Bands to identify volatility, potential breakouts, and overbought or oversold conditions. Common approaches include mean-reversion in ranging markets, breakout trading during squeezes, and trend-following in strong trends.
What does the Bollinger Bands squeeze mean?
A Bollinger Bands squeeze occurs when the bands contract tightly, indicating low volatility. It often signals that a significant price move may follow, though the direction is not determined by the squeeze alone.
Is the BOLL indicator reliable for trading decisions?
The BOLL indicator is useful for analyzing volatility and price extremes, but it should not be used alone. It works best when combined with indicators like RSI, MACD, or volume for confirmation.
What is the best Bollinger Bands trading strategy for crypto?
There is no single best strategy. Popular Bollinger Bands trading strategies include mean-reversion in sideways markets, breakout trading after squeezes, and trend-following strategies where price rides the upper or lower band in strong trends.