
Gold Falls Below $4,000: Strong Dollar, Fed Rate-Hike Bets, and ETF Outflows Test the Bullion Rally
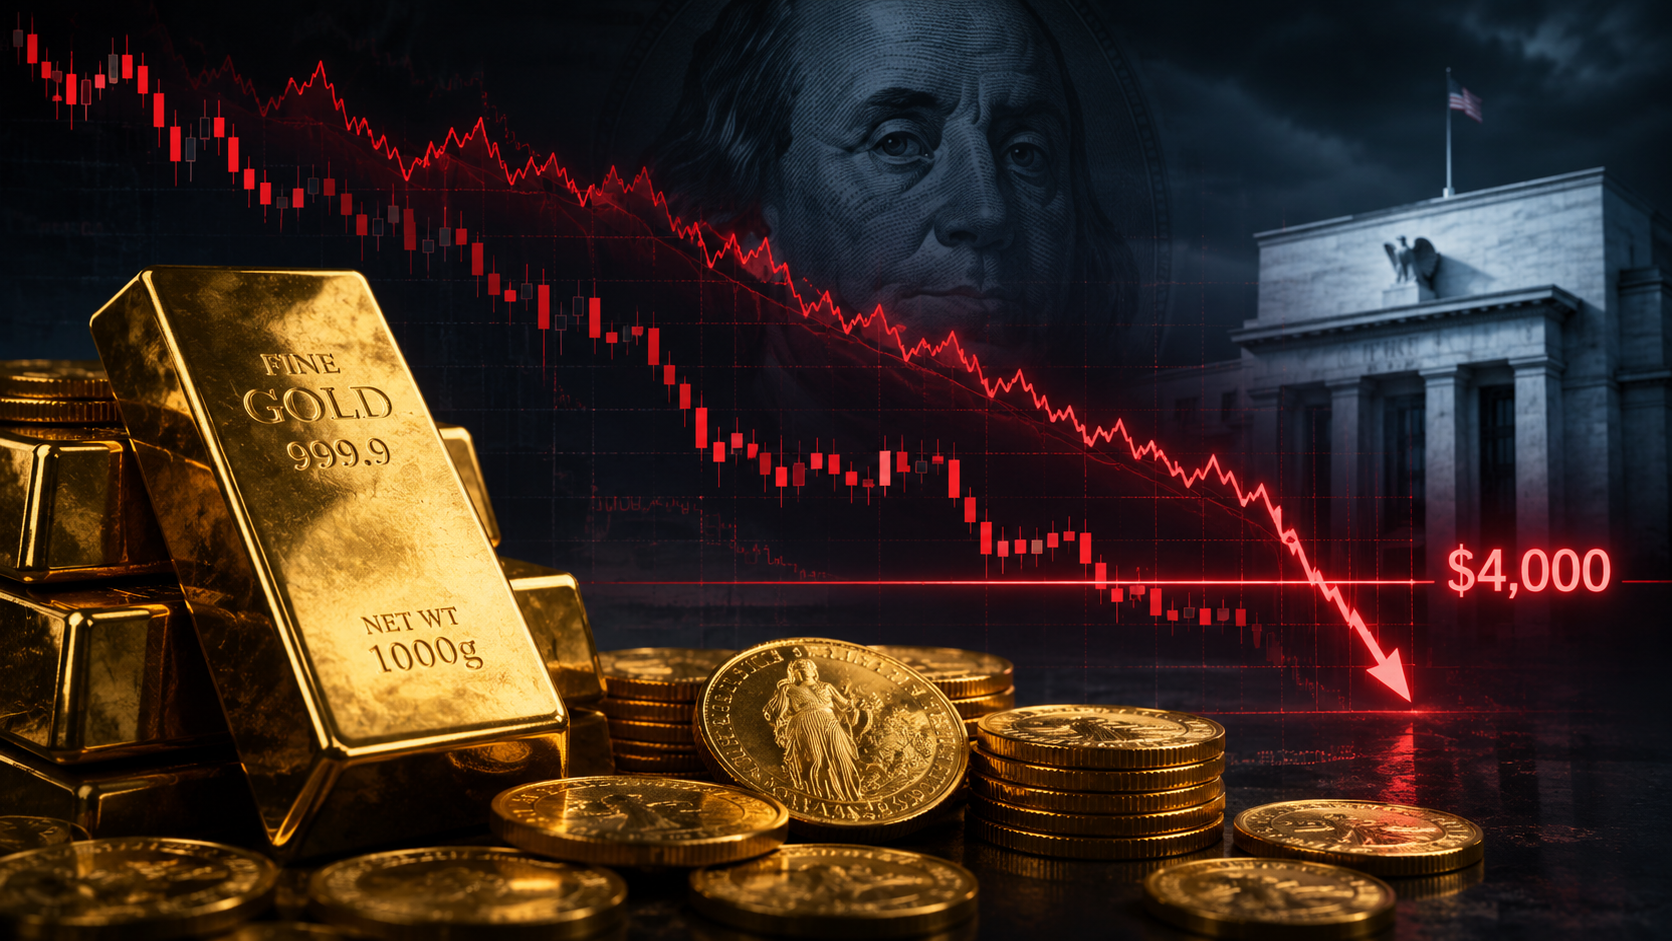
Gold fell below $4,000 per ounce as a stronger U.S. dollar, rising Fed rate-hike expectations, weaker ETF demand, and profit-taking pressured the precious metals market. The move is important because $4,000 had become a key psychological support level after gold’s earlier rally. Investors are now watching Fed signals, real yields, ETF flows, and dollar strength to judge whether the drop is only a short-term correction or the start of a deeper pullback. This shift also matters for digital-asset investors because macro liquidity and dollar strength can influence Bitcoin live price movement alongside traditional safe-haven assets.
Gold still has long-term support from central-bank buying, inflation risk, debt concerns, and geopolitical uncertainty. However, short-term momentum has weakened. A stronger recovery may need softer inflation data, a weaker dollar, renewed ETF inflows, and a clear move back above $4,000.
Overview
-
Gold broke below $4,000 per ounce, turning a key psychological support level into an important resistance zone for traders.
-
The selloff was driven by a stronger U.S. dollar, Fed rate-hike bets, weaker ETF demand, and profit-taking after gold’s earlier record rally.
-
Latest data showed spot gold around $3,991.49 per ounce, while U.S. gold futures traded near $4,007.30, keeping the market close to the $4,000 level.
-
Gold was down about 4% for the week, putting bullion on track for a fourth straight weekly loss as traders priced in more Fed tightening risk.
-
Bitcoin was also pressured by the same macro environment, trading near $59,813 after touching an intraday low near $58,189, showing that gold’s move has indirectly affected hard-asset sentiment.
Why Gold Fell Below $4,000: Strong Dollar, Fed Rate-Hike Bets, and Weak ETF Demand
Gold’s drop below $4,000 per ounce has become one of the most important precious metals market moves of 2026 because it shows how quickly investor sentiment can change when macro conditions turn against non-yielding assets. The latest gold data showed spot gold around $3,991.49 per ounce, while U.S. gold futures traded near $4,007.30 after bullion briefly broke below $4,000 for the first time since November 2025. This move was important because $4,000 had become a major psychological support level during gold’s earlier rally. Once that level broke, traders started watching whether the decline was only a short-term shakeout or the beginning of a deeper correction. The selloff was not caused by one single factor. It came from a combination of U.S. dollar strength, rising Federal Reserve rate-hike expectations, weaker gold ETF demand, profit-taking after a record rally, and a broader rotation away from defensive assets.
How a Strong U.S. Dollar Pressured Gold Prices
The stronger U.S. dollar was one of the biggest reasons gold fell below $4,000. Because gold is priced in dollars, a stronger dollar makes bullion more expensive for buyers using other currencies. This can reduce demand from international investors, central banks, jewelry buyers, and physical gold markets, especially in regions where local currencies are already under pressure. The dollar has been supported by expectations that U.S. interest rates may remain higher for longer, making dollar-linked assets more attractive compared with non-yielding assets such as gold. That move created direct pressure on bullion because investors often reduce exposure to dollar-denominated metals when the dollar becomes stronger. In simple terms, gold lost part of its appeal because the dollar itself became a stronger defensive asset.
Why Fed Rate-Hike Bets Hurt Gold Demand
Rising expectations of another Federal Reserve rate hike also weakened gold demand. Gold does not pay interest, so it usually performs better when interest rates are low or when markets expect rate cuts. But when traders begin pricing in higher rates, cash, Treasury bills, and bonds become more attractive because they offer yield. Reuters reported that traders were pricing in a 64% chance of a September Fed hike, which increased the opportunity cost of holding bullion. This matters because investors must compare gold with assets that can generate income in a higher-rate environment. If inflation remains sticky and the Fed keeps a hawkish tone, gold may continue to face pressure. For gold to recover strongly, investors may need to see softer inflation data or clearer signs that the Fed will not tighten policy further.
How Weak Gold ETF Demand Added Selling Pressure
Weak demand from gold-backed ETFs added another layer of selling pressure. Gold ETFs played an important role in the earlier rally because they allowed institutional and retail investors to gain exposure to bullion without holding physical gold. However, when ETF inflows slow or turn into outflows, gold loses an important source of investment demand. Reuters reported that gold ETFs could face fresh outflows if investors continue increasing bets on Fed tightening. This is important because ETF flows often reflect fast-moving market sentiment. If investors believe higher rates will last longer, they may reduce ETF exposure and move capital into cash, bonds, or other yield-bearing assets. If ETF demand stays weak, gold may struggle to recover quickly even if central-bank buying remains supportive in the background.
Why Market Rotation Weighed on Gold’s Safe-Haven Appeal
The decline also shows a broader shift in investor behavior. Some capital has moved toward assets linked to growth, technology, and AI, while defensive assets such as gold have faced more pressure. This rotation does not mean investors have completely abandoned gold, but it does show that short-term demand has weakened as traders search for better returns elsewhere. Gold still has long-term support from inflation risk, debt concerns, geopolitical uncertainty, and central-bank buying. However, the latest selloff shows that those factors are not always enough when the dollar is strong and Fed expectations turn hawkish. For now, gold’s next move depends on whether inflation data cools, whether the dollar weakens, whether ETF demand improves, and whether buyers can push gold back above the $4,000 level.
Gold Price Outlook After the $4,000 Breakdown: Key Support Levels, Rebound Risks, and Market Signals
Gold’s outlook is now more balanced than it was during the earlier rally. The market is no longer being driven only by safe-haven demand. Traders are watching technical support, Fed expectations, ETF flows, real yields, and the U.S. dollar at the same time. This is similar to how investors study broader Bitcoin market cycles, where liquidity, interest-rate expectations, and risk appetite can change momentum quickly. Gold must now prove whether the move below $4,000 was a temporary shakeout or the start of a deeper correction.
-
$4,000 Resistance Zone: The first level to watch is $4,000 itself. Before the breakdown, this level acted as psychological support. Now it may become resistance. If gold quickly moves back above $4,000 and holds there, traders may treat the decline as a temporary breakdown caused by crowded positioning and short-term panic. But if gold repeatedly fails near that level, sellers may use rebounds as exit opportunities. That would make the recovery slower and keep the market in a weaker trading range.
-
Immediate Support Near $3,950–$3,970: The next short-term support range sits near $3,950 to $3,970. This zone is important because it is close to where buyers may try to stabilize the market after the sharp decline. If gold holds this area, it could build the base for a tactical rebound. If it breaks clearly below this range, traders may see it as a sign that buyers are still weak, opening the door to deeper downside targets.
-
Deeper Support Around $3,850–$3,900: If near-term support fails, the next important area could be around $3,850 to $3,900. This zone may attract longer-term buyers who believe the correction has already priced in much of the dollar and Fed pressure. However, technical support works best when the macro background improves. If the dollar remains strong and rate-hike expectations continue rising, buyers may stay cautious even at lower prices.
-
Tactical Rebound Risk: A short-term rebound is possible because gold has already fallen sharply from its January high near $5,594.82 per ounce. Fast selloffs can create oversold conditions, short-covering, and dip-buying from traders looking for a quick recovery. However, a rebound is not the same as a confirmed trend reversal. For a stronger recovery, gold likely needs to reclaim $4,000, see the dollar lose momentum, and attract renewed ETF or institutional demand.
-
Fed and Inflation Signals: The Federal Reserve outlook remains the most important macro factor for gold. If upcoming inflation data supports more tightening, gold may stay under pressure because higher rates make yield-bearing assets more attractive. If inflation cools, gold could stabilize as markets reduce Fed rate-hike expectations. This is why inflation data, Fed speeches, bond yields, and dollar movement are now the main signals for traders watching the next gold price move.
-
ETF Flows and Investor Confidence: ETF flows will show whether investors are buying the dip or stepping aside. Renewed inflows would suggest that investors still believe in gold’s medium-term upside. Continued outflows would show caution and could limit any rebound. Physical demand and central-bank buying may still support gold over the long term, but ETF flows are more important for short-term momentum because they reflect fast-moving investment demand.
-
Bullish and Bearish Scenarios: The bullish scenario is that gold reclaims $4,000, the dollar weakens, inflation data softens, and ETF demand improves. That would suggest the breakdown was temporary and that gold can rebuild momentum. The bearish scenario is that gold fails below $4,000, loses support near $3,950–$3,970, and moves toward $3,850–$3,900. In that case, the market may need more time to reset before buyers return with confidence.
What the Gold Selloff Means for Precious Metals, Stocks, and Crypto
Gold’s drop below $4,000 is not only a precious metals story. It also reflects a wider change in market positioning. When the dollar rises and investors expect higher rates, assets that do not produce income often come under pressure. This can affect gold, silver, Bitcoin, and other hard-asset trades at the same time. The latest move shows that markets are becoming more sensitive to liquidity, real yields, and central-bank policy.
For silver, the pressure may be stronger because silver usually moves more sharply than gold. It has both investment demand and industrial demand, so it can weaken when precious metals sentiment turns negative and when investors become uncertain about growth. If gold remains below $4,000, silver may struggle to recover quickly. But if gold stabilizes and the dollar weakens, silver could rebound faster because it tends to react more aggressively to changes in sentiment.
For crypto, gold’s move is important because Bitcoin has recently been influenced by the same macro forces, although indirectly. Gold does not directly control Bitcoin’s price, but both assets can react when traders reduce exposure to non-yielding or hard-asset trades. As gold struggled around the $4,000 level, Bitcoin also came under pressure, recently trading near $59,813 after touching an intraday low near $58,189. This suggests investors are watching gold, Bitcoin, the U.S. dollar, bond yields, and Fed expectations together to judge whether the latest weakness is part of a broader macro reset.
For stocks, the message is more mixed. Some investors are moving toward growth sectors such as technology and AI, especially where earnings expectations remain strong. That rotation can reduce demand for defensive assets like gold. However, if higher rates begin to hurt broader risk appetite, gold could regain safe-haven demand later. This creates a two-sided market: growth optimism can pressure gold, but financial stress can bring buyers back.The biggest lesson is that macro volatility can move several markets at the same time. Gold, silver, and crypto can all react sharply when the dollar strengthens, yields rise, or Fed expectations shift. That is why position sizing, stop-loss planning, and risk management in crypto trading matter when markets move quickly across asset classes.
Conclusion
Gold’s fall below $4,000 per ounce marks a major turning point for the precious metals market. The decline was driven by a stronger U.S. dollar, rising Fed rate-hike expectations, weaker ETF demand, profit-taking after a record rally, and broader capital rotation toward yield-bearing or growth-linked assets. The move has also changed the technical picture because $4,000 is no longer just support. It is now the level gold must reclaim to rebuild confidence. The outlook depends on a few clear signals. Gold needs softer inflation data, a weaker dollar, improved ETF demand, and stronger buying near support levels to recover in a sustainable way. If those signals appear, the $4,000 breakdown may become a temporary correction within a longer-term bullish market. If they do not, gold could remain under pressure and test deeper support near $3,850 to $3,900.
For now, gold is in a transition phase. The long-term case still has support from inflation risk, debt concerns, geopolitical uncertainty, and central-bank buying. But the short-term market is being controlled by Fed expectations, dollar strength, ETF flows, and technical price action. Bitcoin’s recent pressure also shows that gold’s breakdown can indirectly affect digital-asset sentiment when investors react to the same macro forces.
FAQs
1. Why did gold fall below $4,000 per ounce?
Gold fell below $4,000 per ounce because several macro pressures hit the market at the same time. A stronger U.S. dollar made gold more expensive for international buyers, while rising Federal Reserve rate-hike expectations increased the appeal of yield-bearing assets such as cash, Treasury bills, and bonds. Weak gold ETF demand and profit-taking after gold’s earlier record rally also added selling pressure.
2. Is gold still a safe-haven asset after falling below $4,000?
Yes, gold can still act as a safe-haven asset, but its price can fall when the macro environment turns against it. Gold often benefits from inflation risk, geopolitical uncertainty, debt concerns, and central-bank buying. However, when the U.S. dollar strengthens and interest-rate expectations rise, gold can weaken because it does not pay yield.
3. What does the $4,000 gold price level mean?
The $4,000 per ounce level is important because it is a major psychological and technical price zone. When gold was above $4,000, traders viewed it as a sign of market strength. After the breakdown, the same level may become resistance. If gold recovers above $4,000 and holds there, sentiment could improve. If it fails, sellers may remain in control.
4. How does a stronger U.S. dollar affect gold prices?
A stronger U.S. dollar usually pressures gold prices because gold is priced in dollars. When the dollar rises, gold becomes more expensive for buyers using other currencies, which can reduce global demand. Dollar strength can also make investors prefer cash or dollar-linked assets instead of non-yielding assets like gold.
5. Why do Fed rate-hike expectations hurt gold?
Fed rate-hike expectations hurt gold because higher interest rates increase the opportunity cost of holding bullion. Gold does not pay interest or dividends, while cash, Treasury bills, and bonds can offer yield. When investors expect rates to stay high or move higher, some may reduce gold exposure and move toward income-generating assets.
6. What role do gold ETFs play in gold price movements?
Gold ETFs can influence prices because they reflect investment demand from institutions and retail investors. When gold ETF inflows are strong, they can support bullion prices by adding buying pressure. When inflows slow or turn into outflows, gold loses an important source of demand, which can make price recoveries harder.
7. Can gold rebound after breaking below $4,000?
Gold can rebound after breaking below $4,000, but a stronger recovery likely needs confirmation from several signals. Traders will watch whether gold can reclaim $4,000, whether the U.S. dollar weakens, whether inflation data reduces Fed rate-hike expectations, and whether gold ETF demand improves. Without those signals, any rebound may remain short-term.
8. What are the next key support levels for gold?
After the $4,000 breakdown, traders may watch the $3,950–$3,970 range as near-term support. If that area fails, deeper support could appear around $3,850–$3,900. These levels are important, but they should be viewed together with macro signals such as the dollar, bond yields, inflation data, and ETF flows.
9. Did gold’s decline influence Bitcoin?
Yes, Bitcoin appears to have been influenced indirectly by the same macro forces behind gold’s decline. Gold does not directly control Bitcoin, but both assets can weaken when the U.S. dollar strengthens, Fed rate-hike expectations rise, liquidity tightens, and investors reduce exposure to hard-asset or inflation-hedge trades.
10. Is the gold bull market over?
Gold’s break below $4,000 does not automatically mean the long-term bull market is over. It does show that short-term momentum has weakened. The long-term outlook depends on whether inflation risk, central-bank demand, geopolitical uncertainty, and debt concerns remain strong enough to offset dollar strength and higher interest-rate expectations.
Disclaimer: This article is for informational and educational purposes only. It is not financial advice, investment advice, or a recommendation to buy or sell gold, ETFs, futures, crypto, or any other financial asset. Markets are volatile, and readers should do their own research before making investment decisions.