
Top 5 Crypto Technical Indicators Every Trader Should Know
2026/05/15 18:03:02
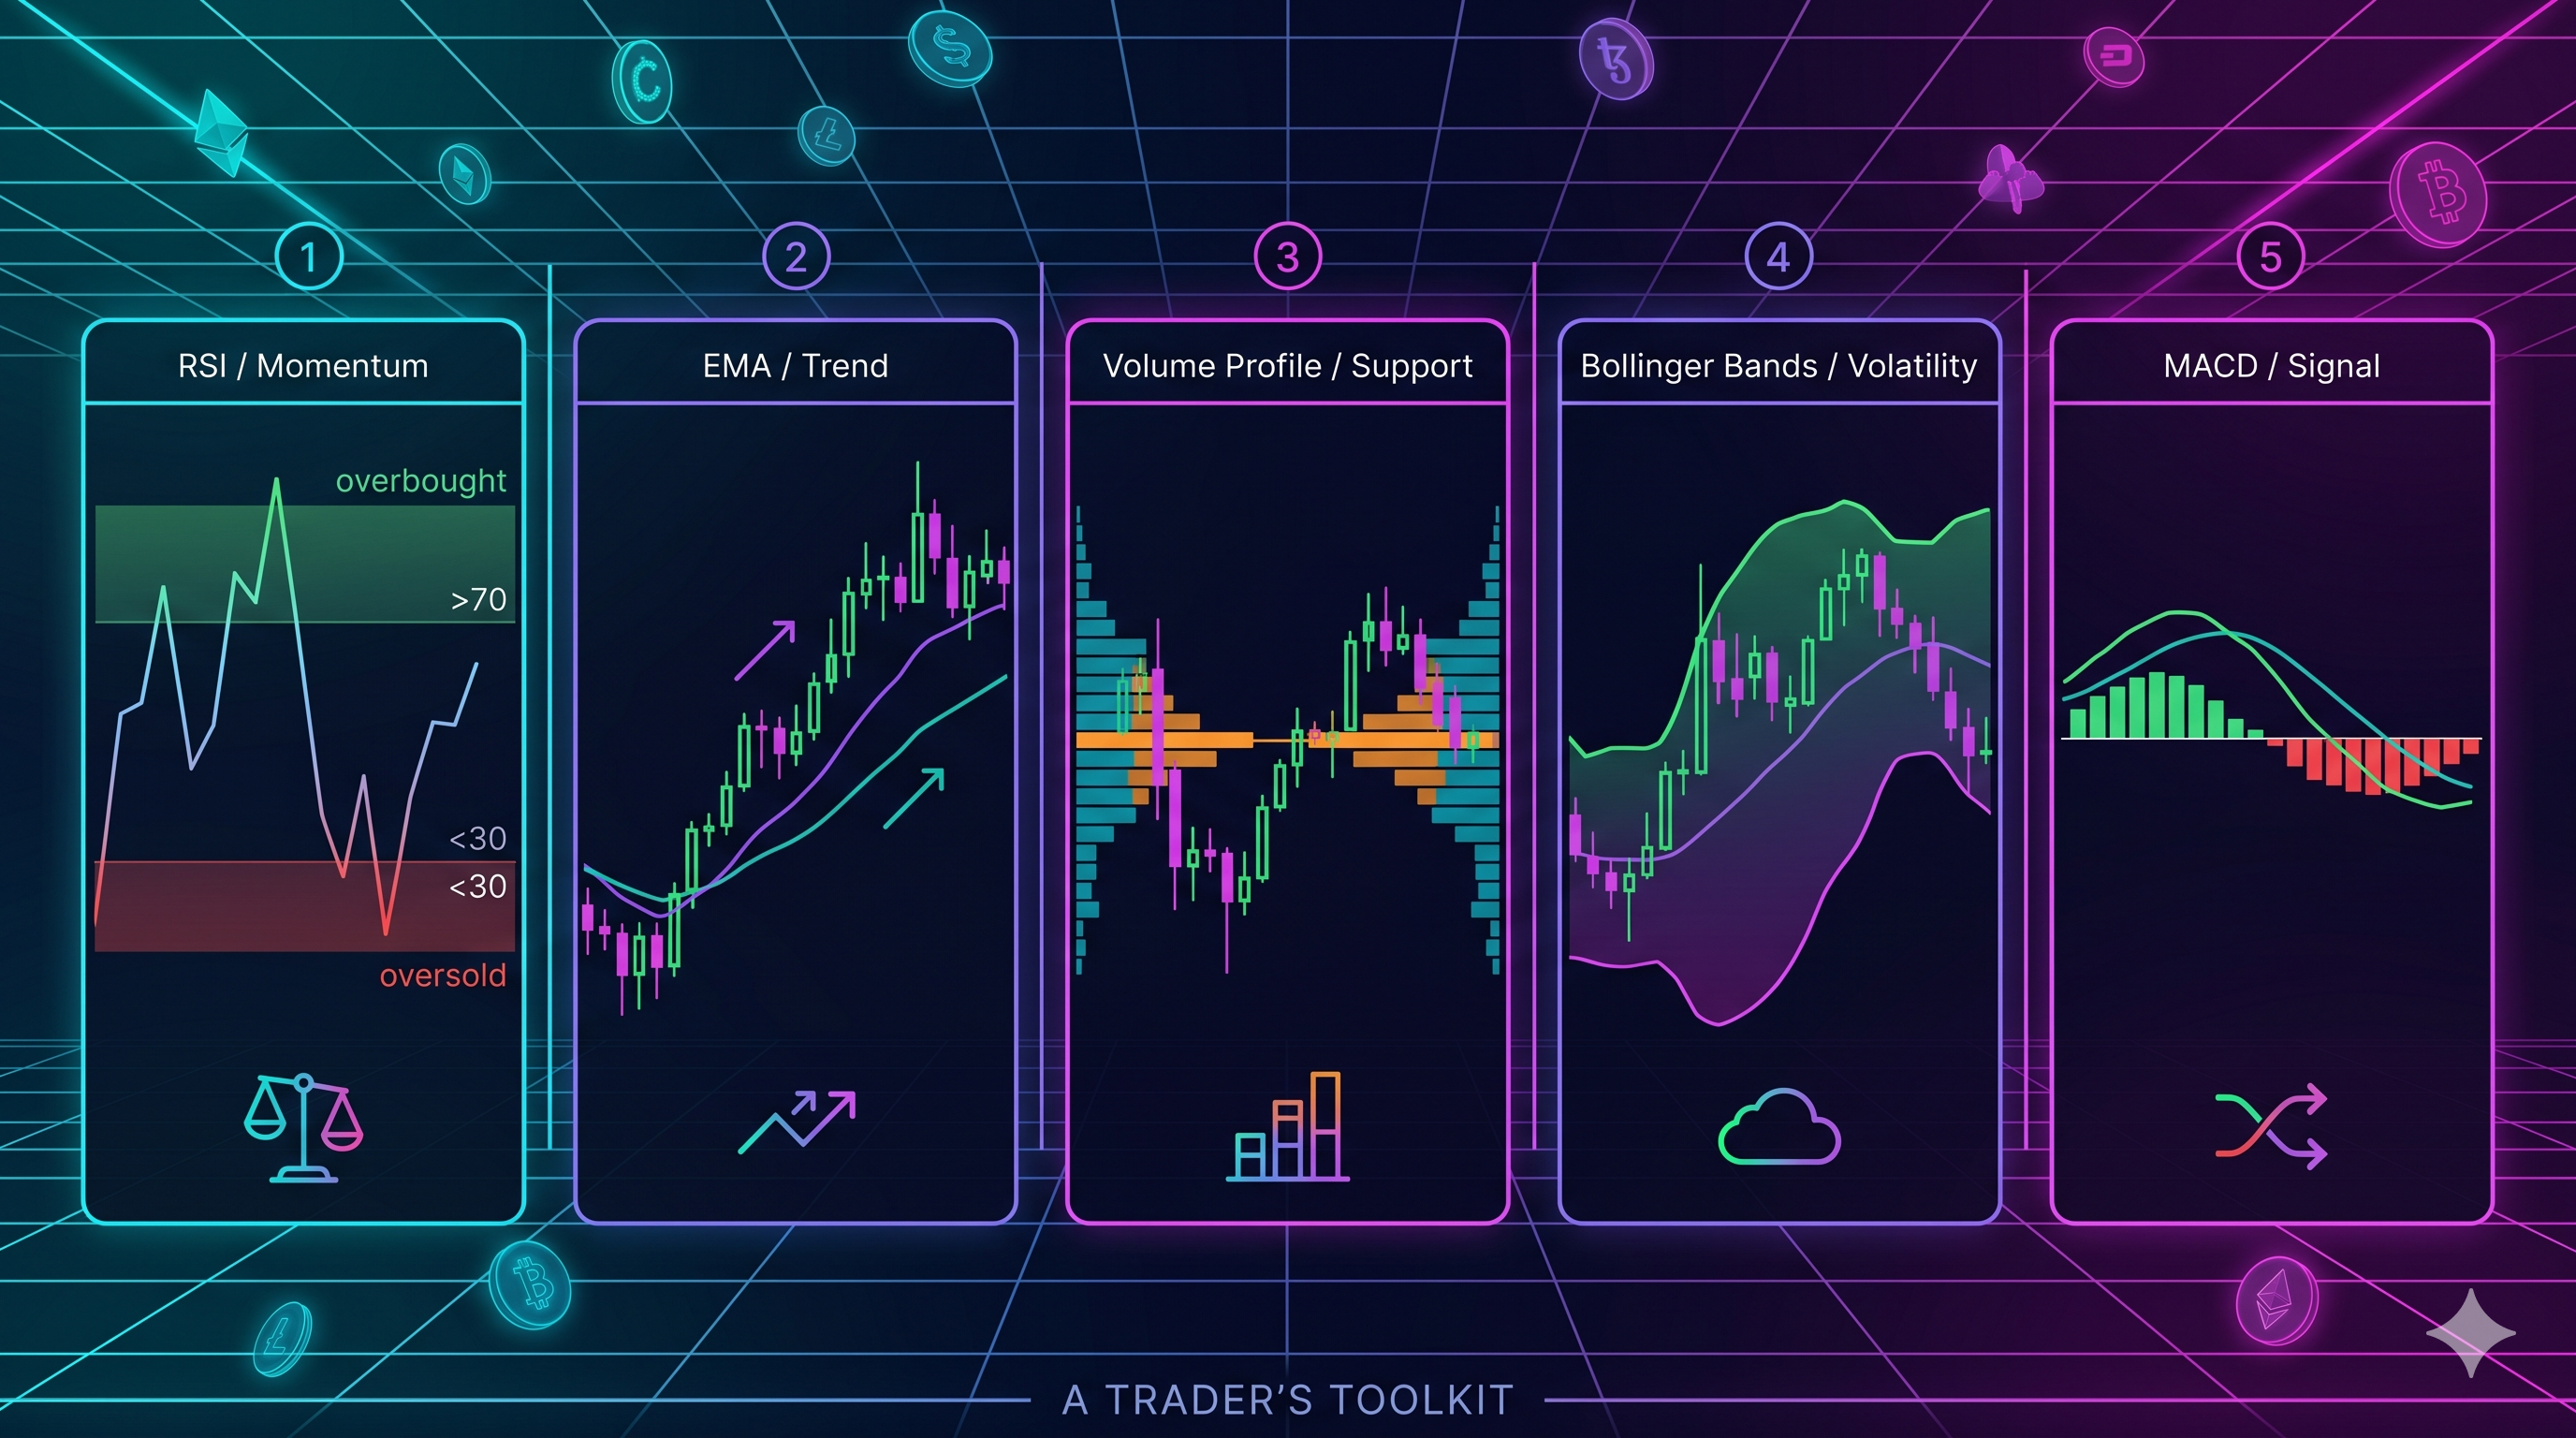
As of today, the total notional volume for crypto derivatives has skyrocketed past $7.3 trillion, signaling a market that is more liquid—and more complex—than ever before. With Bitcoin consistently testing the $80,000 to $85,000 resistance zone and the Solana "Alpenglow" upgrade revolutionizing high-frequency on-chain data, the difference between a profitable trade and a liquidation often comes down to the tools on your screen. The top 5 technical indicators every trader must master in 2026 are the Relative Strength Index (RSI), Exponential Moving Averages (EMA), Volume Profile, Bollinger Bands, and the MACD (Moving Average Convergence Divergence). While old-school charting used these as simple "buy/sell" signals, modern 2026 trading requires a nuanced approach that combines these indicators with institutional liquidity zones and AI-driven market sentiment. Whether you are navigating Bitcoin's post-halving supply crunch or Solana's high-speed ecosystem growth, these five tools provide the structural clarity needed to identify high-probability entries. This guide delivers the latest parameters and data-backed strategies used by professional desks in the current May 2026 trading environment.
Key Takeaways
-
RSI Divergence Over Overbought/Oversold: In 2026's volatile regime, RSI is best used to spot "hidden" momentum shifts through divergence rather than just static 70/30 levels.
-
The Power of EMA 200: The 200-period Exponential Moving Average remains the "ultimate" line in the sand for Bitcoin’s macro trend, currently acting as a pivot point near $83,000.
-
Volume as Confirmation: Institutional participation makes Volume Profile essential; a breakout without a significant volume spike is now considered a high-risk "fakeout."
-
Volatility Squeezes: Bollinger Bands are the primary tool for predicting the explosive moves common in the current "Alpenglow" era of rapid network upgrades.
-
Hybrid Indicator Use: Successful 2026 traders use a "Confluence" model, never entering a trade unless at least three of these indicators align with market structure.
-
Relative Strength Index (RSI): Spotting Reversals in the "Alpenglow" Era
In May 2026, the Relative Strength Index (RSI) is the most reliable tool for identifying price exhaustion, particularly when used to find bullish or bearish divergences. While the classic interpretation suggests buying at 30 (oversold) and selling at 70 (overbought), the high-velocity 2026 market often sees assets stay in "extreme" zones for weeks during a strong trend.
For example, during Bitcoin’s climb to $83,000 in early May, we observed a "Bearish Divergence": while price made a higher high, the RSI made a lower high. This signaled that buying momentum was thinning despite the rising price, accurately predicting the subsequent $1,000 pullback to the $81,400 level.
Mastering RSI Divergence
Traders should focus on the 14-period RSI on the 4-hour and Daily timeframes.
-
Bullish Divergence: Occurs when the price hits a "Lower Low," but the RSI forms a "Higher Low."() This suggests sellers are losing power.
-
Bearish Divergence: Occurs when the price hits a "Higher High," but the RSI forms a "Lower High." This warns that the rally is losing steam.
-
Exponential Moving Averages (EMA): Finding the Macro Trend
The 50-day and 200-day EMAs are the most critical support and resistance levels for Bitcoin and Solana in 2026, acting as the "gravity" for the entire market. Unlike simple moving averages, EMAs place more weight on recent price data, making them far more responsive to the rapid-fire news cycles of 2026, such as the implementation of the US "Clarity Act" or major ETF inflow shifts.
As of mid-May 2026, the Bitcoin (BTC) price is hovering near the EMA 200 (red line), which is currently situated around $83,000. Historically, a clean daily close above this level has preceded a move toward the psychological $90,000 barrier. Conversely, the $79,000 to $80,000 zone—once a major resistance—now aligns with the EMA 50, providing a "safety net" for traders during short-term pullbacks.
| Moving Average | Current Significance (May 2026) | Market Action |
| EMA 50 | Short-term Trend Health | Buy the dip if price holds above |
| EMA 200 | Macro Bull/Bear Pivot | Major breakout or rejection point |
| EMA 12/26 | Momentum Crossover | Used for entry/exit timing |
-
Volume Profile: Following Institutional "Smart Money"
In 2026, Volume is the ultimate filter for truth; if a price breakout occurs without a corresponding spike in volume, it is statistically likely to fail. With Bitcoin ETF assets now exceeding $138 billion, institutional "buy walls" and "sell walls" are clearly visible on volume profiles.
Why Volume Matters Now
Recent data from early May 2026 shows that Bitcoin's recovery toward $80,000 was supported by a massive short squeeze and high trading volume, which "validated" the move. In contrast, many altcoins have struggled because their price gains lacked volume support, leading to quick retracements. Traders use the Point of Control (POC)—the price level with the highest traded volume—to identify where "Smart Money" is most active. For Bitcoin, the current POC sits firmly in the $78,000 range.
-
Bollinger Bands: Predicting Volatility Explosions
Bollinger Bands are essential for 2026 traders to anticipate "Volatility Squeezes," which often precede massive 10-15% price candles. The bands consist of a middle EMA and two outer standard deviation lines. When the bands contract (get very narrow), it indicates a period of low volatility that usually ends in an explosive breakout.
In April 2026, we saw Solana (SOL) enter a tight Bollinger Band squeeze while trading in a $92 to $95 range. Following the announcement of the Alpenglow update, the bands expanded aggressively as SOL broke out to the upside.
-
Rule of Thumb: Never trade in the middle of the bands during a squeeze. Wait for a candle to close outside the upper or lower band to confirm the breakout direction.
-
MACD: Confirming Trend Momentum
The Moving Average Convergence Divergence (MACD) remains a staple in 2026 for confirming that a trend has truly shifted before committing large capital. The MACD measures the relationship between two EMAs (typically the 12 and 26) and provides a histogram that visualizes the strength of the trend.
Modern traders look for "Histogram Momentum Shifts." If the MACD bars are getting smaller (moving toward the zero line), it indicates that the current trend is dying. In the current May market, Ethereum (ETH) has shown a steadier institutional-style recovery, with its MACD histogram remaining consistently green, signaling a "slow and steady" accumulation phase rather than a speculative bubble.
Strategic Synthesis: Creating a 2026 Trading Checklist
The most successful 2026 traders do not use these indicators in isolation; they create a "Confluence Checklist" to filter out noise. In an era where AI bots execute trades in milliseconds, manual traders need a disciplined framework to avoid being "hunted" by liquidity algorithms.
The 3-Point Confirmation Rule:
-
Structure Check: Is the price currently at a major EMA level (like the $83,000 BTC resistance)?
-
Momentum Check: Is there an RSI divergence or a MACD crossover supporting the move?
-
Conviction Check: Is the Volume Profile showing high activity at this price level?
2026 Indicator Comparison Table
| Indicator | Indicator Type | Primary Function | Best Timeframe |
| RSI | Oscillator | Identifying Reversal Points | 4-Hour / Daily |
| EMA | Trend | Defining Market Direction | Daily / Weekly |
| Volume Profile | Activity | Confirming Institutional Interest | 1-Hour / 4-Hour |
| Bollinger Bands | Volatility | Timing Breakouts | 15-Min / 1-Hour |
| MACD | Momentum | Confirming Trend Strength | 4-Hour / Daily |
Tips: New to crypto? KuCoin's Knowledge Base has everything you need to get started.
Conclusion
The 2026 crypto landscape is defined by its maturity and the precision of its market participants. Mastering the Top 5 technical indicators—RSI, EMA, Volume Profile, Bollinger Bands, and MACD—is no longer a "pro-level" requirement; it is the fundamental baseline for any trader looking to survive Bitcoin’s $80,000 volatility and the rapid evolution of the Solana ecosystem. By moving beyond basic buy/sell signals and focusing on nuanced concepts like RSI divergence and institutional volume clusters, you can align your strategy with the "Smart Money" that currently dominates the $7.3 trillion derivatives market.
As we move through May 2026, remember that indicators are tools of probability, not certainty. The integration of high-speed network upgrades like Alpenglow and the regulatory clarity provided by the new US framework have made the markets more efficient, but also more sensitive to macro data like CPI and PCE inflation. The key to long-term profitability lies in Confluence—the ability to wait for multiple indicators to tell the same story before entering a position. Use these tools to build a disciplined, data-driven approach, and you will be well-positioned to capitalize on the remarkable resilience of digital assets in this cycle.
FAQs
Which indicator is the most accurate for day trading in 2026?
No single indicator is 100% accurate, but for intraday moves in 2026, Bollinger Bands combined with Volume Profile offer the best results. The Bands help identify potential breakout points, while Volume confirms whether the move is backed by real capital or is just a "fakeout" triggered by low-liquidity bot activity.
Should I change the default settings on these indicators for altcoins?
Generally, yes. While the default 14-period RSI works well for Bitcoin, high-volatility "mid-cap" assets like SEI or high-growth Solana tokens often require a shorter period (like 9 or 10) to catch faster momentum shifts. However, for EMAs, the 50 and 200 levels should remain standard as they are the primary levels tracked by institutional algorithms.
How does the "Alpenglow" upgrade affect technical analysis?
The Alpenglow upgrade on Solana has significantly reduced block finalization times, leading to more reliable "on-chain" data. For traders, this means technical indicators on decentralized exchanges (DEXs) now update faster and show less "lag," making indicators like the MACD more responsive on shorter timeframes (5-minute or 15-minute).
Is the RSI still useful if Bitcoin is in a permanent "Bull Run"?
Yes, but you must shift your perspective. In a strong bull market, the RSI rarely drops to 30. Instead, traders look for the RSI to find support at the 50 level. If the price pulls back but the RSI holds at 50 and bounces, it is a strong signal that the uptrend is still healthy and the "dip" is a buying opportunity.
What is the "Death Cross" and does it still matter in 2026?
The "Death Cross" occurs when the 50 EMA crosses below the 200 EMA. While it was a major bearish signal in the early 2020s, its impact has lessened in 2026 due to the high frequency of market cycles. Most professional traders now treat it as a "lagging" indicator that confirms a trend that has likely already begun, rather than a predictive tool.
Disclaimer: This article is for informational purposes only and does not constitute financial or investment advice. Cryptocurrency investments carry significant risk. Always conduct your own research before trading.