

Trading 101: Trading The Ascending and Descending Triangles Chart Patterns Like a Professional Crypto Trader in 2026
Introduction
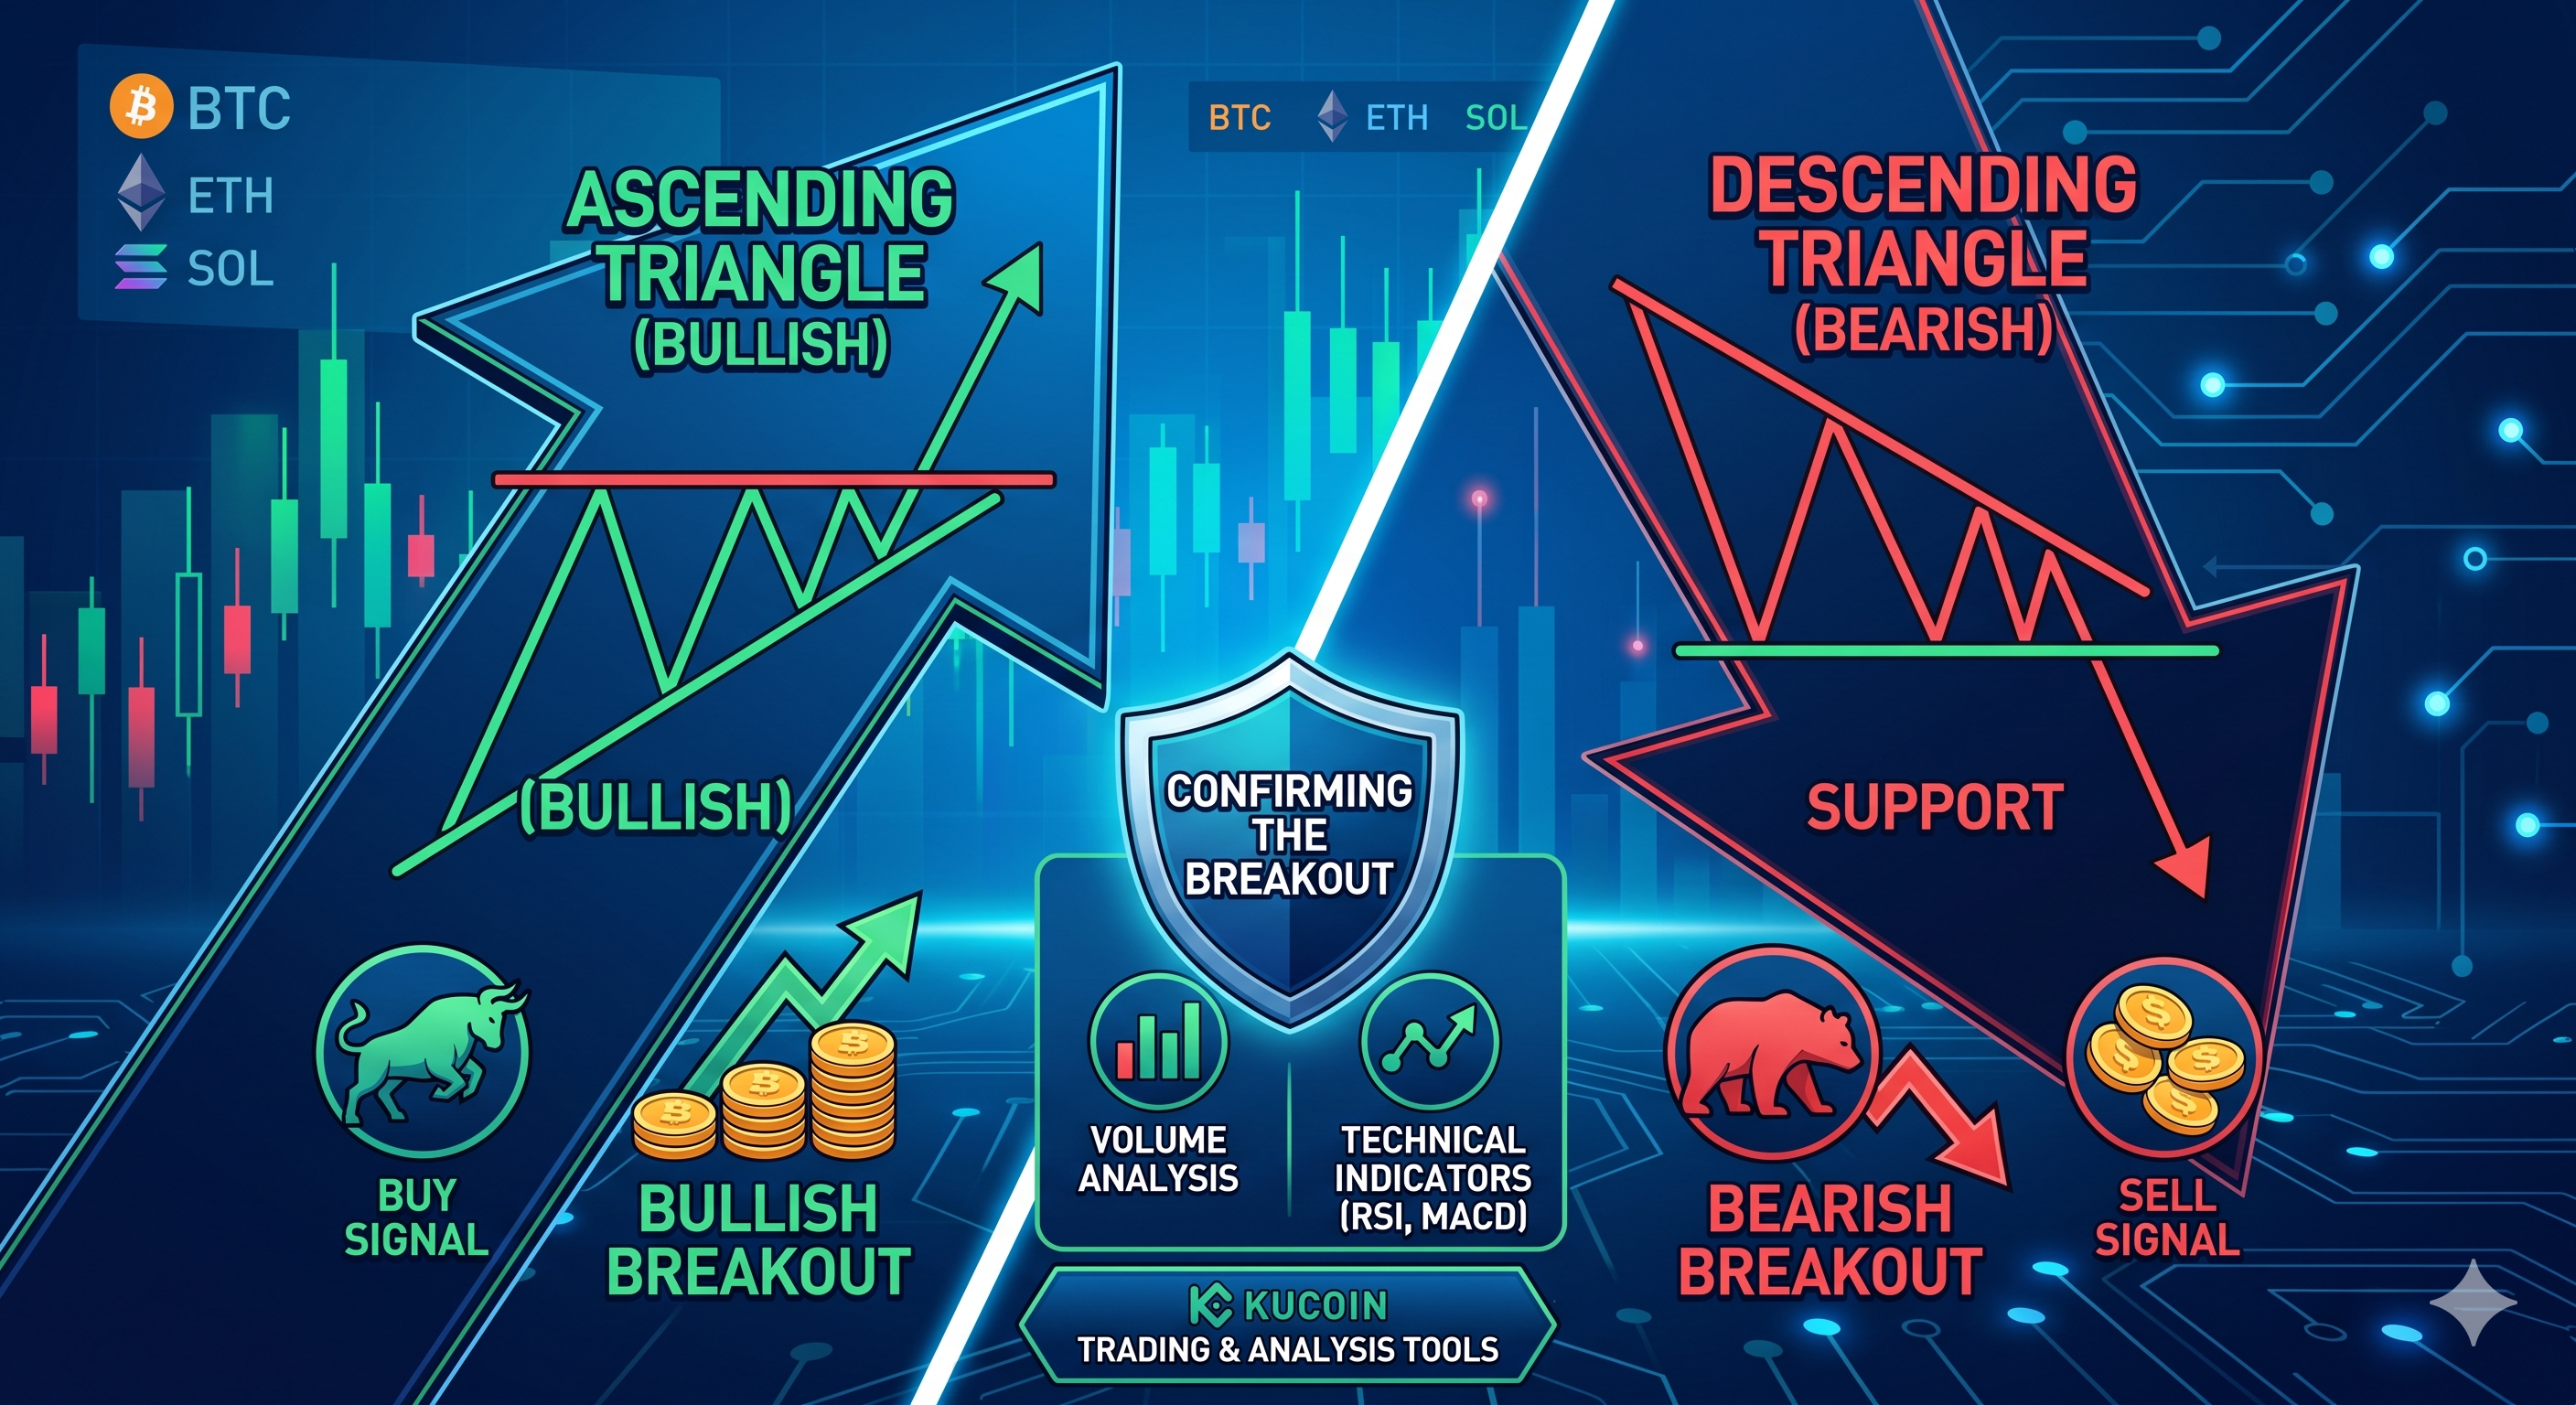
Crypto markets move fast, and identifying high-probability breakout opportunities has become one of the most important skills for active traders in 2026. Among the most widely used continuation patterns in technical analysis, ascending and descending triangles remain essential tools for spotting potential bullish and bearish breakouts before major price movements occur.
These triangle patterns help traders identify periods of price consolidation, where buyers and sellers temporarily reach equilibrium before volatility expands again. In highly liquid crypto markets such as Bitcoin, Ethereum, Solana, and meme coins, triangle breakouts are frequently used alongside volume analysis, RSI, MACD, and moving averages to confirm trading signals and reduce the risk of false breakouts.
An ascending triangle typically signals bullish continuation, showing increasing buying pressure as higher lows form against a flat resistance level. In contrast, a descending triangle often indicates bearish continuation, with sellers gradually pushing prices lower against a horizontal support zone. Understanding how these patterns work can help traders improve entry timing, manage risk more effectively, and identify potential trend continuation setups across multiple timeframes.
In this guide, we’ll explain how ascending and descending triangle patterns work, how to trade them in the crypto market, how to avoid fake breakouts, and how traders can use KuCoin charts and TradingView tools to improve technical analysis accuracy.
What is an Ascending Triangle?
This chart pattern represents bullish continuation. The ascending triangle is recognizable in the chart by rising lows and constant highs. You can draw a rising trendline connecting the higher lows and a horizontal line connecting the highs. This is how the triangle pattern is formed.
The ascending triangle has an ascending trend line as well as a horizontal resistance or support level. A breakout then leads to a signal, following the trend in the event of a breakout upwards and a trend reversal in the event of a breakout downwards.
From this pattern, the bullish significance of the formation can already be derived, as the higher lows show an increasing buying pressure or a decreasing selling pressure. Therefore, each downward price movement is shorter because the sellers are not strong enough to push the price further.
How to Trade the Ascending Triangle?
An "Ascending Triangle" is a bullish chart pattern. It shows the market in the phase of a pause during an uptrend. However, the rising swing lows are bullish clues. Keep in mind that the highs of the ascending triangle form a resistance level.
Buy in an uptrend at a breakout above an ascending triangle or a symmetrical triangle. Here's how to open a long trade:
- The market must be in a sustained uptrend
- The price forms higher lows, and high price swings do not breach the upper horizontal line
- The entry is confirmed when the price breaches the upper trendline. This shows that the bulls have regained control of the market
When the price breaches the resistance level, it becomes the support level. The long positions have a good support zone under them immediately after the breakout; this would be the best point to set up a stop loss.
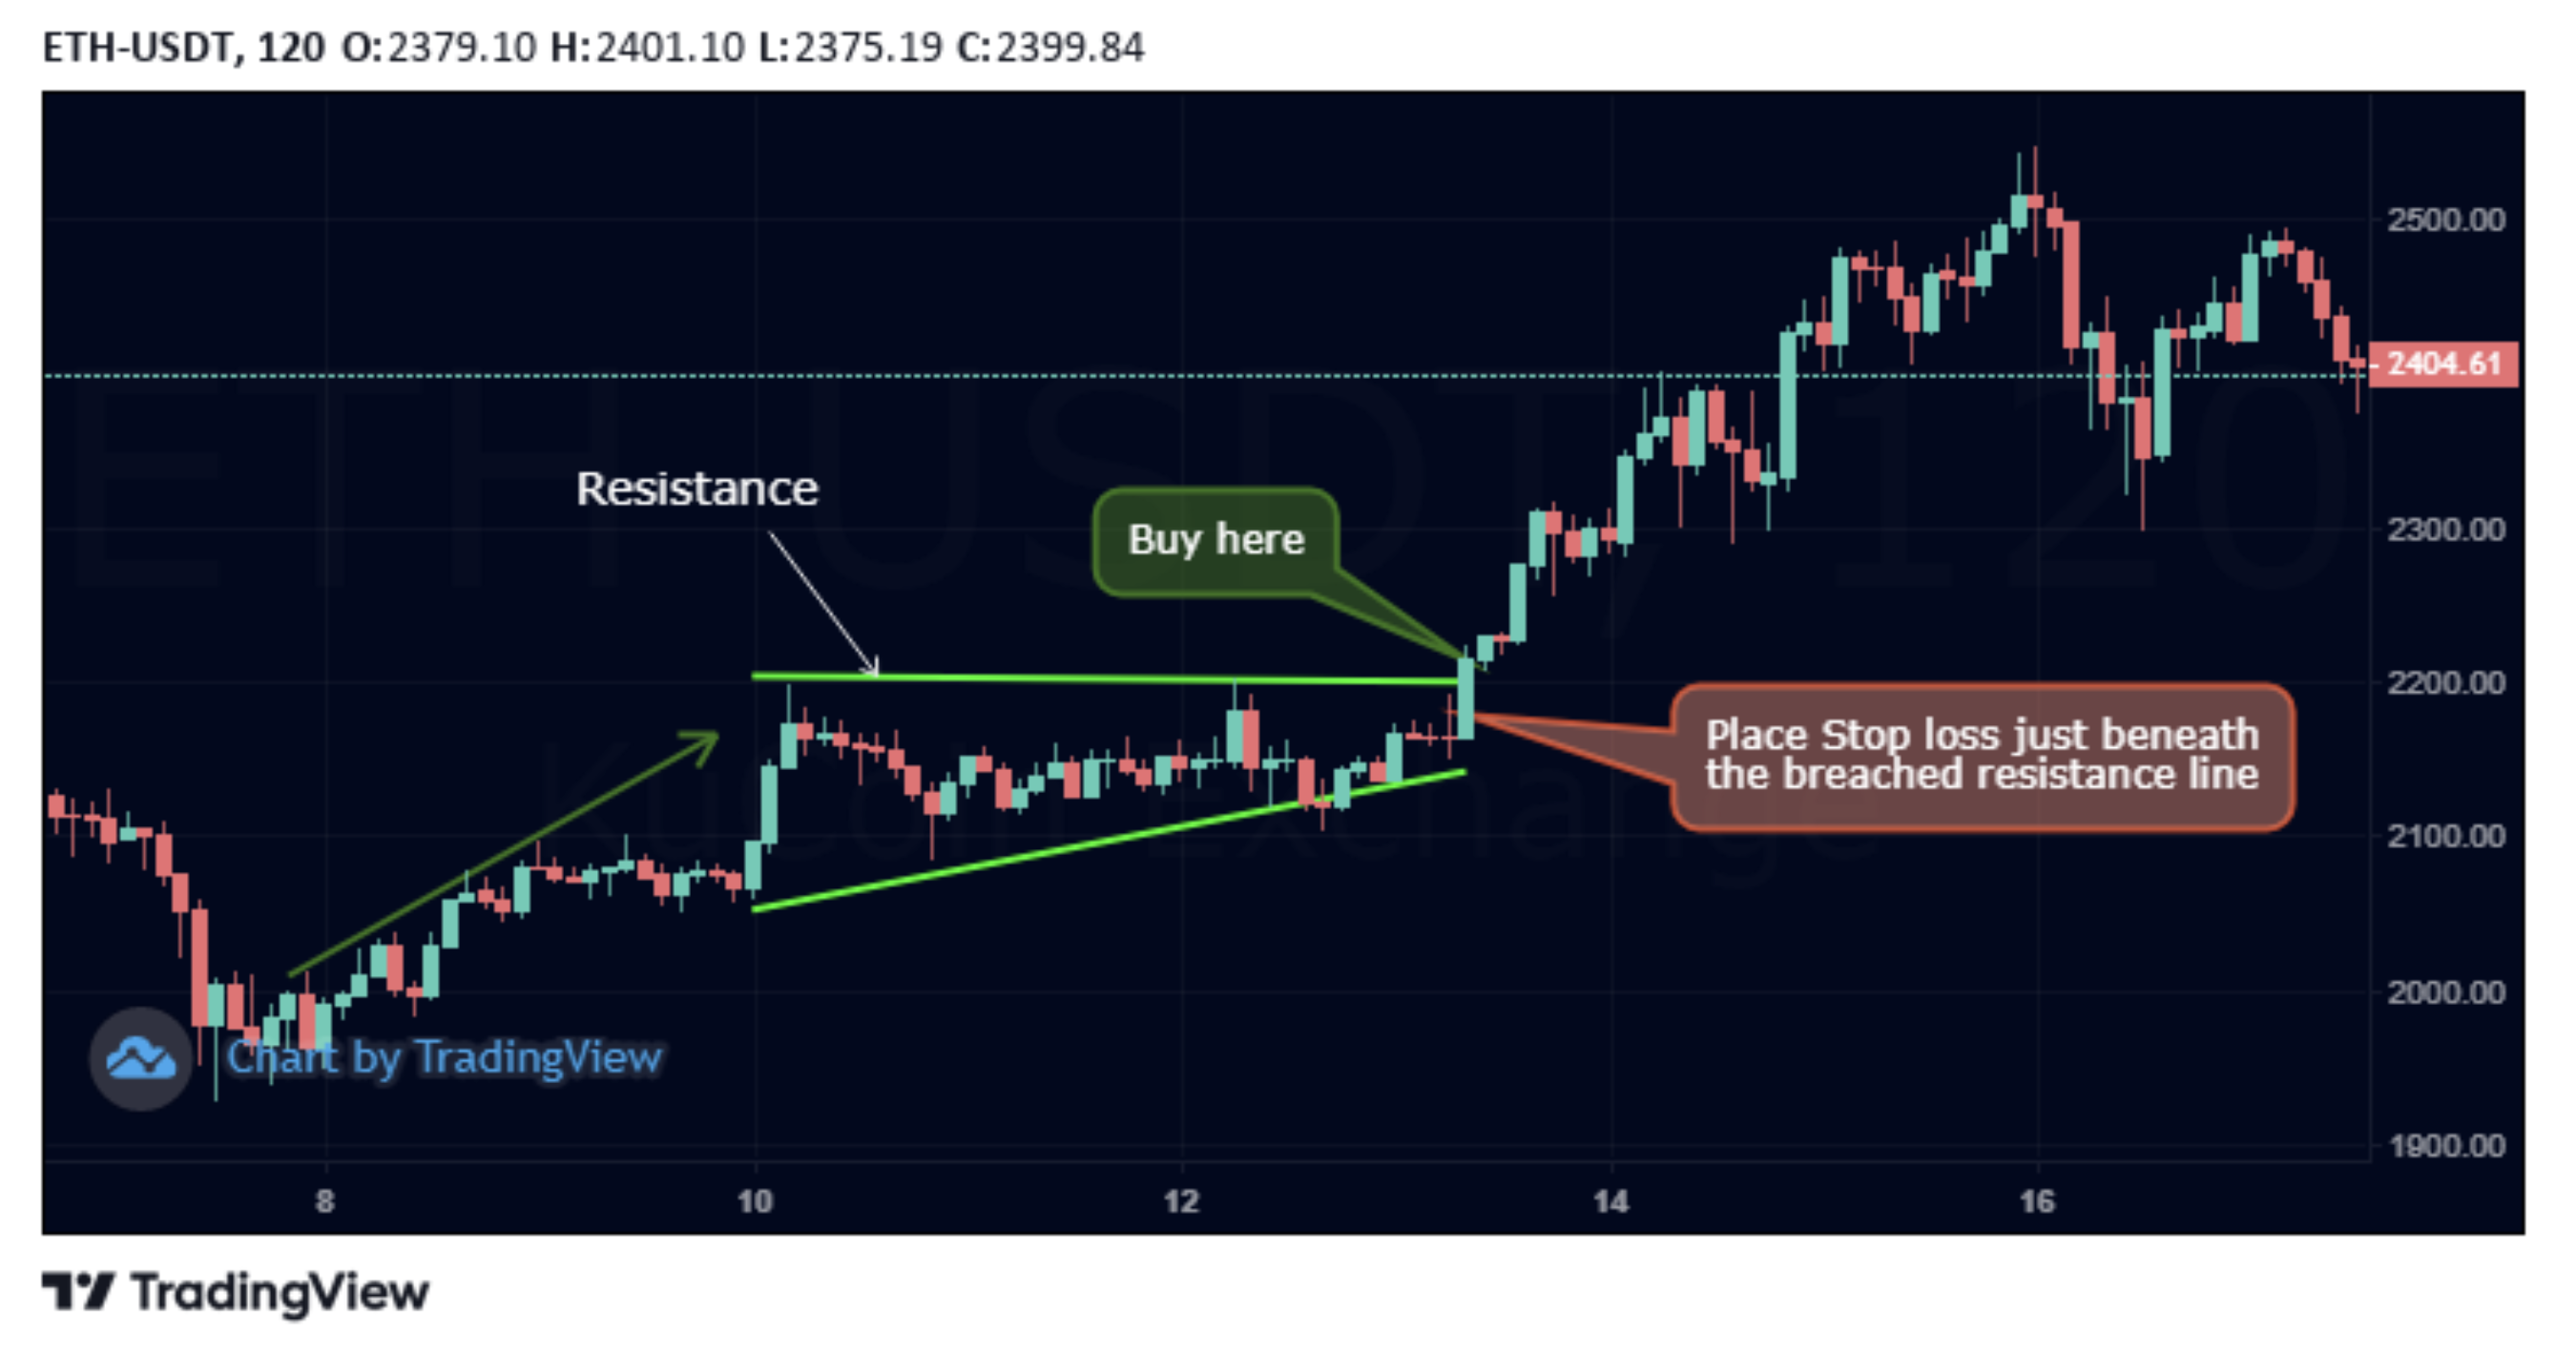
Formation of Ascending Triangle on the Ethereum Price Chart on KuCoin | Source: ETH/USDT
However, since the resistance can be strong, it is imperative to pay attention to the sustainability of the outbreak movement. High trading volume and buyers' dominance up to the closing price show that most market participants are bullish. With the breakout, the continuation of the upward trend also takes place, which is confirmed again by the formation of a new high.
If you want to trade the upward triangle, you can either place a buy stop directly above the resistance or wait for the breakout to enter via buy limit.
The latter will be placed in the region of the former resistance if the eruption has been sustainably confirmed. For this reason, an order is triggered only during a retest of the resistance. For the entry target, the triangle's height - from the lowest low of the pattern to the highs – is measured and then placed above the resistance. This ensures that you only go long when the breakout has been confirmed.
A possible stop-loss level is below the last trend low, as falling below it would mean the end of the uptrend.
Another increasingly popular strategy among crypto traders is combining ascending triangle breakouts with multi-timeframe analysis. For example, traders may identify an ascending triangle on the 1-hour chart while confirming the broader bullish trend on the daily timeframe.
This approach helps reduce noise from short-term volatility and improves the probability of successful breakout trades. Some traders also monitor Bitcoin dominance and overall crypto market sentiment before entering altcoin breakout positions, as broader market weakness can invalidate otherwise strong technical setups.
Risk management also remains critical. Even when an ascending triangle appears highly bullish, traders should avoid overleveraging positions, especially in futures trading. Using stop losses and proper position sizing helps protect trading capital during unexpected market reversals.
What is a Descending Triangle?
This is a bearish continuation pattern. It is the exact opposite of the ascending triangle. The descending triangle has a descending trend line as well as a horizontal resistance or support line. A breakout then leads to a signal, following the trend in the event of a breakout downwards and a trend reversal in the event of a breakout upwards.
This means that the sellers manage to push back the buyers earlier with each upward movement until finally the downward pressure is sufficient and a sustained breakout below the support of the lows succeeds. Again, the breakout of increased volume and (at least) a closing price below the last lows should be confirmed.
Descending triangles have become particularly useful during crypto bear markets and risk-off environments, where selling pressure dominates across the market. Traders often use this pattern to identify potential breakdown opportunities in weaker altcoins with declining trading volume and fading momentum.
However, not every descending triangle results in a bearish continuation. In some cases, strong market catalysts such as ETF approvals, institutional adoption news, or sudden Bitcoin rallies can trigger bullish reversals instead. This is why many professional traders wait for confirmation through candle closes, breakout volume, and momentum indicators before entering short positions.
In 2026, many traders also combine descending triangle analysis with on-chain data and derivatives metrics, including funding rates and liquidation heatmaps, to gain deeper insight into market positioning.
How to Trade the Descending Triangle?
When trading the descending triangle, you should short the market or take profits in day trading when a breakout occurs below a descending triangle.
Here's how to accurately identify this pattern:
- The market must be in an established bearish trend.
- The price action has lower highs with a dropping trendline connecting them. It indicates that the buying momentum is weak.
- The lower price swings are averagely near each other and can be connected with a horizontal trendline, forming a flat bottom – this is the support level.
- Bearish continuation is confirmed when the price breaks and closes below the support level.
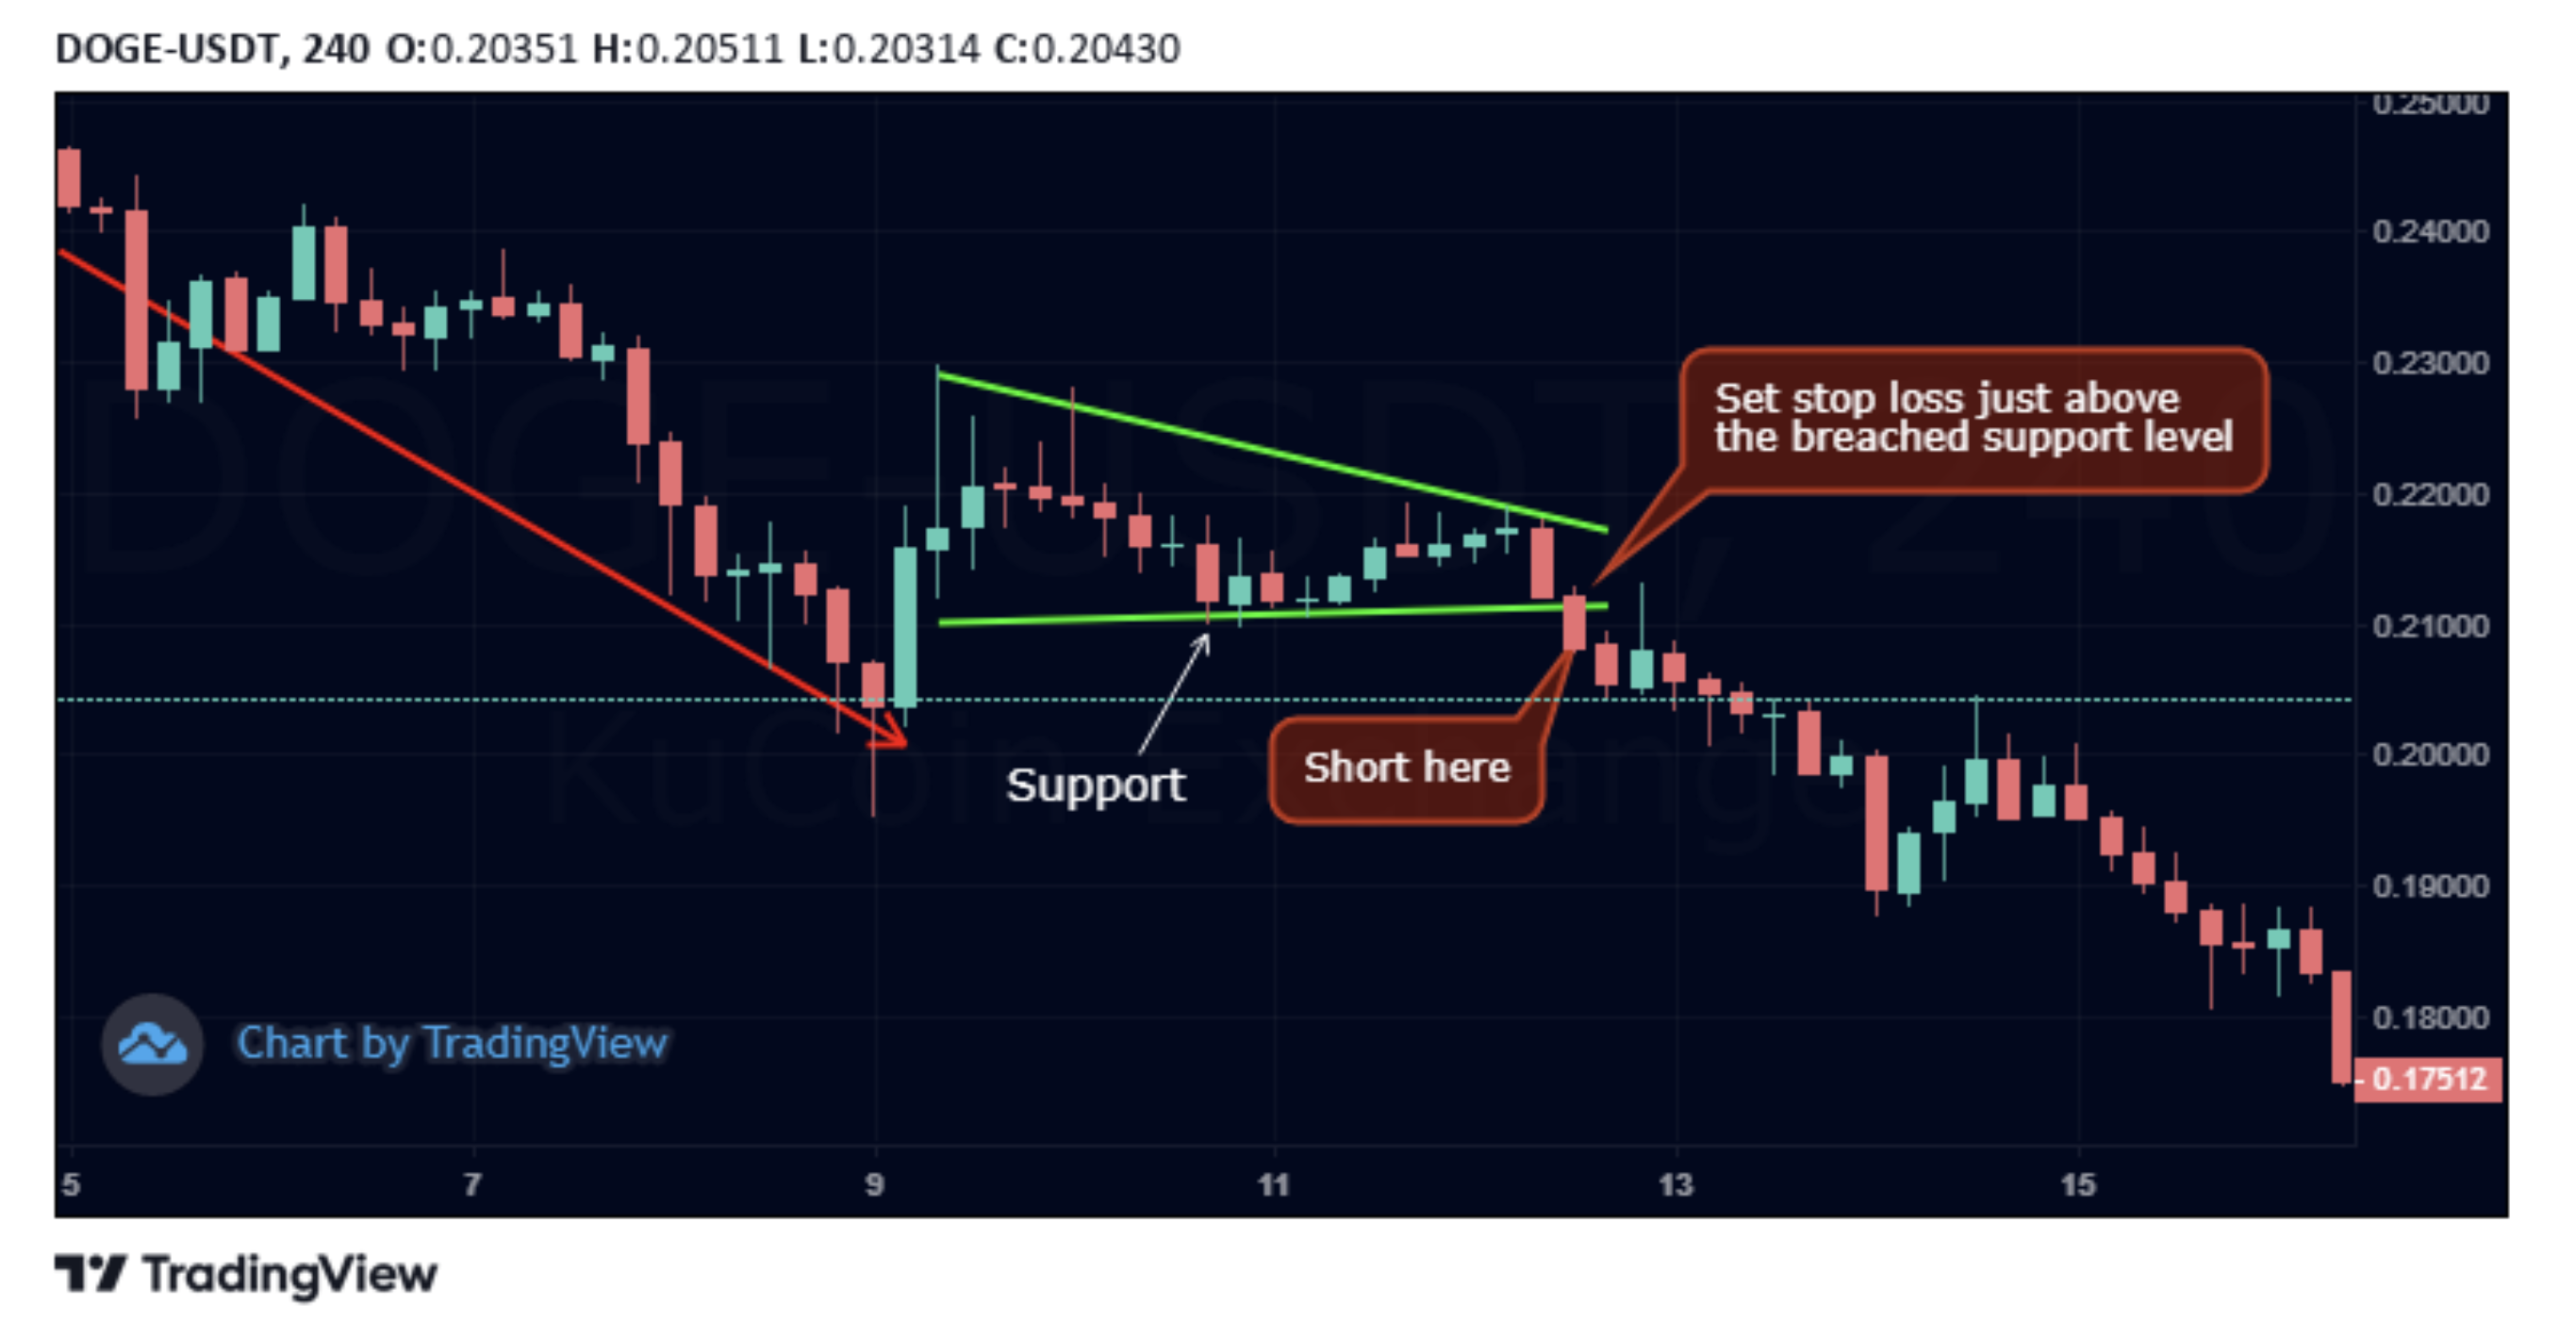
Formation of Descending Triangle on the Dogecoin Price Chart | Source: DOGE/USDT
The stop loss can be set above the last trend high. If this level is removed, the trend would eventually turn upwards.
To recap, the triangle patterns are continuation chart patterns. The ascending triangle is a bullish continuation pattern, while the descending triangle is a bearish continuation chart pattern. Always make sure to confirm the signals generated by this pattern by pairing it with any reliable technical indicators for extra accuracy.
Conclusion
Ascending and descending triangles remain among the most reliable continuation patterns in crypto technical analysis. These formations help traders identify periods of consolidation before potential breakout movements, allowing them to prepare entries, exits, and risk management strategies more effectively.
An ascending triangle generally reflects growing bullish momentum, while a descending triangle signals increasing bearish pressure. However, successful trading requires more than simply identifying chart patterns. Traders should always confirm breakouts with volume, momentum indicators, market sentiment, and higher timeframe analysis to avoid false signals.
As crypto markets continue evolving in 2026, combining classical chart patterns with modern tools such as TradingView indicators, futures open interest analysis, and on-chain data can significantly improve trading accuracy.
KuCoin provides advanced TradingView charting tools, real-time market data, and deep liquidity to help traders analyze breakout opportunities across spot and futures markets. Whether you are trading Bitcoin, Ethereum, meme coins, or emerging altcoins, mastering triangle patterns can become an important part of your crypto trading strategy.
FAQs
Are ascending triangles always bullish?
Not always. While ascending triangles are generally considered bullish continuation patterns, false breakouts can still occur. Traders should confirm the breakout using trading volume, candle close confirmation, and momentum indicators before entering a trade.
What is the difference between ascending and descending triangles?
An ascending triangle forms with higher lows and flat resistance, typically signaling bullish continuation. A descending triangle forms with lower highs and flat support, usually indicating bearish continuation.
Which timeframe works best for triangle pattern trading?
Triangle patterns can appear on all timeframes, but many traders prefer using 4-hour and daily charts because they tend to provide stronger and more reliable breakout signals compared to lower timeframes.
How can traders avoid fake breakouts in crypto?
To reduce the risk of fake breakouts, traders often wait for strong volume confirmation, candle closes above resistance or below support, and confirmation from indicators like RSI or MACD before opening positions.
Can triangle patterns be used in crypto futures trading?
Yes. Ascending and descending triangles are widely used in both spot and futures trading. However, because futures trading involves leverage, traders should apply proper risk management and avoid excessive leverage during volatile market conditions.