


How to Use RSI and MACD: A Beginner’s Guide to Reading Momentum and Trend Signals
2026/04/06 09:15:48
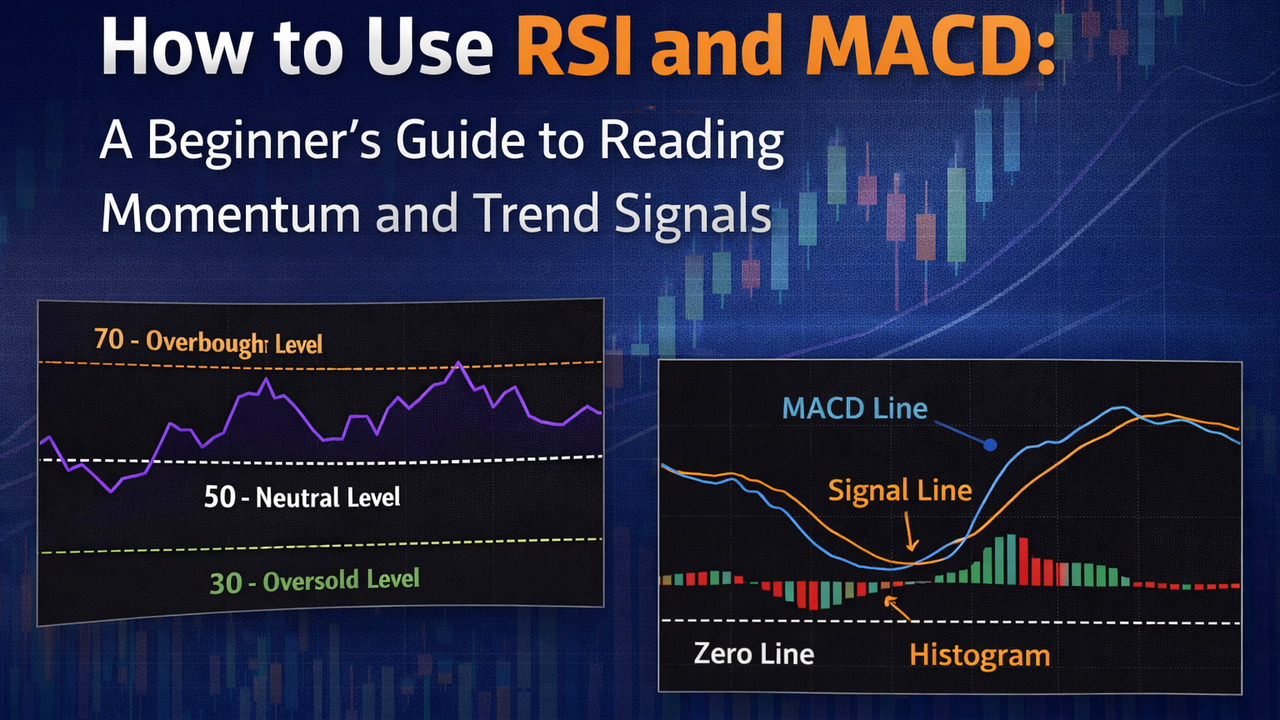
Technical analysis often looks complicated at first because charts are filled with lines, candles, moving averages, and indicators that seem to promise hidden insight. Among the most commonly used indicators, RSI and MACD appear again and again because they help traders read one of the most important elements of any market: momentum.
Momentum matters because price does not move randomly from one candle to the next. Trends develop, weaken, accelerate, stall, and sometimes reverse. RSI and MACD are popular because they help show whether buyers or sellers are gaining strength, losing control, or pushing price to an extreme. That does not mean they can predict the future. It means they can help organize what price is already revealed.
That distinction is important. Many beginners use indicators the wrong way. They see RSI above 70 and assume the market must fall. They see a MACD crossover and assume it is a guaranteed buy or sell signal. In reality, indicators work best when they are used as part of a broader reading of the chart rather than as mechanical shortcuts.
This article explains how to use commonly used indicators RSI and MACD in a practical way. It covers what each one measures, how traders interpret them, when they work best, how they differ, and how to combine them with price action for more structured chart analysis.
Why RSI and MACD Are So Popular
RSI and MACD are widely used because they are simple enough for beginners to learn, yet flexible enough for experienced traders to keep using. They both focus on momentum, but they approach it from different angles.
-
RSI helps show whether momentum is stretched, neutral, or recovering.
-
MACD helps show whether momentum is strengthening, weakening, or shifting in line with a trend.
Together, they can provide a more balanced view of what is happening on a chart. RSI is often quicker and more sensitive. MACD is often smoother and more trend-oriented. When used properly, the two can complement each other well.
What Is RSI?
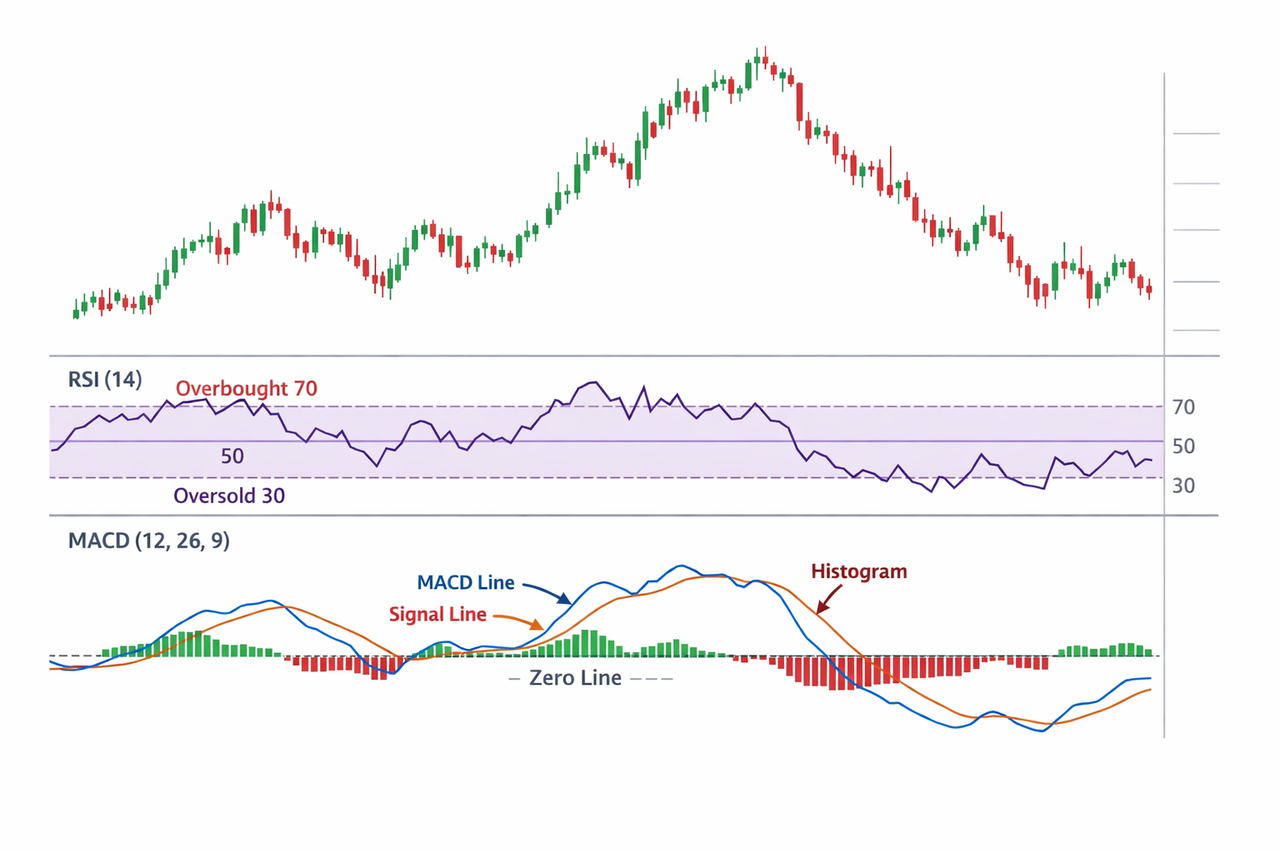
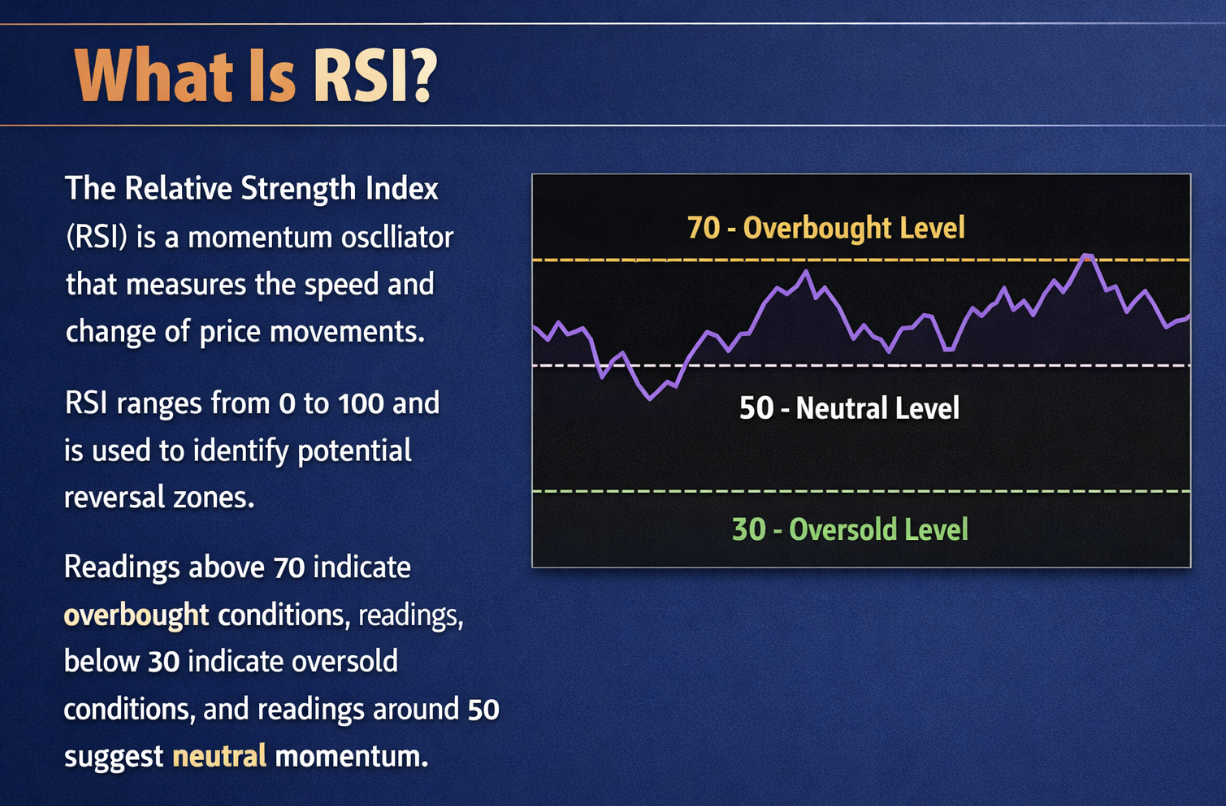
RSI, short for Relative Strength Index, is a momentum oscillator that measures the speed and magnitude of recent price movements. It is plotted on a scale from 0 to 100 and is usually calculated using 14 periods by default.
The main purpose of RSI is to show whether recent bullish or bearish pressure has become unusually strong relative to recent price action.
Standard RSI levels
The most common RSI reference levels are:
-
Above 70: often considered overbought
-
Below 30: often considered oversold
-
Around 50: often considered neutral
These levels are well known, but they are often oversimplified. Overbought does not mean the price must fall immediately. Oversold does not mean the price must bounce right away. Those terms simply suggest that recent price movement has been unusually strong in one direction.
That is why RSI should be read as a measure of momentum condition, not as a standalone signal.
How RSI Works
RSI compares the average gains and average losses over a chosen lookback period. If price has been rising strongly and consistently, RSI moves higher. If selling pressure has been dominant, RSI moves lower.
In simple terms:
-
Rising RSI suggests increasing bullish momentum
-
Falling RSI suggests increasing bearish momentum
-
Extreme RSI readings suggest momentum may be stretched
RSI does not tell you whether an asset is cheap or expensive in a fundamental sense. It tells you whether recent price movement has been dominated by buying or selling pressure.
This is one of the most important things to understand. RSI measures relative momentum, not value.
How to Use RSI in Practice
RSI is often introduced as an overbought and oversold indicator, but it can do more than that. A more complete RSI analysis usually includes several layers.
-
Use RSI to identify overbought and oversold conditions
This is the most common use of RSI.
-
When RSI rises above 70, price may be overextended to the upside.
-
When RSI falls below 30, price may be overextended to the downside.
This can be especially useful in range-bound markets, where price repeatedly moves between support and resistance. In that kind of environment, overbought and oversold readings can help identify when a swing is becoming stretched.
For example, if price is near an established resistance level and RSI is above 70, that may suggest upside momentum is becoming overheated. If price is testing support and RSI is below 30, it may suggest sellers have pushed the move too far in the short term.
Still, these readings become much more useful when they line up with actual chart structure.
-
Use the 50 level as a momentum filter
Many traders find the 50 line more useful than the 70 and 30 levels.
-
RSI above 50 often suggests bullish momentum is stronger
-
RSI below 50 often suggests bearish momentum is stronger
This can be especially helpful in trending markets. In an uptrend, RSI often stays above 50 for long stretches and may find support around the 40 to 50 region before turning higher again. In a downtrend, RSI often stays below 50 and may fail near the 50 to 60 zone before rolling over.
This is a more nuanced way to read RSI because it focuses on trend support rather than only on extremes.
-
Look for RSI divergence
Divergence happens when price and RSI stop moving in the same direction.
-
Bullish divergence: price makes a lower low, but RSI makes a higher low
-
Bearish divergence: price makes a higher high, but RSI makes a lower high
This can suggest that momentum is weakening under the surface. If price pushes to a new high but RSI does not confirm the move, buyers may be losing strength. If price falls to a new low while RSI improves, sellers may be losing control.
Divergence is a useful warning sign, but it should not be treated as an instant reversal signal. Markets can continue trending even after divergence appears. The best divergence setups usually happen near important support or resistance levels and are confirmed by price action.
-
Adjust RSI expectations based on trend strength
One of the biggest mistakes beginners make is using RSI the same way in every market environment.
In strong uptrends, RSI may regularly move between 40 and 80. In strong downtrends, it may often remain between 20 and 60. That means RSI above 70 is not automatically bearish. In many cases, it simply reflects strong trend momentum.
A better question is not “Is RSI overbought?” but “Is RSI behaving normally for this trend, or is it beginning to weaken?”
What Is MACD?
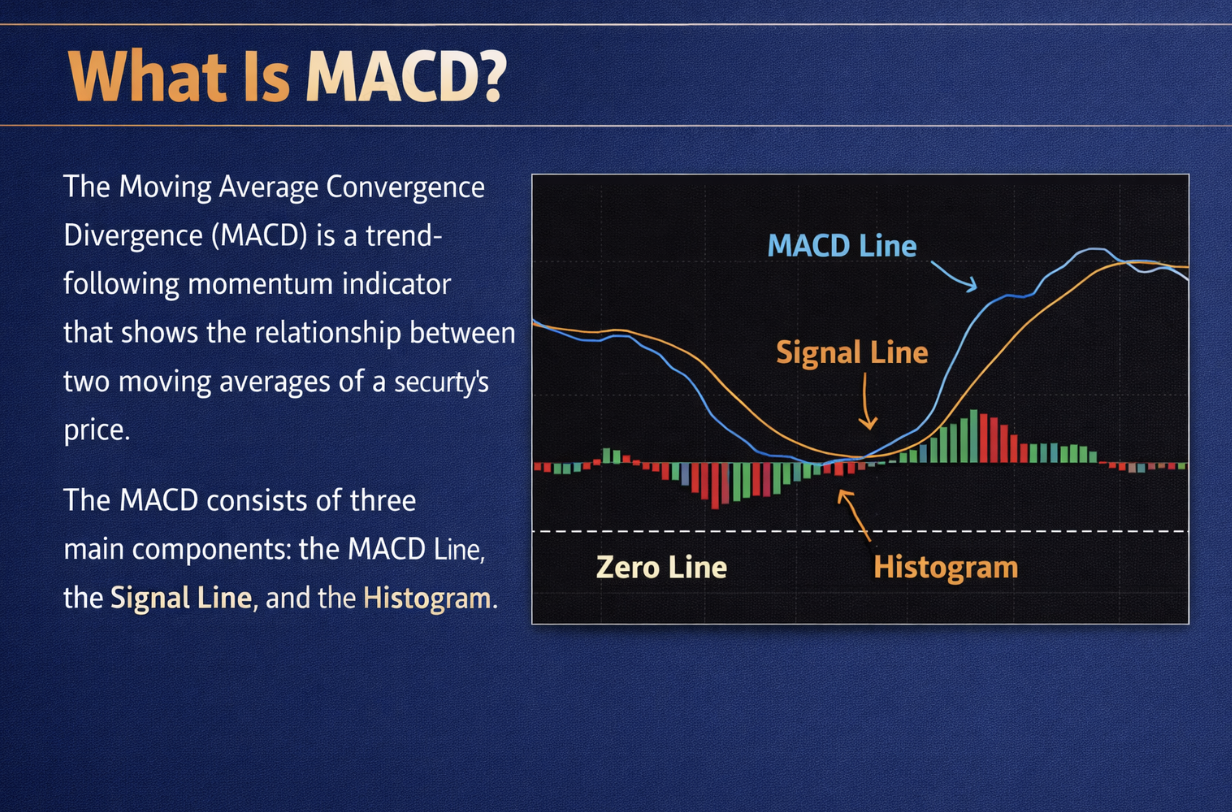
MACD, short for Moving Average Convergence Divergence, is a trend-following momentum indicator based on exponential moving averages.
The standard MACD setup uses:
-
12-period EMA
-
26-period EMA
-
9-period signal line
MACD helps show the relationship between short-term momentum and longer-term momentum. While RSI is often used to identify momentum conditions, MACD is often used to confirm whether momentum is turning, strengthening, or fading within a broader trend.
The Components of MACD
MACD has three main parts, and understanding each one makes the indicator much easier to use.
MACD line
The MACD line is the difference between the 12-period EMA and the 26-period EMA. It reflects the gap between shorter-term price momentum and longer-term price momentum.
Signal line
The signal line is a 9-period EMA of the MACD line. It smooths the MACD line and is used to create crossover signals.
Histogram
The histogram shows the distance between the MACD line and the signal line. It helps visualize whether momentum is expanding or contracting.
These three elements allow traders to see both momentum direction and momentum change.
How MACD Works
MACD is built from moving averages, which means it is a lagging indicator. It reacts to price rather than predicting price. That is not a flaw. It simply means MACD tends to work best as a confirmation tool.
When the shorter-term EMA rises faster than the longer-term EMA, the MACD line strengthens. When short-term momentum weakens relative to longer-term movement, the MACD line falls.
This lets traders observe whether the market is gaining momentum, losing momentum, or shifting between bullish and bearish phases.
How to Use MACD in Practice
MACD is especially useful in trend-following analysis. It helps answer an important question: is the current move strong enough to support the trend?
-
Use signal line crossovers
The most common MACD signal is the crossover between the MACD line and the signal line.
-
When the MACD line crosses above the signal line, it is often viewed as bullish
-
When the MACD line crosses below the signal line, it is often viewed as bearish
These crossovers can be useful after a pullback or as part of an emerging trend. However, they can also create noise in sideways markets where price lacks direction.
That is why a crossover should always be evaluated in context. A bullish crossover after price holds support in an uptrend is usually more meaningful than a bullish crossover in the middle of a choppy range.
-
Use the zero line for broader bias
The MACD zero line is another important reference point.
-
MACD above zero often supports a bullish trend bias
-
MACD below zero often supports a bearish trend bias
This helps distinguish between an early momentum shift and a broader trend confirmation. For example, a bullish crossover below zero may show that bearish momentum is weakening, but MACD moving above zero can provide stronger confirmation that trend conditions are improving.
-
Read the histogram for momentum changes
The histogram is often one of the most useful parts of MACD because it can show momentum changes before the actual crossover becomes obvious.
-
A growing histogram suggests momentum is strengthening
-
A shrinking histogram suggests momentum is weakening
For example, during a pullback in an uptrend, the histogram may become less negative even before the MACD line crosses back above the signal line. That can suggest selling pressure is fading and buyers may be regaining control.
-
Watch for MACD divergence
MACD can also show divergence.
-
If price makes a higher high while MACD fails to do so, bullish momentum may be weakening
-
If price makes a lower low while MACD improves, bearish momentum may be fading
Like RSI divergence, this is best treated as a warning rather than a complete signal by itself. Price confirmation still matters.
RSI vs MACD: Key Differences
RSI and MACD are both momentum indicators, but they measure different things and often serve different roles.
RSI is often better for:
-
spotting overbought and oversold conditions
-
measuring short-term momentum extremes
-
reading momentum around the 50 level
-
identifying divergence clearly
MACD is often better for:
-
confirming trend direction
-
tracking momentum shifts
-
reading short-term versus longer-term momentum
-
spotting crossovers and trend continuation setups
In simple terms:
-
RSI tells you how stretched momentum is
-
MACD tells you how momentum is evolving relative to the trend
That is why many traders use RSI for context and MACD for confirmation.
How to Use RSI and MACD Together
Using RSI and MACD together can create a more structured approach to chart reading because the two indicators complement each other.
Step 1: Identify the market condition
Before using any indicator, determine whether the market is:
-
trending upward
-
trending downward
-
moving sideways
This matters because indicators behave differently depending on the environment. RSI extremes can be useful in ranges but misleading in strong trends. MACD crossovers can be helpful in directional markets but noisy in consolidations.
Step 2: Use RSI to assess momentum condition
Once the market condition is clear, RSI can help answer questions such as:
-
Is momentum stretched?
-
Is momentum supportive of the trend?
-
Is the market showing divergence?
-
Is RSI holding above or below 50?
In an uptrend, RSI staying above 50 or bouncing from the 40 to 50 zone can support bullish continuation. In a downtrend, RSI staying below 50 or failing around 50 to 60 can support bearish continuation.
Step 3: Use MACD for confirmation
After RSI gives you context, MACD can help confirm whether momentum is shifting in the direction you expect.
Look for:
-
a bullish or bearish crossover
-
improving or weakening histogram bars
-
position relative to the zero line
This can help reduce the tendency to react too early based on RSI alone.
Step 4: Confirm with price action
Indicators are secondary tools. The final read should still come from the chart itself.
Look at:
-
support and resistance
-
trendlines
-
higher highs and higher lows
-
lower highs and lower lows
-
breakouts and retests
-
rejection candles and momentum candles
The strongest setups often happen when price action, RSI, and MACD all point in the same direction.
Example of RSI and MACD Working Together
Imagine a market in a clear uptrend. Price pulls back toward a previous breakout zone that now acts as support.
During the pullback:
-
RSI falls from 67 to 46
-
it stays above deeply bearish territory
-
the MACD histogram becomes less negative
-
the MACD line begins turning upward toward the signal line
Then price forms a strong bullish candle at support and breaks above the short-term pullback high.
In that situation:
-
RSI shows momentum cooled without fully breaking down
-
MACD shows downside pressure is fading
-
price action confirms buyers are defending a key level
This is a much stronger interpretation than simply buying because RSI is low or because MACD crossed up.
Common Mistakes When Using RSI and MACD
Even useful indicators can lead to poor decisions when they are misused. Some mistakes appear very often.
Treating RSI 70 and 30 as automatic signals
Overbought and oversold are context-based concepts, not trading commands. A strong trend can stay overbought or oversold for longer than expected.
Taking every MACD crossover
Crossovers in sideways conditions can produce repeated false signals. Without trend structure behind them, they often carry less value.
Ignoring the broader chart
A bullish MACD crossover into heavy resistance is not the same as a bullish crossover after a successful support retest. Indicators never replace market structure.
Assuming divergence guarantees reversal
Divergence can signal weakening momentum, but price can still continue in the same direction. Confirmation matters.
Using too many indicators at once
Adding more indicators does not automatically improve decision-making. It often creates confusion. RSI and MACD are already enough to provide meaningful momentum insight when used properly.
Best Practices for Beginners
If you are new to technical analysis, simplicity helps.
A practical beginner framework looks like this:
-
Start with trend and structure Mark support, resistance, and trend direction before looking at indicators.
-
Use RSI for context Check whether momentum is stretched, neutral, or supportive of the trend.
-
Use MACD for confirmation Look for a crossover, improving histogram, or alignment with the zero line.
-
Wait for price confirmation Let the chart confirm the idea through a breakout, rejection, retest, or continuation move.
-
Stay realistic Indicators improve structure, not certainty. No setup is guaranteed.
Which Indicator Is Better?
There is no universal winner between RSI and MACD because they are designed to do different things.
Choose RSI when you want to:
-
evaluate overbought or oversold conditions
-
measure the strength of recent momentum
-
read whether momentum is above or below neutral
-
spot divergence in a clearer way
Choose MACD when you want to:
-
confirm momentum shifts within a trend
-
analyze crossover behavior
-
compare short-term and longer-term movement
-
follow broader trend bias
For many traders, the best answer is not RSI or MACD. It is RSI and MACD together, used with chart structure.
CTA
After learning how RSI and MACD work, the next step is practice. You can explore live crypto charts on KuCoin and see how momentum and trend signals appear in real market conditions.
Conclusion
RSI and MACD remain two of the most widely used indicators for a reason. They are not magic tools, and they do not remove uncertainty, but they can help make chart analysis more organized and less emotional.
RSI is especially useful for measuring how stretched momentum has become, whether momentum is holding a bullish or bearish bias, and whether divergence may be forming. MACD is especially useful for confirming whether momentum is strengthening or weakening in a way that supports a trend.
The key is to stop treating indicators as automatic buy and sell systems. Their real value comes from context. When you combine RSI and MACD with support and resistance, trend structure, and price action, they become much more practical.
That is the proper way to use commonly used indicators RSI and MACD. Not as shortcuts, but as tools that help you read the market with more clarity and discipline.
Frequently Asked Questions
-
What is RSI used for?
RSI is used to measure momentum strength on a scale from 0 to 100. Traders often use it to identify overbought and oversold conditions, assess momentum around the 50 level, and spot divergence.
-
What is MACD used for?
MACD is used to track momentum shifts and trend confirmation. Traders often use it for signal line crossovers, zero-line bias, histogram changes, and divergence analysis.
-
Can RSI and MACD be used together?
Yes. RSI is often used to assess momentum conditions, while MACD is often used to confirm whether momentum is turning in the direction of the trend.
-
Is RSI better than MACD?
Neither is universally better. RSI is often more useful for momentum extremes, while MACD is often better for trend-following confirmation.
-
What are the standard settings for RSI and MACD?
The most common RSI setting is 14 periods. The standard MACD setting is 12, 26, 9.
-
Do RSI and MACD work in every market?
They can be used across many markets and timeframes, but they do not work the same way in every condition. Trend context and price structure remain essential.
Disclaimer: The information provided on this page may originate from third-party sources and does not necessarily represent the views or opinions of KuCoin. This content is intended solely for general informational purposes and should not be considered as financial, investment, or professional advice. KuCoin does not guarantee the accuracy, completeness, or reliability of the information, and is not responsible for any errors, omissions, or outcomes resulting from its use. Investing in digital assets carries inherent risks. Please carefully evaluate your risk tolerance and financial situation before making any investment decisions. For further details, please consult our Terms of Use and Risk Disclosure