


Top 10 Largest Crypto Liquidation Events of All Time: Biggest Wipeouts Ranked
2026/05/13 04:06:02
Introduction
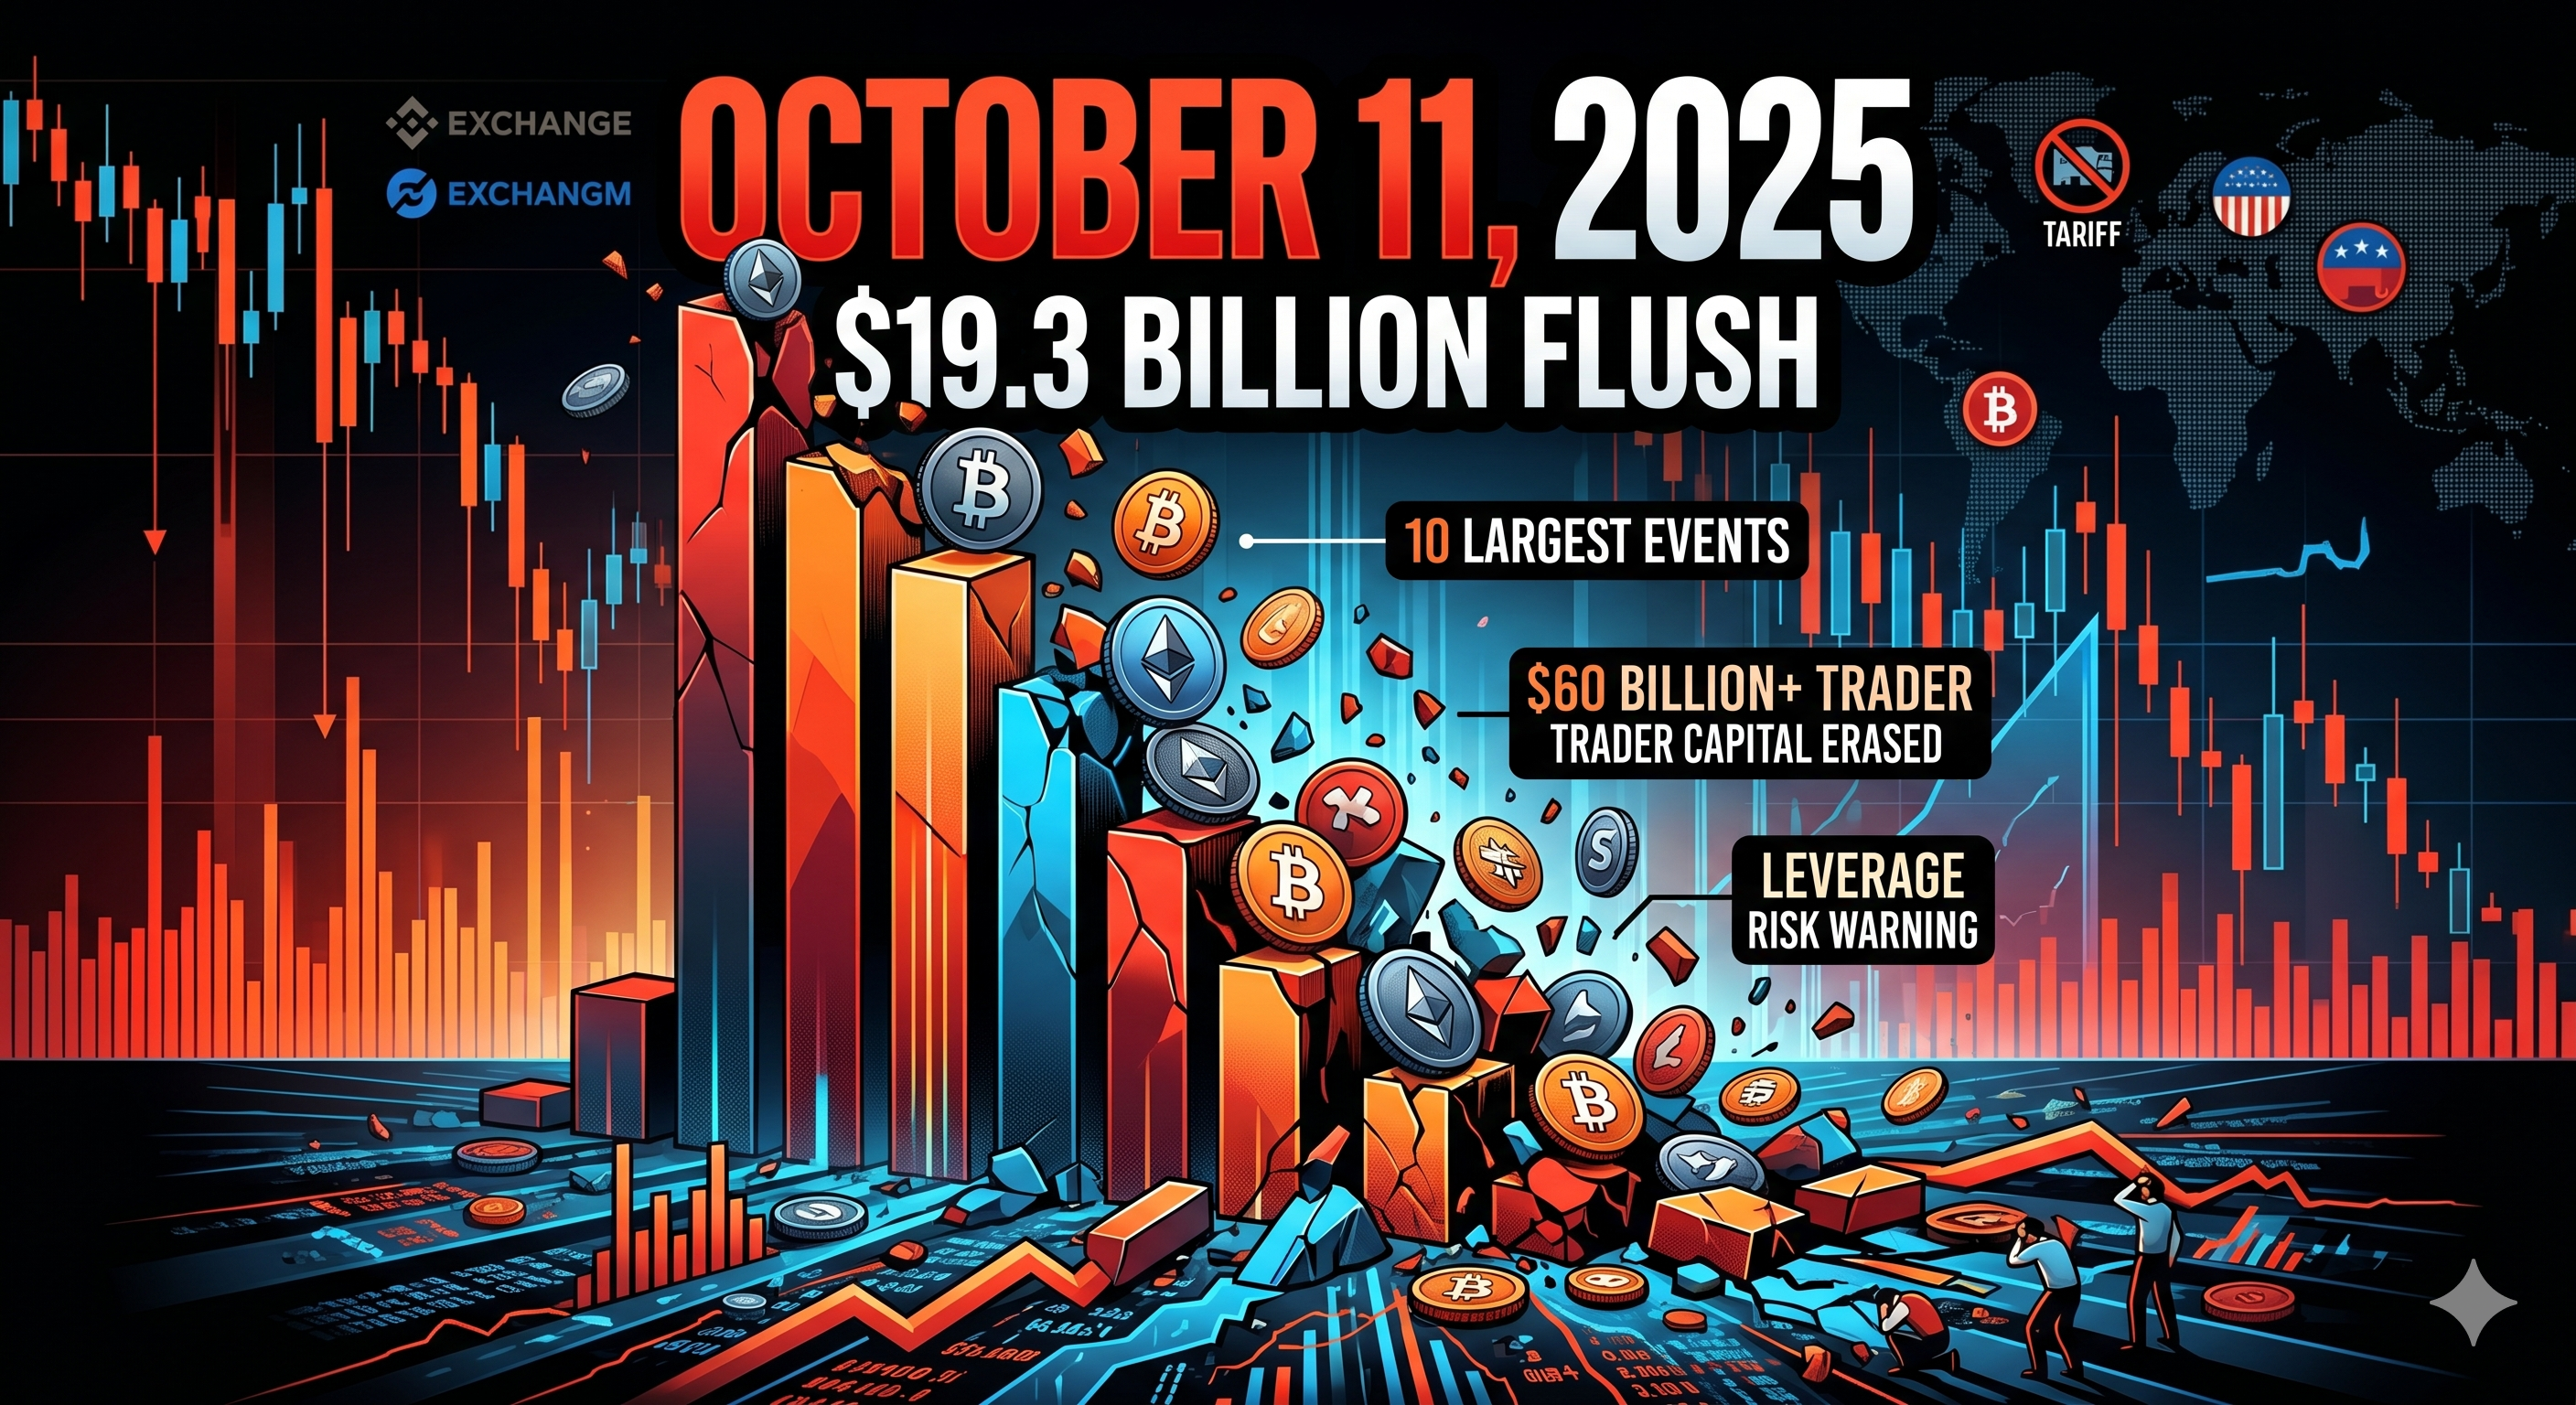
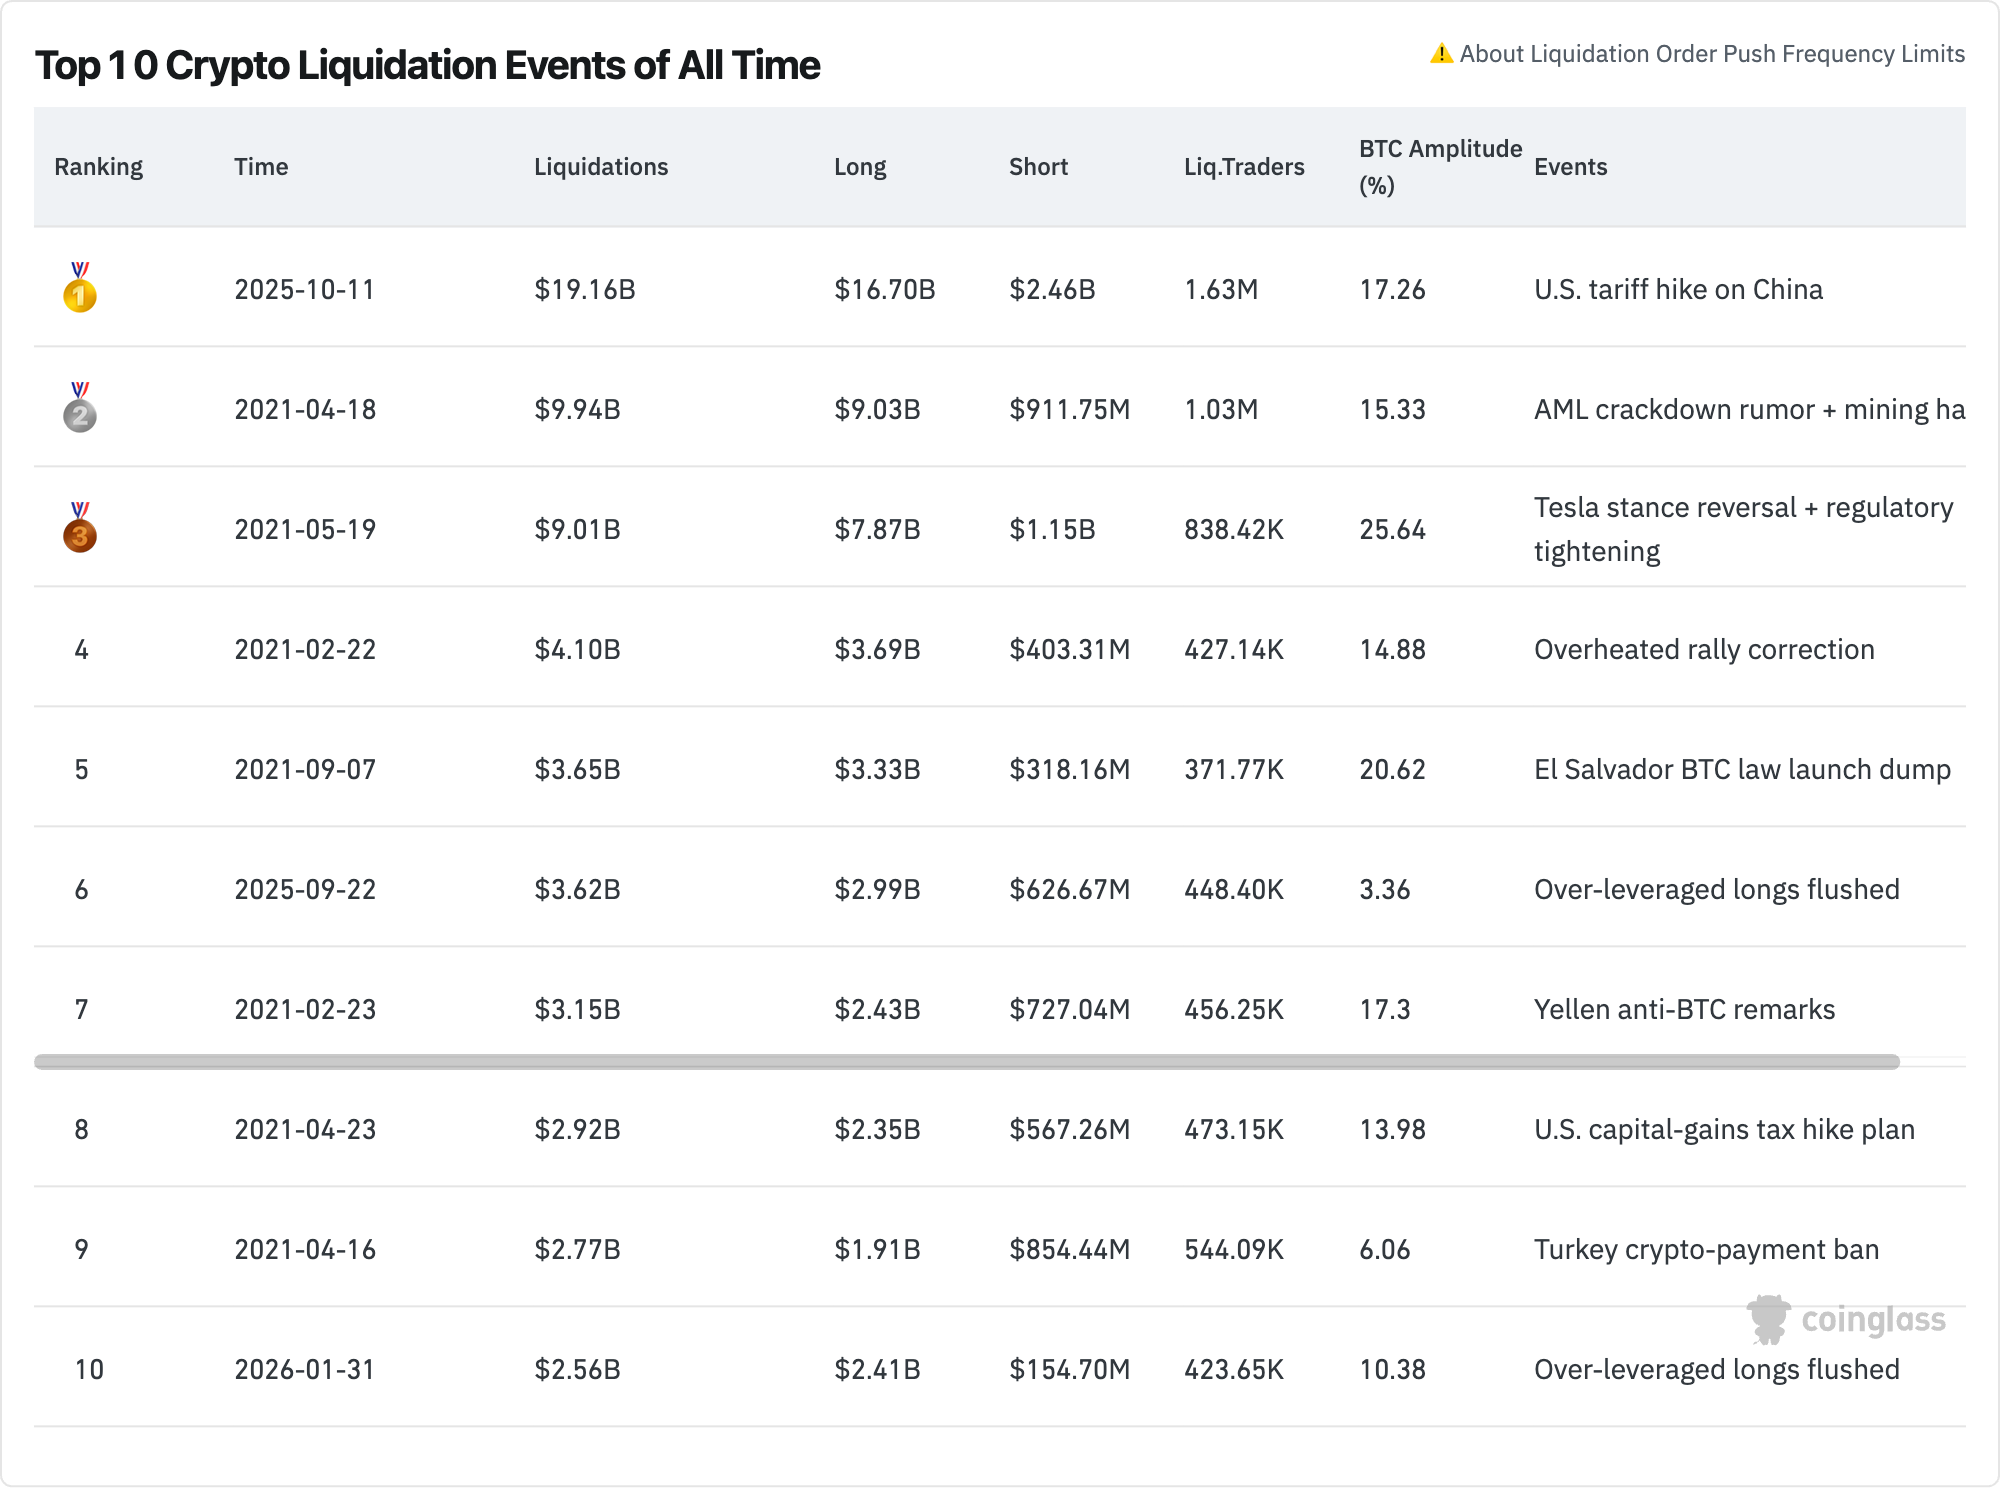
Crypto liquidations exceeded $19.3 billion in a single 24-hour window on October 11, 2025, marking the largest forced unwinding event in cryptocurrency history, according to Coinglass data. That single day erased more leveraged positions than the entire FTX collapse, the COVID crash, and the Terra-Luna implosion combined. Forced liquidations occur when leveraged traders fail to meet margin requirements, prompting exchanges to automatically close positions — and the 10 largest events have collectively wiped out more than $60 billion in trader capital across the past five years.
This article ranks the top 10 crypto liquidation events of all time, explains what triggered each one, and identifies the structural patterns that keep producing these cascades. Whether you trade Bitcoin perpetuals or altcoin futures, understanding these flush events is essential to managing leverage risk.
What Is a Crypto Liquidation Event?
A crypto liquidation event is the forced closure of a leveraged trading position when a trader's margin balance falls below the exchange's maintenance requirement. The exchange automatically sells (or buys back) the position at market price to prevent further losses, regardless of the trader's intent.
Liquidation cascades occur when these forced sales push prices further against other leveraged traders, triggering a chain reaction. According to Coinglass liquidation tracking, more than 85% of liquidated positions in major events are long positions — meaning bullish traders using high leverage are the most frequent victims of sudden downside moves.
Three factors determine the size of a liquidation event:
-
Open interest — the total notional value of outstanding derivatives contracts
-
Average leverage — how aggressively traders are positioned
-
Price velocity — how fast the underlying asset moves against the dominant side
When all three peak simultaneously, the result is a historic flush.
Which Crypto Liquidation Events Are the Largest in History?
The largest crypto liquidation events in history are ranked below by total 24-hour liquidation volume, drawing on Coinglass and exchange-reported data through May 2026. The October 11, 2025 event stands alone as the only liquidation cycle to surpass $19 billion in a single day.
|
Rank
|
Date
|
24h Liquidations
|
Primary Trigger
|
|
1
|
Oct 10-11, 2025
|
~$19.3B
|
Geopolitical shock + leverage flush
|
|
2
|
Feb 2-3, 2025
|
~$2.3B
|
Tariff announcement sell-off
|
|
3
|
Aug 5, 2024
|
~$1.2B
|
Yen carry trade unwind
|
|
4
|
Nov 9, 2022
|
~$1.6B
|
FTX insolvency revealed
|
|
5
|
May 12, 2022
|
~$1.6B
|
Terra-Luna / UST depeg
|
|
6
|
Jun 18, 2022
|
~$1.1B
|
Three Arrows Capital collapse
|
|
7
|
May 19, 2021
|
~$8.6B
|
China mining ban + leverage
|
|
8
|
Apr 18, 2021
|
~$10.1B
|
Coinbase listing flush
|
|
9
|
Mar 12, 2020
|
~$1.2B
|
COVID "Black Thursday"
|
|
10
|
Dec 4, 2021
|
~$2.5B
|
Omicron variant fears
|
Estimates vary across data providers because pre-2021 exchanges reported only partial liquidation feeds, and Binance changed its reporting methodology in 2021 to publish only one liquidation per second per symbol. Actual figures for several events were likely 2x to 3x higher than headline numbers.
#1: October 11, 2025 — The $19 Billion Flush
The October 11, 2025 liquidation cascade is the largest in crypto history, wiping out approximately $19.3 billion in leveraged positions within 24 hours, based on Coinglass aggregated data. Bitcoin fell from roughly $122,000 to under $105,000 in a matter of hours, while Ethereum and major altcoins dropped 15-25%.
The trigger was a combination of escalating US-China trade tensions and a surprise tariff announcement, which hit during low-liquidity Asian trading hours. Roughly 1.6 million trader accounts were liquidated according to exchange data.
Why This Event Was So Severe
Open interest had reached record highs heading into the event. Bitcoin futures open interest topped $90 billion across major venues, and altcoin perpetuals carried unusually high leverage ratios. When the initial sell-off triggered the first wave of long liquidations, thin order books in altcoins amplified the move, producing 50-90% intraday wicks on several mid-cap tokens.
The event also exposed weaknesses in auto-deleveraging (ADL) systems, with multiple exchanges reporting socialized losses among profitable short traders.
#2: February 3, 2025 — The Tariff Shock
The February 3, 2025 liquidation event erased approximately $2.3 billion in positions over 24 hours, triggered by the initial round of US trade tariff announcements. Bitcoin dropped from around $102,000 to below $92,000 within hours.
Long liquidations dominated, accounting for over 90% of the total wiped value. Ethereum took the heaviest damage proportionally, falling more than 25% intraday before partially recovering. This event served as a warning shot for the much larger October 2025 cascade — both shared the same structural trigger of geopolitical/tariff uncertainty hitting a heavily leveraged market.
#3: August 5, 2024 — The Yen Carry Trade Unwind
The August 5, 2024 liquidation event wiped out roughly $1.2 billion in crypto positions as part of a broader global risk-asset sell-off. The Bank of Japan's surprise rate hike forced a violent unwind of yen-funded carry trades, which spilled into Bitcoin and Ethereum.
Bitcoin dropped from $62,000 to under $50,000 in 48 hours. The event was notable because the trigger originated entirely outside crypto markets, demonstrating how leveraged crypto positions now correlate tightly with global macro liquidity conditions.
#4: November 9, 2022 — The FTX Collapse
The FTX insolvency triggered approximately $1.6 billion in liquidations on November 9, 2022, as Bitcoin fell from $20,000 to under $16,000. The collapse of the world's third-largest exchange caused a confidence crisis across the entire industry.
Beyond direct liquidations, the FTX event froze billions in user funds and produced contagion across lenders including BlockFi and Genesis. The downstream impact on crypto credit markets extended liquidation pressure for months afterward.
#5: May 12, 2022 — The Terra-Luna Implosion
The Terra-Luna collapse triggered approximately $1.6 billion in 24-hour liquidations on May 12, 2022, as the UST stablecoin lost its peg and LUNA fell more than 99% within days. Bitcoin dropped from $30,000 to under $26,000 during the event.
The structural lesson from Terra-Luna was that algorithmic stablecoin failures can trigger broad-market liquidation cascades even when the failing asset isn't directly traded by most participants. Anchor Protocol's $18 billion in deposits evaporated, eliminating a major source of crypto yield demand.
#6: June 18, 2022 — Three Arrows Capital Default
The Three Arrows Capital (3AC) default produced roughly $1.1 billion in liquidations on June 18, 2022, with Bitcoin briefly touching $17,600. The hedge fund's forced unwinding of GBTC, stETH, and other positions cascaded through lenders Voyager, Celsius, and BlockFi.
This event marked the bottom of the 2022 bear market and represented the final major liquidation cascade of that cycle. The collapse demonstrated how off-exchange leverage from institutional players can produce on-exchange liquidation pressure.
#7: May 19, 2021 — The China Mining Ban Crash
The May 19, 2021 liquidation event erased an estimated $8.6 billion in positions as China announced a sweeping crackdown on Bitcoin mining and trading. Bitcoin fell from $43,000 to under $30,000 intraday — a roughly 30% move in a single session.
This was the first liquidation event to expose the limits of exchange infrastructure. Multiple major exchanges suffered outages during the cascade, preventing traders from adding margin or closing positions. The event prompted industry-wide upgrades to matching engines and risk systems.
#8: April 18, 2021 — The Coinbase Listing Flush
The April 18, 2021 liquidation event wiped out approximately $10.1 billion in positions just days after Coinbase's Nasdaq direct listing. Bitcoin fell from $64,000 to under $52,000 in roughly 24 hours.
The setup was textbook — extreme bullish sentiment, peak retail leverage, and a "sell-the-news" event after Coinbase's debut. Reports of a power outage at Chinese mining operations served as the proximate trigger, but the underlying cause was unsustainable leverage. This remains one of the largest 24-hour liquidation values ever recorded, though Binance's later reporting changes make exact comparisons difficult.
#9: March 12, 2020 — "Black Thursday"
The COVID-19 market crash on March 12, 2020 produced approximately $1.2 billion in crypto liquidations as Bitcoin fell from $7,900 to under $4,000 in 24 hours — a 50% drawdown. BitMEX, then the dominant Bitcoin derivatives venue, suffered a critical outage during the event that may have prevented Bitcoin from falling further.
Black Thursday remains the most extreme single-day percentage move in modern Bitcoin history. The event reshaped derivatives market structure, accelerating the migration of open interest from BitMEX to Binance, OKX, and other venues with more robust infrastructure.
#10: December 4, 2021 — The Omicron Flash Crash
The December 4, 2021 liquidation event erased approximately $2.5 billion in positions during a weekend flash crash. Bitcoin fell from $57,000 to under $42,000 in a matter of hours during thin Saturday liquidity.
The Omicron COVID variant served as the narrative trigger, but the real cause was excessive leverage combined with weekend liquidity gaps. This event established weekend flash crashes as a recurring risk pattern that persists today.
What Patterns Drive the Largest Crypto Liquidations?
Three patterns appear consistently across the largest crypto liquidation events: peak leverage, asymmetric positioning, and low-liquidity timing. Recognizing these patterns helps traders avoid being caught in the next cascade.
Peak Leverage Conditions
Every event on this list occurred when aggregate open interest was at or near cycle highs. According to Coinglass historical data, Bitcoin futures open interest exceeding $35 billion has preceded every major liquidation event since 2021. When open interest grows faster than spot volume, the market becomes structurally fragile.
Asymmetric Long Positioning
Long positions accounted for 80-95% of liquidated value in 9 of the 10 events listed. This reflects crypto's structural retail bias toward long-only leveraged exposure. Funding rates above 0.05% per 8-hour period are a reliable warning signal that long positioning has become crowded.
Low-Liquidity Timing
Most major cascades initiated during Asian trading hours, weekends, or holiday periods when market makers reduce inventory. Thin order books amplify the price impact of forced liquidations, turning ordinary corrections into historic flushes.
How Can Traders Protect Against Liquidation Cascades?
Traders can reduce liquidation risk by limiting leverage, using isolated margin, and monitoring funding rates and open interest. No single safeguard is sufficient — protection requires layered risk management.
Practical Risk Controls
-
Cap leverage at 3-5x for directional positions; reserve higher leverage for short-duration scalps only
-
Use isolated margin to prevent one losing position from cascading across an entire account
-
Set hard stop-losses above liquidation prices, not at them, to avoid wick-induced fills
-
Monitor funding rates — sustained extreme funding precedes most major flushes
-
Reduce position size when open interest reaches cycle highs
Use Spot Instead of Perpetuals During High-Risk Windows
Holding spot positions eliminates liquidation risk entirely. During periods of macro uncertainty — tariff announcements, central bank meetings, major regulatory votes — rotating from leveraged perpetuals into spot exposure can preserve directional conviction without forced-closure risk.
Conclusion
The top 10 crypto liquidation events of all time share a common DNA: extreme leverage, asymmetric long positioning, and a catalyst that hits during low-liquidity hours. The October 11, 2025 cascade of $19.3 billion stands as the largest in history, but it follows the same structural template as every major flush since Black Thursday in March 2020.
Understanding these events is not just historical curiosity — it is core risk management. Each cascade has produced lasting changes in exchange infrastructure, margin systems, and derivatives market structure. The traders who consistently survive are those who treat funding rates, open interest, and global macro calendars as primary inputs, not afterthoughts.
Leverage is a tool, not a strategy. The next $20 billion liquidation event is statistically inevitable — the only question is which side of it you will be on. By internalizing the patterns from these 10 historic events, traders can position themselves to benefit from the resulting dislocations rather than become part of the liquidation tape.
FAQs
What is the largest single crypto liquidation order ever recorded?
The largest single liquidation order on record was a roughly $200 million BTC-USDT long position on Binance during the October 11, 2025 cascade, according to exchange liquidation feeds. Individual whale liquidations in the $50-100 million range have occurred multiple times across major events since 2021.
Do crypto liquidations always cause prices to crash?
No — liquidations can amplify moves in either direction. Short liquidations during sharp rallies have produced explosive upside cascades, including Bitcoin's January 2024 ETF approval rally and several altcoin short squeezes. However, long liquidations are roughly 5-10x more common than short liquidations in aggregate.
How does Coinglass calculate liquidation data?
Coinglass aggregates liquidation feeds directly from major exchanges including Binance, OKX, Bybit, KuCoin, and others through public APIs. Reported figures understate true liquidations because Binance publishes only one liquidation per second per symbol since 2021, and some exchanges do not publish liquidation streams at all.
Can stop-losses prevent liquidation?
Yes, properly placed stop-losses close positions before liquidation prices are reached, preserving remaining margin. However, stop-losses can fail during extreme volatility when slippage exceeds the stop distance or when exchange infrastructure suffers outages. Layering stops with reduced leverage provides stronger protection than either alone.
Are liquidation cascades predictable?
Cascades are not precisely predictable in timing but are highly predictable in setup. Conditions including open interest at cycle highs, sustained extreme funding rates, and crowded sentiment indicators have preceded every major event on this list. Traders cannot know exactly when a cascade will occur, but they can identify when one is likely.