

ETH/BTC Ratio Hits 3-Month High: Is Ethereum Finally Outperforming Bitcoin?
2026/07/29 16:49:00
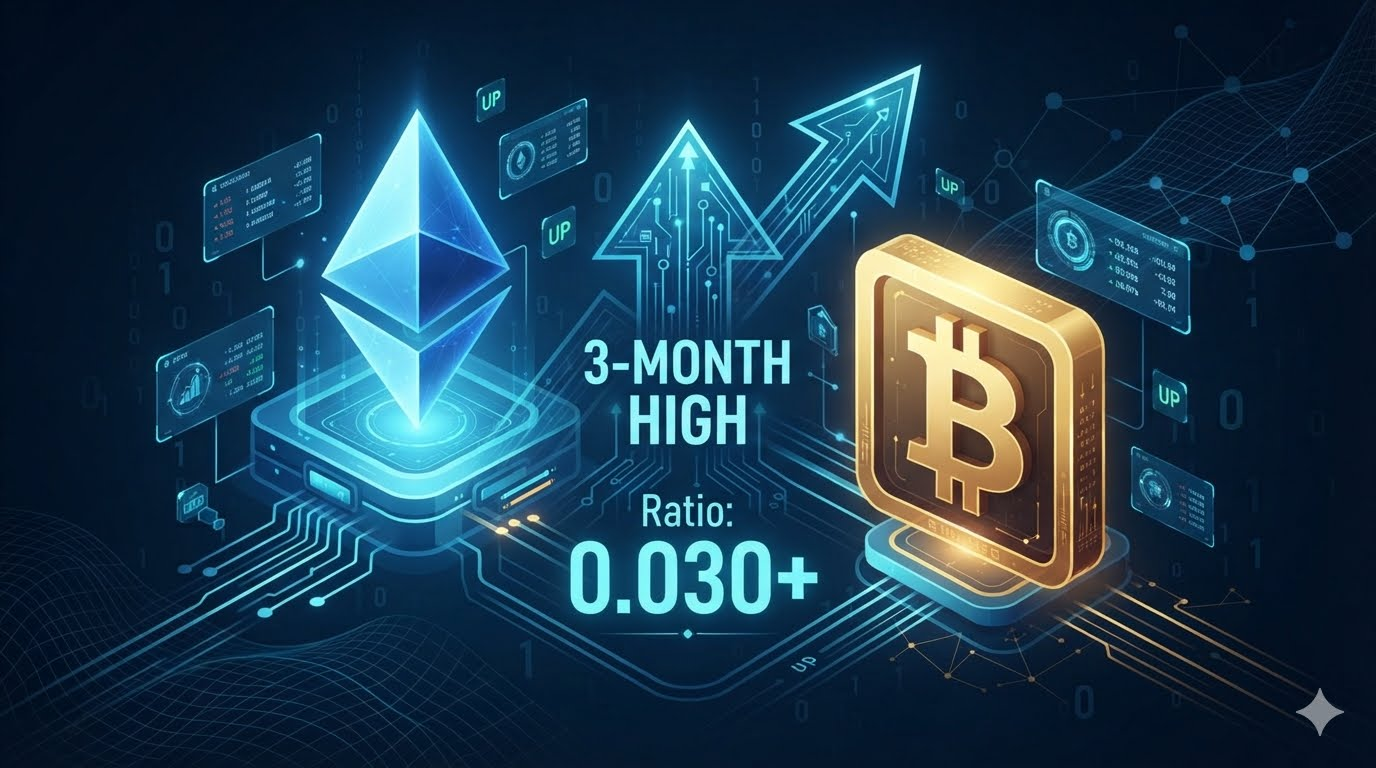
The cryptocurrency market is exhibiting a tactical shift in capital allocation. For several months, Bitcoin (BTC) has steadily consolidated its market share, while alternative layer-1 assets experienced relative stagnation. Driven by consistent inflows into U.S. spot Bitcoin ETFs and a prevailing cautious sentiment across macro global markets, the broader digital asset space remained largely correlated to Bitcoin's price action.
However, recent spot market activity indicates a notable change in local momentum. The ETH/BTC cross-rate, a key barometer for institutional sentiment and cyclical market rotation, rebounded to a three-month high of 0.030. This movement marks an important period of short-term outperformance for Ethereum (ETH) relative to Bitcoin since the opening quarter of the year.
While this technical bounce has increased market discussion regarding a potential market-wide rotation, experienced participants remain analytical. Local trend reversals can often be mistaken for macro structural pivots. To determine whether Ethereum is establishing sustained market leadership, investors need to distinguish between short-term liquidity dynamics and permanent, fundamental shifts in demand. This analysis breaks down the underlying performance metrics, institutional capital flows, network data, and technical boundaries defining this market junction.
Performance Divergence: ETH vs. BTC
The Monthly Return Gap
The performance variance between the two largest digital assets by market capitalization has expanded over the past 30 days. While Bitcoin has traded within a choppy, sideways consolidation range with intermittent liquidations, Ethereum has maintained a steady upward trend.
According to market data, Ethereum recorded a gain of approximately 24% over the past month, moving spot prices toward local resistance levels. In contrast, Bitcoin underperformed, posting a modest 8% advance over the same period. This resulting 16% yield spread in favor of Ethereum within a 30-day window has led macro fund managers and automated trend-following algorithms to adjust their relative-value allocations.
Technical Milestones Reclaimed
Beyond short-term spot gains, the technical structure of the rally is highlighted by key moving average shifts. The ETH/BTC daily chart indicates that the cross-rate has reclaimed and stabilized above its 200-day Simple Moving Average (SMA).
This marks the first time the ratio has traded consistently above this macro technical threshold since January. In digital asset market analysis, the 200-day SMA serves as a primary indicator separating secular downtrends from structural uptrends. Reclaiming this level suggests a mitigation of the medium-term downward momentum that has impacted Ethereum for over six months, shifting the technical outlook toward monitoring key support levels on price corrections.
Crypto Performance Matrix
To visualize the state of macro digital asset dominance and performance dispersion, the table below provides a clean comparative breakdown of key network and market metrics:
| Core Market Metric | Ethereum (ETH) | Bitcoin (BTC) | ETH/BTC Cross-Rate / Status |
| 30-Day Spot Return | ~24.0% | ~8.0% | +16.0% Performance Spread |
| Current Ratio Level | — | — | 0.0300 BTC (3-Month High) |
| 200-Day SMA Status | Trading Above | Trading Above | Reclaimed Threshold |
| Market Dominance (%) | ~18.5% | ~59.0% | Near-Term Recovery for ETH Share |
| Network MVRV Status | Balanced (0.65 Zone) | Elevated | Ratio Consolidating Mid-Range |
3 Catalysts Fueling the Ethereum Rally
Institutional Allocations and Spot Product Dynamics
A primary driver behind the recent capital reallocation is a notable shift in U.S. regulated spot product flows. During the initial months following their launch, spot Ethereum ETFs faced headwinds from structural outflows tied to higher-fee legacy trusts. This sustained selling pressure constrained spot ETH prices, even as spot Bitcoin ETFs absorbed consistent net inflows.
This flow dynamic has recently pivoted. According to institutional market data, U.S. spot Ethereum ETFs recorded an aggregate weekly net inflow of $103.9 million during the July 20–24 trading week. Over the same five-day trading window, spot Bitcoin ETFs attracted $33.79 million.
Consequently, inflows into regulated Ethereum vehicles outpaced Bitcoin products by a factor of approximately three to one for the week. Major global asset managers, including BlackRock and Fidelity, continue to report steady inflows into their respective ETH products. This steady buy-side demand systematically reduces available floating spot supply from over-the-counter (OTC) desks, redirecting those assets into institutional custody solutions.
Corporate Treasury Accumulation & The Supply Crunch
Simultaneously, corporate finance entities are escalating their direct exposure to Ethereum, viewing it as both a yield-bearing technology asset and a long-term balance sheet reserve. Leading the charge among publicly listed entities is Bitmine Immersion Technologies, which executed a high-conviction deployment by purchasing an additional 9,946 ETH, valued at roughly $19.4 million, in a single corporate buying campaign.
This purchase brought Bitmine Immersion Technologies’ total aggregate holdings to a massive 5.79 million ETH. To put this corporate allocation into perspective, this single enterprise now directly controls approximately 4.8% of Ethereum's entire circulating supply. When public corporations lock up such vast quantities of an asset on their long-term balance sheets, it significantly alters the macroeconomic liquidity profile of the token.
This corporate hoarding behavior is amplified by an acute, structural supply crisis occurring directly on-chain within Ethereum’s proof-of-stake validation engine:
Validator Exit Queue Drops to Zero: Data from ValidatorQueue indicates that the total number of node operators waiting to unstake or withdraw their ETH has reached zero, indicating a temporary cessation of structural validator sell-side pressure.
The Staking Entry Glut: Conversely, a massive waitlist of approximately 2.5 million ETH sits stuck in the validator entry queue, requiring entities wanting to lock up capital to wait weeks to deploy their assets.
The Illiquidity Vortex: With massive sums of ETH locked in corporate treasuries and decentralized staking protocols, the active floating supply on spot exchanges has collapsed to multi-year lows, causing prices to move up swiftly when new buying demand hits.
Ecosystem Analysis: Institutional RWA Leadership and the 'Glamsterdam' Upgrade
Ethereum continues to serve as a primary settlement layer for decentralized applications and tokenized traditional assets. The Real-World Asset (RWA) sector, spanning tokenized sovereign debt, private credit, and institutional money market funds, has seen substantial growth, with Ethereum-based RWA capital surpassing $17 billion. The network remains the preferred base layer for institutional initiatives, including BlackRock’s BUIDL fund and Franklin Templeton's on-chain financial products.
Market attention is also shifting toward Ethereum’s next major technical milestone: the "Glamsterdam" hard fork, targeted for mainnet deployment in the second half of 2026. Rather than focusing solely on Layer-2 scalability, Glamsterdam addresses Layer-1 base layer constraints by introducing parallel transaction processing and implementing an enshrined Proposer-Builder Separation (ePBS) framework.
The upgrade plans to increase the Layer-1 Gas limit toward 200 million while optimizing base-layer execution costs. Technical projections estimate a reduction in native Layer-1 transaction and transfer fees by over 70%. Market participants are tracking these updates closely, as structural improvements to Layer-1 efficiency are expected to strengthen Ethereum's competitive positioning relative to alternative monolithic Layer-1 blockchains.
Technical Analysis: Resistance Thresholds for Trend Confirmation
Primary Resistance Levels
While reclaiming the 200-day SMA is a positive indicator for near-term momentum, broader trend reversals require confirmation on higher timeframes. The ETH/BTC weekly chart indicates that the cross-rate is currently trading near the lower boundaries of a multi-month consolidation range.
For the current rally to transition from an oversold bounce into a sustained structural trend reversal, the ratio must decisively clear two primary technical resistance boundaries:
-
The 0.0316 BTC Resistance Zone: This level marks the local swing high established during the second-quarter market correction. It aligns with historical volume profiles and represents the initial resistance level where sell-side liquidity is concentrated.
-
The 0.0352 BTC Macro Horizon: This serves as a key structural boundary for the long-term trend. It represents the confluence of a previously broken long-term channel support and a major historical pivot zone over the past year.
A sustained weekly close above 0.0352 BTC, supported by expanding spot volume across major trading platforms, would validate a macro trend reversal. Until these resistance levels are breached, the broader market structure remains classified as a longer-term downtrend, within which the current move functions as a strong counter-trend rally.
On-Chain Evaluation: The ETH/BTC MVRV Ratio Caveat
On-chain cyclical metrics provide necessary context regarding structural asset valuation. The ETH/BTC Market Value to Realized Value (MVRV) ratio, a metric utilized to evaluate the relative unrealized profit margins of Ethereum holders against Bitcoin holders, is currently tracking at 0.65.
Historically, definitive cyclical bottoms for the ETH/BTC cross-rate have typically formed when the MVRV ratio declines further, often nearing the 0.45 zone. The baseline of 0.65 for the recent local rebound indicates that while the asset was locally oversold, it did not experience a complete macro-level capitulation before moving higher.
As a result, if broader macroeconomic conditions weaken, such as through increased volatility in U.S. technology and artificial intelligence equities or persistent hawkish policies from central banks, high-beta assets like Ethereum remain sensitive to downward corrections back toward major macro support levels.
Market Cycle Dynamics: Evaluating Altcoin Rotation
The Bitcoin Dominance Indicator
To determine whether Ethereum’s near-term performance signals a broader, market-wide rotation, this trend must be evaluated alongside Bitcoin Dominance (BTC.D). Despite Ethereum's recent 24% monthly return, Bitcoin’s market share remains stable near the 59% threshold.
This sustained level of dominance indicates that capital is not yet flowing extensively into the broader altcoin ecosystem. Instead, current market dynamics reflect a highly concentrated capital shift directly from Bitcoin into Ethereum. The majority of mid-cap and small-cap assets continue to trade near their long-term lows relative to both BTC and USD, lagging behind Ethereum's upward movement.
The Mechanics of Market Rotation
Historically, capital migration within digital asset cycles follows a sequential path based on asset risk profiles. In the initial phase, liquidity concentrates in the most liquid asset, driving Bitcoin's price and expanding its market dominance.
In the subsequent phase, profits from the initial Bitcoin expansion rotate into Ethereum, moving the ETH/BTC ratio toward multi-month highs—a transition aligned with recent market activity.
Typically, only after this phase stabilizes does capital overflow into large-cap alternative Layer-1 protocols and core decentralized finance platforms, before eventually cascading into smaller-cap tokens. This framework highlights that while Ethereum has achieved localized growth, the broader market has not yet transitioned into a generalized altcoin expansion.
Execution Strategies: Asset Positioning on KuCoin
For market participants seeking to implement a view on this capital allocation shift, risk management and proper instrument selection are critical. Executing a strategy around the ETH/BTC cross-rate requires systematic and objective execution models.
Utilizing Spot Grid Automation: Because the ETH/BTC ratio is testing key local resistance zones, the cross-rate may undergo a period of range-bound consolidation before establishing a definitive direction. Deploying a Spot Grid Trading Bot enables automated profit capture from high-frequency volatility, systematically purchasing local dips and selling local peaks within a defined range.
Implementing Relative Value Swaps: Market participants looking to isolate Ethereum's relative outperformance while mitigating broader USD directional risk can utilize spot or perpetual contract markets to trade the ratio.
Structuring Accumulation via DCA: For long-term portfolios looking to position ahead of the upcoming Glamsterdam upgrade, automated Dollar-Cost Averaging (DCA) tools help manage entry-price risks. Gradually accumulating an ETH allocation over time balances out short-term technical resistance rejections and mitigates macroeconomic volatility.
Join KuCoin 9th Anniversary Trading Campaign
KuCoin is celebrating its 9th anniversary with a special platform campaign filled with exclusive rewards, trading activities, and limited-time offers. Don’t miss the chance to participate and enjoy the benefits as the exchange marks nine years of growth and innovation. Visit the official campaign page now:

Conclusion
The recent recovery of the ETH/BTC ratio to a three-month high of 0.030 represents a notable technical shift, supported by improving institutional-grade fundamentals. The pivot in spot ETF capital flows, sustained treasury allocations by corporations, and a reduction in the validator exit queue collectively suggest that Ethereum's near-term supply-demand dynamics have strengthened.
However, a disciplined approach remains necessary. With Bitcoin dominance holding near 59% and major technical resistance levels situated between 0.0316 and 0.0352 BTC, declaring a structural trend reversal for Ethereum is premature. Institutional participants are generally avoiding short-term momentum chasing, focusing instead on building calculated, risk-managed positions. Leveraging automated trading tools and awaiting definitive weekly technical confirmation remains the preferred approach before executing broader asset reallocations for the macro cycle ahead.
FAQs
What does a rising ETH/BTC ratio mean for the market?
A rising ratio indicates that Ethereum is outperforming Bitcoin in percentage gains. This usually signals returning institutional interest in Ethereum, increased on-chain ecosystem activity, and a potential local capital rotation from Bitcoin into high-cap alternative assets.
Is the current ETH/BTC breakout a definitive sign of Altseason?
Not yet. While Ethereum’s surge is strong, Bitcoin market dominance remains high at 59%. True Altseason requires capital to cascade widely out of both BTC and ETH into mid-cap and small-cap assets, which hasn't happened.
What are the key resistance levels for the ETH/BTC ratio?
The immediate local resistance sits at 0.0316 BTC. However, the ultimate structural barrier is the 0.0352 BTC zone. A decisive weekly close above 0.0352 BTC is required to confirm a long-term macro trend reversal.
How do spot ETF inflows affect the ETH/BTC ratio?
When Ethereum ETFs net inflows significantly outpace Bitcoin ETFs, institutional buying pressure removes spot ETH from exchange liquidity pools. This shifting demand dynamics on Wall Street directly drives the ETH/BTC cross-rate higher.
What macro risks could halt Ethereum’s current outperformance?
If global macro liquidity tightens due to central bank hawkishness or sudden sell-offs in U.S. tech stocks, investors will flee back to safer assets. As a high-beta asset, Ethereum would likely drop faster than Bitcoin during such flushes.
Disclaimer
The information provided on this page may originate from third-party sources and does not necessarily represent the views or opinions of KuCoin. This content is intended solely for general informational purposes and should not be considered financial, investment, or professional advice. KuCoin does not guarantee the accuracy, completeness, or reliability of the information, and is not responsible for any errors, omissions, or outcomes resulting from its use. Investing in digital assets carries inherent risks. Please carefully evaluate your risk tolerance and financial situation before making any investment decisions. For further details, please consult KuCoin’s Terms of Use and Risk Disclosure.