

Trading 101: How to Trade Double Top and Double Bottom Chart Patterns in 2026?
Introduction
Identifying trend reversals remains one of the most important skills in crypto trading, especially in highly volatile markets. Among the most reliable reversal signals used by both professional and beginner traders are the double top and double bottom chart patterns. These classic formations help traders spot potential market turning points before major price swings occur.
In the 2025–2026 crypto market cycle, traders have increasingly relied on technical chart patterns alongside volume analysis, on-chain data, and momentum indicators to navigate rapid market fluctuations. Double tops and double bottoms continue to be widely used because they provide clear entry and exit signals, well-defined support and resistance levels, and favorable risk-to-reward setups.
A double top pattern usually signals that bullish momentum is weakening and a bearish reversal may follow. In contrast, a double bottom pattern often indicates that sellers are losing control and a bullish reversal could be forming. When combined with trading volume, RSI divergence, and breakout confirmation, these patterns can significantly improve trading accuracy across spot and futures markets.
In this guide, we will explain how double tops and double bottoms work, how to identify them correctly, common mistakes traders make, and how to trade these patterns more effectively in the crypto market.
Double Top Chart Pattern
The double-top is a chart pattern that indicates an imminent reversal of a bullish trend. This means that the asset must be in a sustained bullish trend before forming the double tops.
The defining feature of the double top reversal is the two highs with a moderate low in between. The second is followed by a sharp downtrend that reverses all the gains that led to the price spikes and suggests a further sharp decline. The first and the second top attained by the price represent the resistance level reached by the asset during a bullish trend.
This chart pattern signals a moderate to long-term transition from bullish due to declining market sentiment in the crypto market.
How to Identify a Double Top Reversal?
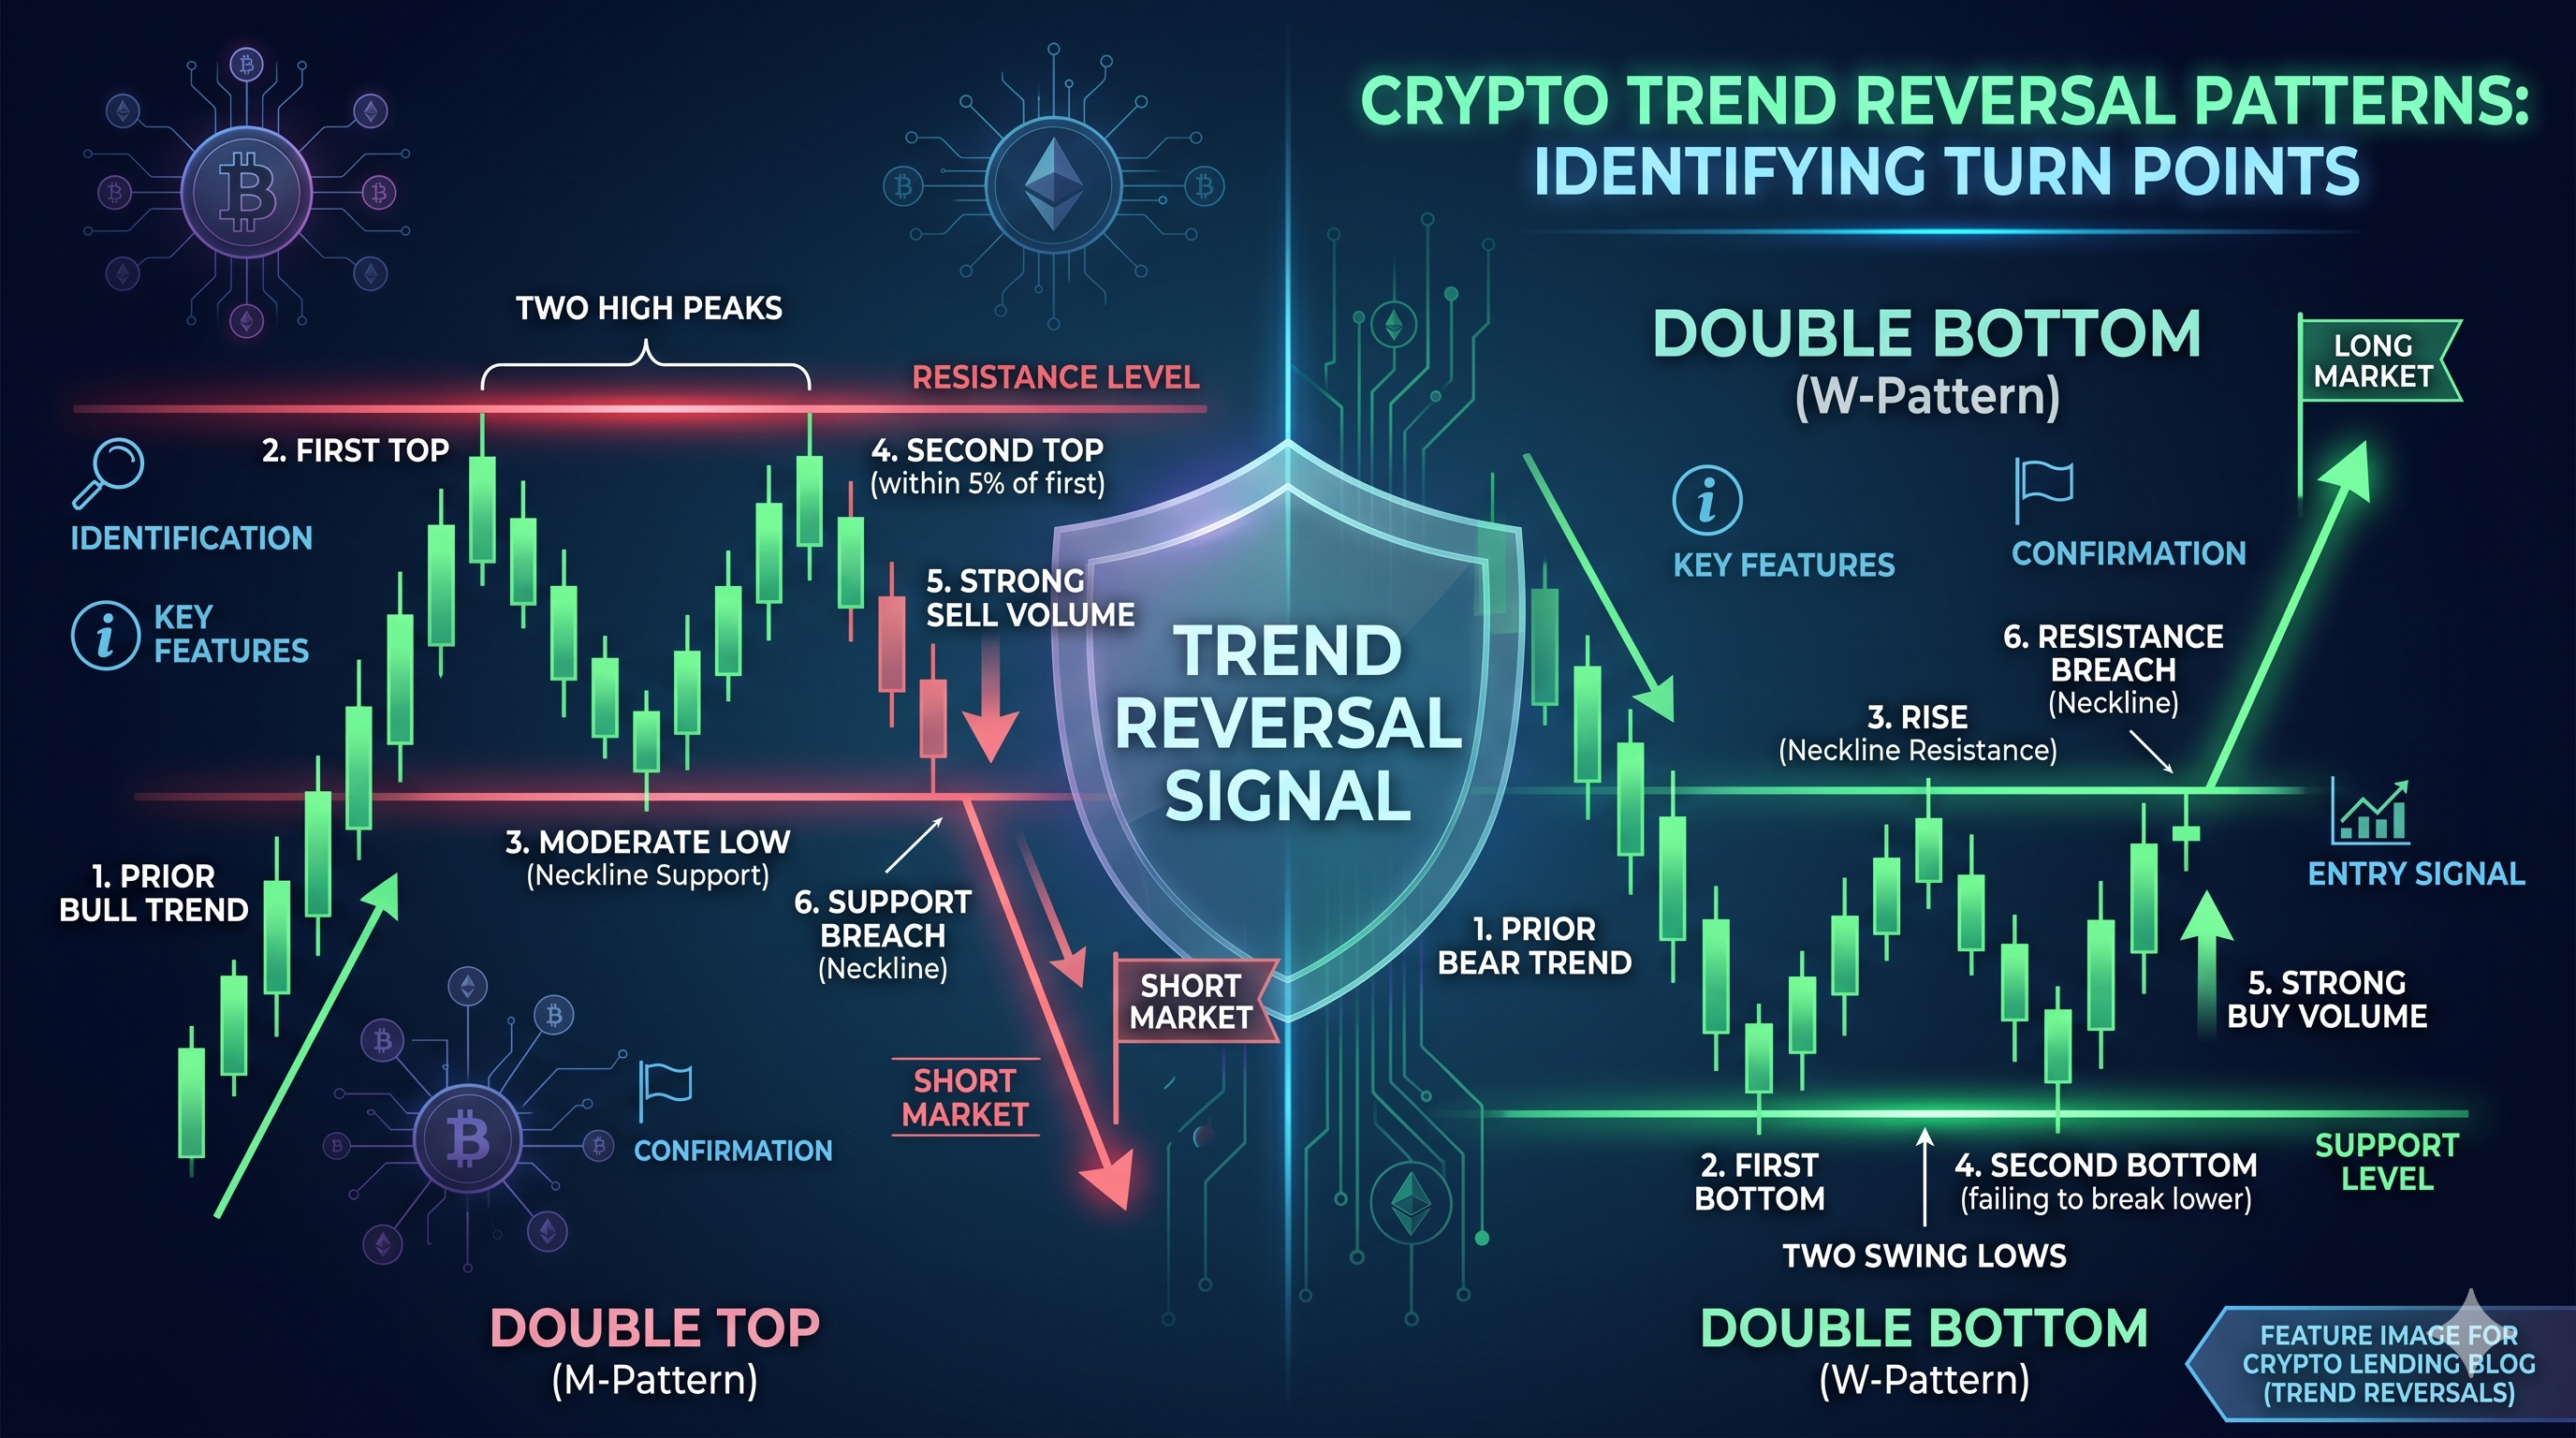
A true double top reversal pattern has six main features.
1. Prior bullish trend: A significant positive trend must precede a double top reversal pattern. If there is no long-term bullish trend, its accuracy declines.
2. First top: The first top in this chart pattern should be the peak from the observed bullish trend. This peak typically represents the profit-taking activities of traders who were in long positions. Since this involves selling their holdings, there will be a short decline in the asset's price.
3. The price drops: After the first peak, the prices begin to drop. This often leads to up to a 20% drop in the prices as the volume being sold increases. The low attained here will mark the support level.
4. Second top: The short-term sellers are counteracted by short-term buyers who push the prices up. You should note that the volume being bought here doesn't increase significantly. This period is often marked by an increase in the prices but constant or dropping volumes, indicating a divergence.
Regardless, the price will reach the high level of the high registered by the price in the first top, but doesn't breach it. Typically, the asset doesn't breach this price, marking a clear resistance level. Note that the first and the second top do not need to align perfectly in most cases, but they should always be within a 5% range of each other.
5. Price decline from the second top: The price will steadily drop from the second top, with the volume being sold also increasing steadily. The increase in volume continues to push the price downwards due to the strong selling pressure.
6. Breaching the support: The steady decline in prices from the second top goes beyond the support level formed in step 3 above. Breaching this level is usually the signal to short the market since the bearish trend has taken hold.

Formation of Double Top Chart Pattern on the Ethereum Price Chart | Source: ETH/USDT
Note that a double top reversal isn't fully confirmed until the sharp reversal from the second peak occurs, meaning that most traders are looking to trade when the price breaks through the support level formed by the first pullback.
Common Mistakes When Trading Double Top Patterns
One of the biggest mistakes beginner traders make is entering a short position before the support level is broken. A double top pattern is not fully confirmed until the neckline support breaks with strong selling volume. Premature entries often lead to losses when the market forms a fake breakdown and resumes its uptrend.
Another common issue is ignoring trading volume. In most valid double top formations, the second peak usually forms with weaker buying volume compared to the first peak. This divergence reflects weakening bullish momentum and increases the probability of a reversal.
Traders should also pay attention to broader market sentiment. During strong bull market phases, many bearish reversal patterns fail because overall market liquidity and momentum remain extremely strong. This was frequently observed during Bitcoin rallies in late 2025, where several double top formations on lower timeframes failed to trigger sustained corrections.
For higher-probability setups, many experienced traders combine double top analysis with indicators such as RSI divergence, MACD crossovers, funding rate analysis, and declining open interest in crypto futures markets.
Double Bottom Chart Pattern
The double bottom chart pattern is the opposite of the double top pattern. This means that when this pattern forms on the price charts, we can expect that the price action will reverse from a bearish trend into a bullish one. In a double bottom, the first swing low marks the extreme low of a long-term downtrend. As soon as the second swing low fails to go beyond the first low, we can take it as a confirmation that the bearish momentum is ending and reversing into an uptrend.
How to Identify a Double Bottom Reversal?
Identifying this reversal is the exact opposite of the double top reversal we've discussed above.
1. Prior bearish trend: A double bottom reversal pattern after a sustained downtrend
2. First bottom: The first bottom in this pattern should be a swing low from the observed bearish trend. This low typically represents the profit-taking activities of traders who had short positions. Remember that liquidating short positions involve buying the asset in the market.
3. A short-lived rise in the price: After the first swing low, the prices begin to rise. This often leads to a 20% rise in the price as the volume being bought increases. Consequently, the prices increase in the short term forming a resistance level.
4. The second bottom forms: The short-term buying activity in the market is counteracted by sellers who push the prices down. You should note that the volume being sold here doesn't increase significantly. This period is often marked by a drop in the prices with constant or dropping volumes, indicating a divergence.
Regardless, the price will reach the levels of the low registered by the price in the first bottom but doesn't go below it. Typically, the asset doesn't breach this price, marking a clear support level.
5. Increase in the price: The price will steadily increase from the second bottom, with the volume being bought also increasing steadily. The increase in volume continues to push the price upwards.
6. Breaching the resistance: The steady increase in prices from the second bottom will trend past the resistance level formed in step 3 above. Breaching this level is usually the signal to go long.

Formation of Double Bottom Pattern on the Dogecoin Price Chart | Source: DOGE/USDT
Note that a double bottom reversal isn't fully confirmed until the sharp reversal from the second bottom occurs. That's because most traders are looking to trade when the price breaches the resistance level.
How Traders Confirm Double Bottom Breakouts
In modern crypto trading, experienced traders rarely rely on chart patterns alone. Instead, they look for additional confirmation signals before entering long positions after a double bottom formation.
The most important confirmation is usually a breakout above the neckline resistance with strong buying volume. A breakout supported by increasing volume suggests genuine buyer interest and reduces the probability of a false breakout.
Momentum indicators can also help validate the reversal. For example, bullish RSI divergence often appears during the second bottom, signaling that selling pressure is weakening even though the asset revisits previous lows. Similarly, moving average crossovers and positive funding rate shifts in perpetual futures markets may strengthen bullish confirmation.
Double bottom patterns are especially popular in crypto because digital assets frequently experience sharp capitulation events followed by aggressive rebounds. This makes the pattern highly effective on major cryptocurrencies such as Bitcoin, Ethereum, and Solana during broader market recovery phases.
Conclusion
Double top and double bottom patterns remain among the most practical and beginner-friendly reversal patterns in technical analysis. A double top resembles the letter “M” and often signals a bearish reversal after an extended uptrend, while a double bottom resembles the letter “W” and typically indicates a bullish reversal after a prolonged downtrend.
Although these chart patterns are relatively easy to identify, traders should avoid relying on them in isolation. Successful crypto traders usually combine price action analysis with trading volume, momentum indicators, market sentiment, and proper risk management strategies before entering trades.
In today’s fast-moving crypto market, false breakouts and sudden volatility spikes are common, particularly in leveraged futures trading. Waiting for confirmation before opening positions can significantly improve trade accuracy and reduce unnecessary losses.
KuCoin traders can use advanced TradingView-powered charts, multiple technical indicators, and real-time market tools to identify double top and double bottom setups more efficiently across hundreds of crypto trading pairs.
As always, consider practicing these strategies on a demo account before trading with real capital. The more chart patterns you study, the better your understanding of market psychology and trend reversals will become.
FAQs
Is a double top pattern bearish or bullish?
A double top pattern is generally considered a bearish reversal pattern. It usually forms after a strong uptrend and signals that buying momentum is weakening, potentially leading to a downward price reversal.
Is a double bottom pattern reliable in crypto trading?
Yes, double bottom patterns are widely used in crypto trading because they help traders identify potential bullish reversals after prolonged downtrends. However, traders should still wait for breakout confirmation and use additional indicators for higher accuracy.
What timeframe works best for double top and double bottom patterns?
These patterns can appear on all timeframes, but higher timeframes such as the 4-hour, daily, and weekly charts are generally considered more reliable because they filter out market noise and short-term volatility.
How can traders avoid fake breakouts?
Traders often avoid fake breakouts by waiting for strong volume confirmation, candle closes beyond key support or resistance levels, and confirmation from technical indicators such as RSI or MACD.
Can double tops and double bottoms be used in futures trading?
Yes, these reversal patterns are commonly used in crypto futures trading for both long and short strategies. However, traders should manage leverage carefully because crypto markets can experience sudden volatility and liquidation events.