


What Is the ADX Indicator and How Is It Used in Practice?
2026/04/03 08:00:00
The ADX, or Average Directional Index, is one of the most widely used indicators in technical analysis for measuring trend strength. It does not show whether the price is moving up or down. Instead, it shows whether the market is trending with enough strength to matter.
That makes the ADX especially useful in real chart analysis. Markets do not behave the same way all the time. At certain points, price moves in a clear trend with strong momentum. At other times, it drifts sideways, creates false breakouts, and offers very little follow-through. The ADX helps separate those conditions.
Rather than acting as a standalone buy or sell signal, the indicator works best as a tool for understanding market context. It helps answer a practical question: is the current market move strong enough to be treated as a trend?
What is an ADX Indicator ?
The Average Directional Index was developed by J. Welles Wilder Jr. as part of the Directional Movement System. This system includes three separate lines:
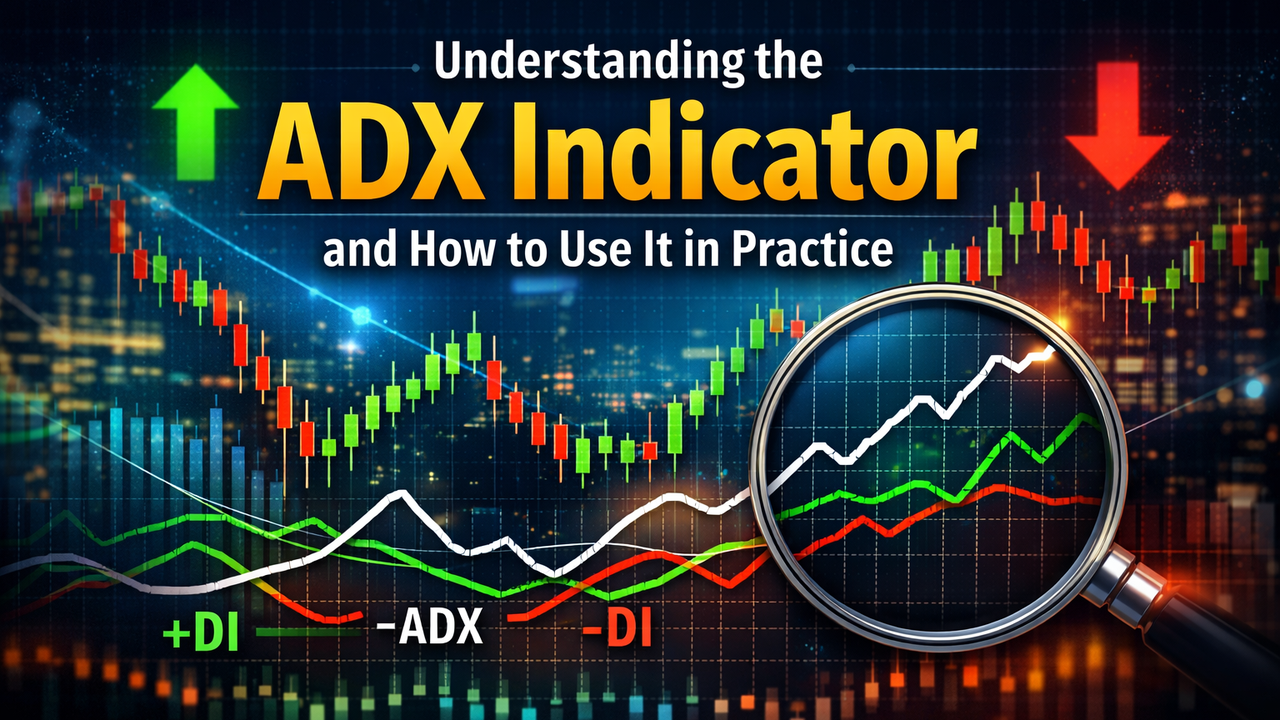
The first is the ADX line, which measures the strength of a trend.
The second is the +DI line, or Positive Directional Indicator, which reflects bullish directional pressure.
The third is the -DI line, or Negative Directional Indicator, which reflects bearish directional pressure.
These three lines are designed to work together. The +DI and -DI lines show which side has more control, while the ADX line shows how strong that control is.
This distinction is important. A rising ADX does not mean the market is bullish. It simply means the current trend, whether upward or downward, is becoming stronger.
What the ADX Actually Measures
Many indicators attempt to show momentum, direction, or possible reversal points. The ADX has a narrower focus. It measures trend intensity.
That is why the ADX is often described as a non-directional trend indicator. It does not predict the next move. It does not indicate where to enter or exit by itself. Its main role is to confirm whether price is moving with meaningful strength.
In practical terms, the ADX helps distinguish between a market that is trending with conviction and a market that is ranging or moving without clear structure.
This difference matters because strategies tend to perform differently depending on market conditions. Trend-following setups generally work better when trend strength is rising. Range-based strategies tend to perform better when the market lacks momentum. The ADX helps identify which environment is present.
The Three Components of the Directional Movement System
To use the ADX properly, each of its components needs to be understood in context.
The +DI Line
The Positive Directional Indicator, or +DI, measures upward directional movement. When +DI is above -DI, buyers are showing greater strength than sellers.
The -DI Line
The Negative Directional Indicator, or -DI, measures downward directional movement. When -DI is above +DI, sellers are showing greater strength than buyers.
The ADX Line
The ADX line smooths the directional data and converts it into a reading of trend strength. It does not care whether buyers or sellers are in control. It only measures how strong the dominant side is.
A simple way to frame it is this: the DI lines show direction, while the ADX shows strength.
ADX Levels and Their Meaning
The ADX is plotted on a scale from 0 to 100. In most markets, values above 60 are relatively uncommon, but the scale still provides a useful framework for interpretation.
When the ADX is below 20, the market is usually considered weak or range-bound. Price may still move, but the trend lacks consistency and follow-through. These conditions often produce false breakouts and choppy behavior.
When the ADX moves into the 20 to 25 range, the market may be transitioning from a weak environment into a stronger directional phase. This zone is often treated as an early sign that trend conditions are beginning to improve.
When the ADX rises above 25, many traders interpret it as evidence of a meaningful trend. The market is showing enough strength to support a trend-following view, although confirmation from price action is still necessary.
When the ADX moves above 50, the trend is generally considered very strong. At that point, the move may continue, but attention often shifts toward signs of slowing momentum or trend exhaustion.
These levels are best treated as guidelines rather than rigid rules. Different markets and timeframes behave differently, but the overall principle remains consistent: higher ADX readings usually reflect stronger trend conditions.
Why ADX Does Not Show Trend Direction
One of the most common misunderstandings about the ADX is the belief that a rising ADX is automatically bullish. That is not the case.
A market can sell off sharply while ADX rises. In that situation, sellers are driving a strong downward trend, and ADX is capturing the strength of that movement. The indicator is responding to the intensity of the trend, not its direction.
This is why the ADX should always be read alongside the DI lines and the price chart itself. If +DI is above -DI and ADX is rising, bullish trend strength is improving. If -DI is above +DI and ADX is rising, bearish trend strength is improving.
On its own, the ADX only tells part of the story.
The Standard ADX Setting
The most common ADX setting is 14 periods, which comes from Wilder’s original design. This remains the standard on most charting platforms and is widely used across multiple timeframes.
A shorter setting makes the indicator more responsive, but it also creates more noise. A longer setting smooths the line further, but that also means slower reactions to changes in trend strength.
For most chart analysis, the 14-period setting offers a balanced starting point. It is responsive enough to reflect changes in trend conditions without becoming overly erratic.
How the ADX Is Used in Practice
The ADX is most useful when applied as a market condition filter rather than a direct trigger. Its practical value lies in helping determine what type of market is currently in play.
Identifying Trend vs Range Conditions
One of the clearest uses of the ADX is separating trending markets from sideways markets.
When ADX remains low, the market often lacks strong directional commitment. In these conditions, breakouts tend to be less reliable and momentum strategies often struggle. The chart may continue moving back and forth between support and resistance without clear follow-through.
When ADX rises above 25 and continues climbing, the market begins to show stronger directional behavior. This does not guarantee that every trend setup will succeed, but it does improve the overall context for strategies built around continuation and momentum.
This is one of the main reasons the ADX remains popular. It helps determine not just whether price is moving, but whether the move has enough strength to justify a trend-based approach.
Reading the DI Lines Alongside ADX
The ADX becomes more informative when read with the +DI and -DI lines.
If +DI crosses above -DI while ADX is rising, bullish momentum is strengthening. When price is also making higher highs and higher lows, the overall picture supports an uptrend.
If -DI crosses above +DI while ADX rises, bearish momentum is strengthening. When price structure also confirms lower highs and lower lows, the trend has stronger alignment.
The key point is that DI crossovers alone can be noisy, especially in weak market conditions. ADX helps reduce that noise by showing whether the crossover is happening in an environment of genuine trend strength.
Confirming Breakouts
Breakouts often attract attention because they can lead to powerful moves, but many fail quickly. ADX can help improve the quality of breakout analysis.
For example, if price breaks above a clear resistance zone while ADX is flat and low, the move may lack conviction. If the same breakout occurs while ADX is rising and pushing above the 20 to 25 zone, the breakout has stronger confirmation.
The same principle applies to bearish breakdowns. A move below support becomes more meaningful when -DI is dominant and ADX is rising, because that suggests the decline is developing with real trend strength.
ADX does not eliminate the risk of failed breakouts, but it does provide a more disciplined way to judge whether momentum is actually building.
Evaluating Pullbacks Within a Trend
A strong trend rarely moves in a straight line. Even the healthiest trends include pauses and pullbacks.
When ADX is already above 25 and holds firm, pullbacks within the dominant trend often become more attractive than they would in a weak market. In that situation, the indicator is not generating an entry signal on its own. Instead, it is helping confirm that the broader trend still has enough strength to support continuation setups.
This is particularly useful in markets where chasing price after a sharp move carries poor risk-reward. ADX helps maintain focus on the larger structure rather than every short-term fluctuation.
What a Falling ADX Means
A falling ADX does not automatically mean reversal. It means trend strength is weakening.
That weakening can lead to several outcomes. The market may consolidate, drift into a range, continue in the same direction with less momentum, or eventually reverse. ADX alone cannot determine which of those outcomes will occur.
For example, an uptrend can remain intact while ADX declines. In that case, price may still be moving higher, but the pace of the trend is slowing. The same logic applies to a downtrend.
This is why the indicator works best as part of a broader reading of price structure rather than as a standalone decision tool.
A Simple Practical Framework for Using ADX
A consistent framework helps make ADX readings more useful.
The first step is to check the ADX level. A low reading suggests weak conditions. A rising reading above 25 suggests stronger trend conditions. A declining reading from a high level suggests fading momentum.
The second step is to compare +DI and -DI. This shows which side currently has directional control.
The third step is to confirm everything on the chart itself. Higher highs and higher lows support bullish structure. Lower highs and lower lows support bearish structure. Breakouts, pullbacks, and support or resistance zones add essential context.
This sequence matters because it places the ADX in its proper role. The indicator helps frame the environment, while price structure remains the primary source of confirmation.
A Practical Bullish Example
Consider a market that has been moving sideways for several sessions. ADX remains near 17, reflecting a weak and indecisive environment. Resistance is tested several times, but price fails to break through with conviction.
Then the price closes above resistance. At the same time, +DI crosses above -DI and ADX begins rising from 19 to 24, then above 26.
This sequence suggests that the market is shifting from range conditions into a stronger bullish phase. The breakout is not simply a random move higher. Trend strength is improving, and directional pressure is aligning with the price structure.
In this case, ADX is not creating the trade idea. It is strengthening the market context around that idea.
A Practical Bearish Example
Now consider the opposite setup. A market begins to lose support after several failed rallies. Sellers push price lower, -DI moves above +DI, and ADX rises from 18 to 29.
This tells a similar story in the opposite direction. The decline is becoming more directional, sellers are in control, and trend strength is expanding.
Again, the ADX is not functioning as a standalone signal. It is confirming that bearish pressure is building in a way that is more meaningful than a simple short-term dip.
Common Mistakes When Using ADX
The ADX is effective when used correctly, but several mistakes appear frequently.
One of the most common is treating ADX as a direct buy or sell signal. Since it does not show direction, that approach usually leads to poor interpretation.
Another common mistake is using the indicator in isolation. ADX is strongest when combined with price action, support and resistance, and broader market structure. On its own, it cannot provide enough detail to support a complete trading decision.
A third mistake is assuming that a falling ADX means a reversal is imminent. In reality, it only shows that the current trend is losing strength. Reversal is only one possible outcome.
It is also common to place too much weight on every DI crossover. In weak conditions, these crossovers can happen repeatedly without producing a meaningful move. That is why the ADX line matters so much as a filter.
Best Tools to Combine With ADX
The ADX works well with tools that provide the information it does not.
Moving averages can help define the broader trend direction. Support and resistance can identify where breakouts and pullbacks matter most. Candlestick analysis helps read momentum and rejection around key areas. Volume can offer additional confirmation when price moves out of consolidation.
The goal is not to overload the chart with indicators. The goal is to combine ADX with tools that clarify structure and direction.
When ADX Works Best
ADX tends to be most useful in markets that are moving from consolidation into trend, or in trends that are already underway and need to be evaluated for strength.
It is especially relevant in breakout trading, momentum trading, and pullback strategies. In these styles, understanding whether the market is actually trending can make a major difference.
Its value is lower when used as a standalone trigger without broader chart context. The real strength of the ADX lies in helping define the environment before decisions are made.
Final Thoughts
The ADX indicator remains a practical tool for evaluating whether a market is trending with real strength or simply moving sideways without momentum. Its value lies in measuring trend intensity rather than predicting direction, which makes it especially useful for judging overall market conditions. When read together with the +DI and -DI lines, as well as price action, ADX can help confirm whether buyers or sellers are in control and whether that move has enough strength to matter. Used this way, it becomes less of a standalone indicator and more of a reliable filter for understanding trend quality.
For those looking to learn more about technical indicators and market analysis, KuCoin also features educational and trading resources that may be helpful.
Frequently Asked Questions
What does ADX stand for?
Does ADX show whether the market is bullish or bearish?
No. ADX only measures trend strength. Market direction must be determined through the +DI and -DI lines and through price action.
What ADX level is considered strong?
Many analysts treat 25 and above as a sign of meaningful trend strength. Levels below 20 often suggest weak or range-bound conditions.
Is ADX a lagging indicator?
Yes. ADX is based on historical price data and is generally considered a lagging indicator, meaning it confirms strength after a move begins rather than predicting it beforehand.
Is a falling ADX a reversal signal?
Not necessarily. A falling ADX means the current trend is weakening, but price may still continue in the same direction. It is better interpreted as fading momentum rather than an automatic reversal.
Disclaimer: The information in this article is provided for general information only and does not constitute investment advice, financial advice, or a recommendation to buy, sell, or hold any digital asset. Crypto assets involve risk and may not be suitable for all users. Readers should independently verify all information, assess their own risk tolerance, and consult qualified professionals where appropriate before making any financial decisions.