


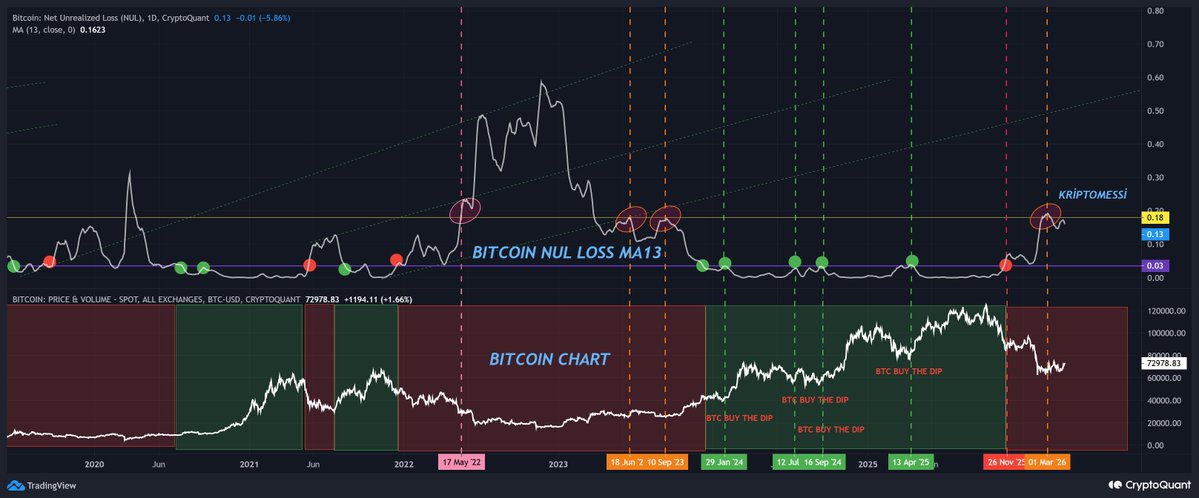
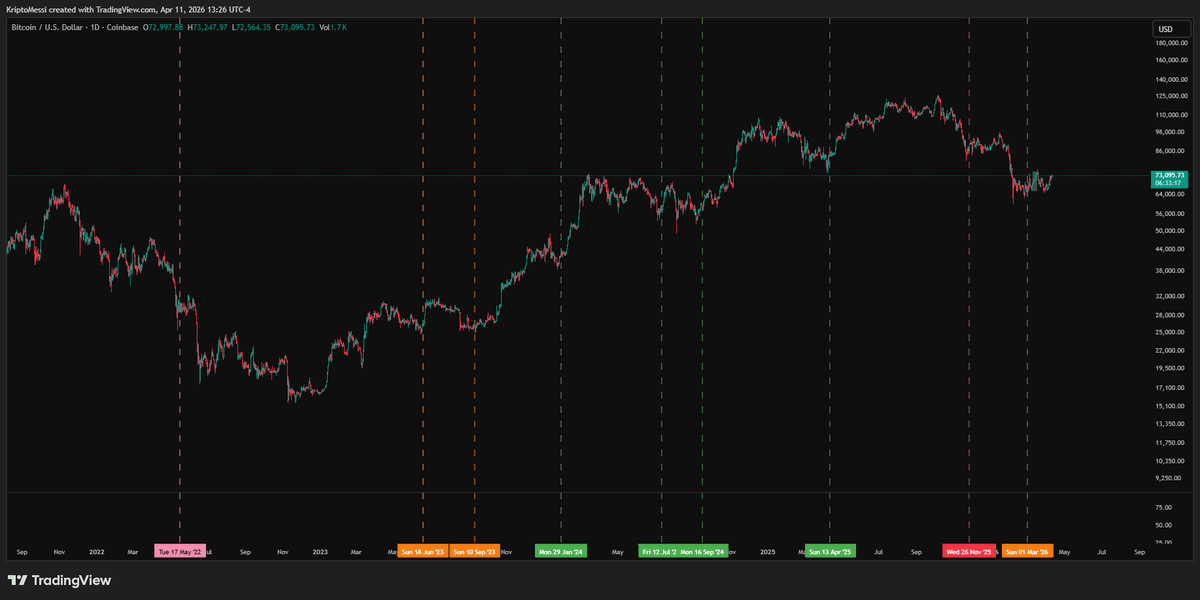
Hello everyone. I’ve prepared a special on-chain analysis for you. I’ve reinforced the Bitcoin NUL Loss data with the MA13. The purple horizontal line: above = bear, below = bull. Simple. We’re currently above the purple line, but there’s a reversal signal in the yellow zone. In the past, the price reversed from this level twice—and both times, a bull market followed. If it reverses again this time, it could be a strong bottom. However, we need a close below the purple line for confirmation. I’ve matched the dates on CryptoQuant and TradingView with the same colors—feel free to compare them yourself. For a detailed explanation of my analysis, see the comments below 👇

Share


Source:Show original
Disclaimer: The information on this page may have been obtained from third parties and does not necessarily reflect the views or opinions of KuCoin. This content is provided for general informational purposes only, without any representation or warranty of any kind, nor shall it be construed as financial or investment advice. KuCoin shall not be liable for any errors or omissions, or for any outcomes resulting from the use of this information.
Investments in digital assets can be risky. Please carefully evaluate the risks of a product and your risk tolerance based on your own financial circumstances. For more information, please refer to our Terms of Use and Risk Disclosure.