


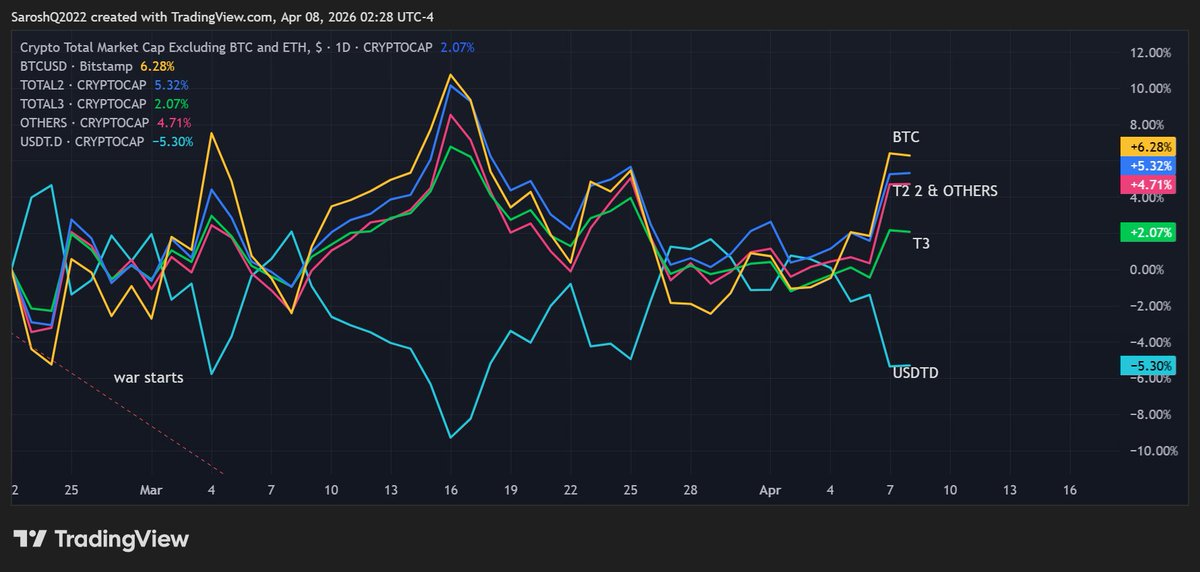
PERFORMANCE ANALYSIS (Since Feb 28 – War Start) Relative Strength Ranking: BTC: +6.28% → strongest TOTAL2: +5.32% → large caps tracking BTC OTHERS: +4.71% → mid caps participating TOTAL3: +2.07% → weakest USDT.D: -5.30% → capital deployed What this shows: Capital entered the system (USDT.D down) That capital prioritized BTC first Then flowed into large caps (TOTAL2) Then into mid caps (OTHERS) Small caps (TOTAL3) lagged the entire move Conclusion (Flow Structure): This is a Top down capital flow: BTC → Large caps → Mid caps → Small caps (incomplete) There is no broad participation yet across the curve, just progressive expansion outward from BTC. Now this cycle is far from dead. Disabled at times. Delayed all last year. Make no mistake liquidity is expanding WoW 21T in debt issued: not QE War ends we rip higher not parabolic That comes by year end unless the madness continues. Not a prediction. I study the numbers. This is what I am seeing. TGA down $30 billion in a week and SOMA up $15 billion WoW and this has been happening since QT ended. But again: high yields, inflation, Oil & dollar are a big drag.

Share


Source:Show original
Disclaimer: The information on this page may have been obtained from third parties and does not necessarily reflect the views or opinions of KuCoin. This content is provided for general informational purposes only, without any representation or warranty of any kind, nor shall it be construed as financial or investment advice. KuCoin shall not be liable for any errors or omissions, or for any outcomes resulting from the use of this information.
Investments in digital assets can be risky. Please carefully evaluate the risks of a product and your risk tolerance based on your own financial circumstances. For more information, please refer to our Terms of Use and Risk Disclosure.