


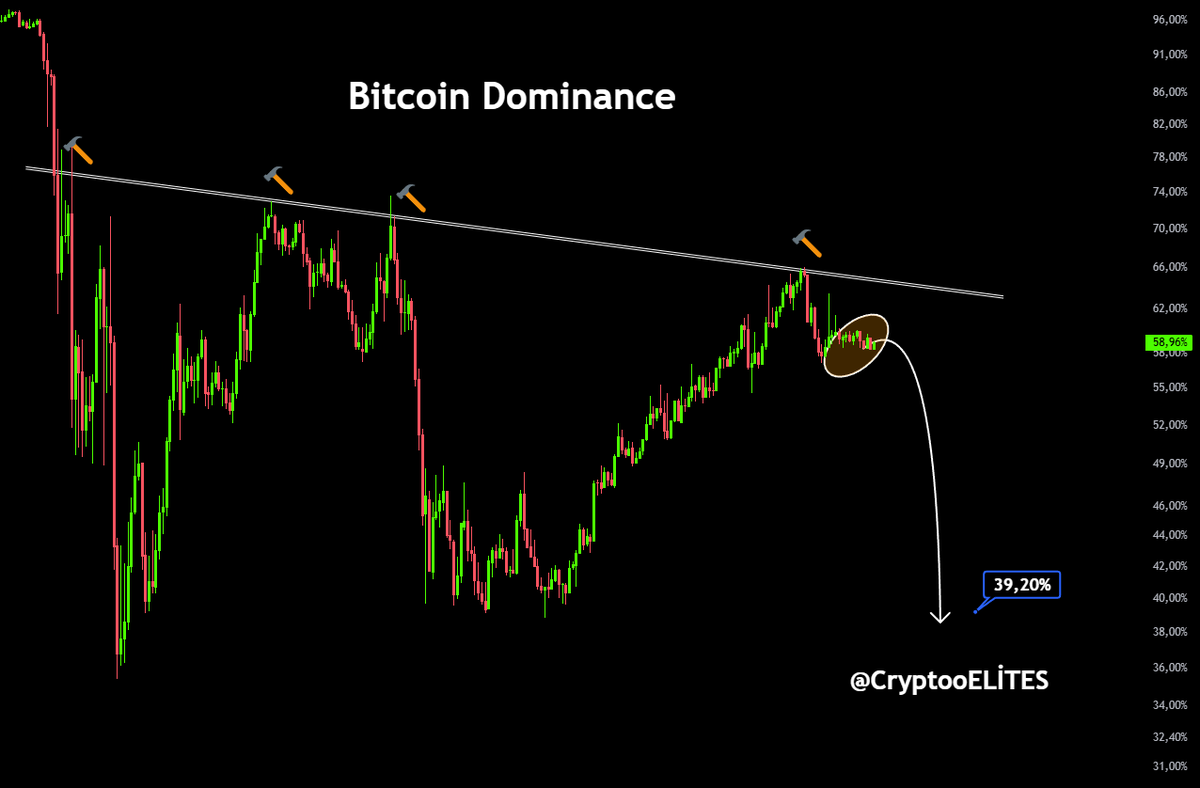
When we examine the Bitcoin Dominance (BTC.D) chart, we observe a critical resistance level currently challenging the market’s dominance structure. The white descending trendline on the chart—marked with hammer icons whenever tested in the past—has historically signaled a pullback in Bitcoin dominance. At its current level of 58.96%, dominance has once again reacted to this resistance zone. If this resistance level behaves as it has in the past and dominance retreats in the direction of the curved arrow on the chart, a medium-term scenario emerges where Bitcoin dominance could decline to as low as 39.20%. Such a significant drop in dominance could signal a shift in market liquidity from Bitcoin to altcoins. This potential breakout in Bitcoin dominance will be the key factor determining whether altcoins can gain breathing room. Do you think this resistance level will hold once again, paving the way for altcoins? #Bitcoin $BTC #Btc

Share


Source:Show original
Disclaimer: The information on this page may have been obtained from third parties and does not necessarily reflect the views or opinions of KuCoin. This content is provided for general informational purposes only, without any representation or warranty of any kind, nor shall it be construed as financial or investment advice. KuCoin shall not be liable for any errors or omissions, or for any outcomes resulting from the use of this information.
Investments in digital assets can be risky. Please carefully evaluate the risks of a product and your risk tolerance based on your own financial circumstances. For more information, please refer to our Terms of Use and Risk Disclosure.