


On-chain data shows the amount of XRP supply sitting underwater has shot up to historically high levels following the recent market downturn.
36.8 Billion Tokens Of The Asset Are Currently Being Held At A Loss
In a new post on X, on-chain analytics firm Glassnode has shared an update on the latest trend in the XRP Total Supply in Loss. This metric measures, as its name suggests, the total amount of the cryptocurrency’s supply that’s currently in a state of net unrealized loss.
The indicator works by checking the on-chain history of each coin in circulation to find what price it was last moved at. If the last transaction price was more than the current spot price for any token, then that particular coin is in a state of loss. The Total Supply in Loss adds up all tokens satisfying this condition.
A counterpart indicator called the Total Supply in Profit takes care of the supply of the opposite type (that is, the coins with a cost basis lower than the latest spot price). Now, here is the chart shared by the analytics firm that shows the trend in the 7-day exponential moving average (EMA) of the XRP Total Supply in Loss over the last few years:

As shown in the graph above, the XRP Total Supply in Loss fell to a relatively low level in 2025, but in the last quarter of the year, the metric rose. The trend change came as the cryptocurrency sector as a whole saw the start of a bearish phase.
Today, the Total Supply in Loss has a value of 36.8 billion XRP. From the chart, it’s visible that this is a relatively high level when compared to the past, with it being surpassed only once before in the current cycle.
The picture is a bit different when the indicator is denominated in USD terms.

As shown in the above chart, the USD version of the XRP Total Supply in Loss set a peak higher than any witnessed in the past few years during the latest market downturn. This suggests that the capital invested in the cryptocurrency has gone up by magnitudes as the years have passed. Currently, supply worth around $50 billion is in a state of loss on the blockchain.
Generally, digital asset markets tend to arrive at bottoms when investor pain is at its highest. As such, considering the current loss situation on the XRP network, it only remains to be seen whether the coin will reach a bottom in the near future.
XRP Price
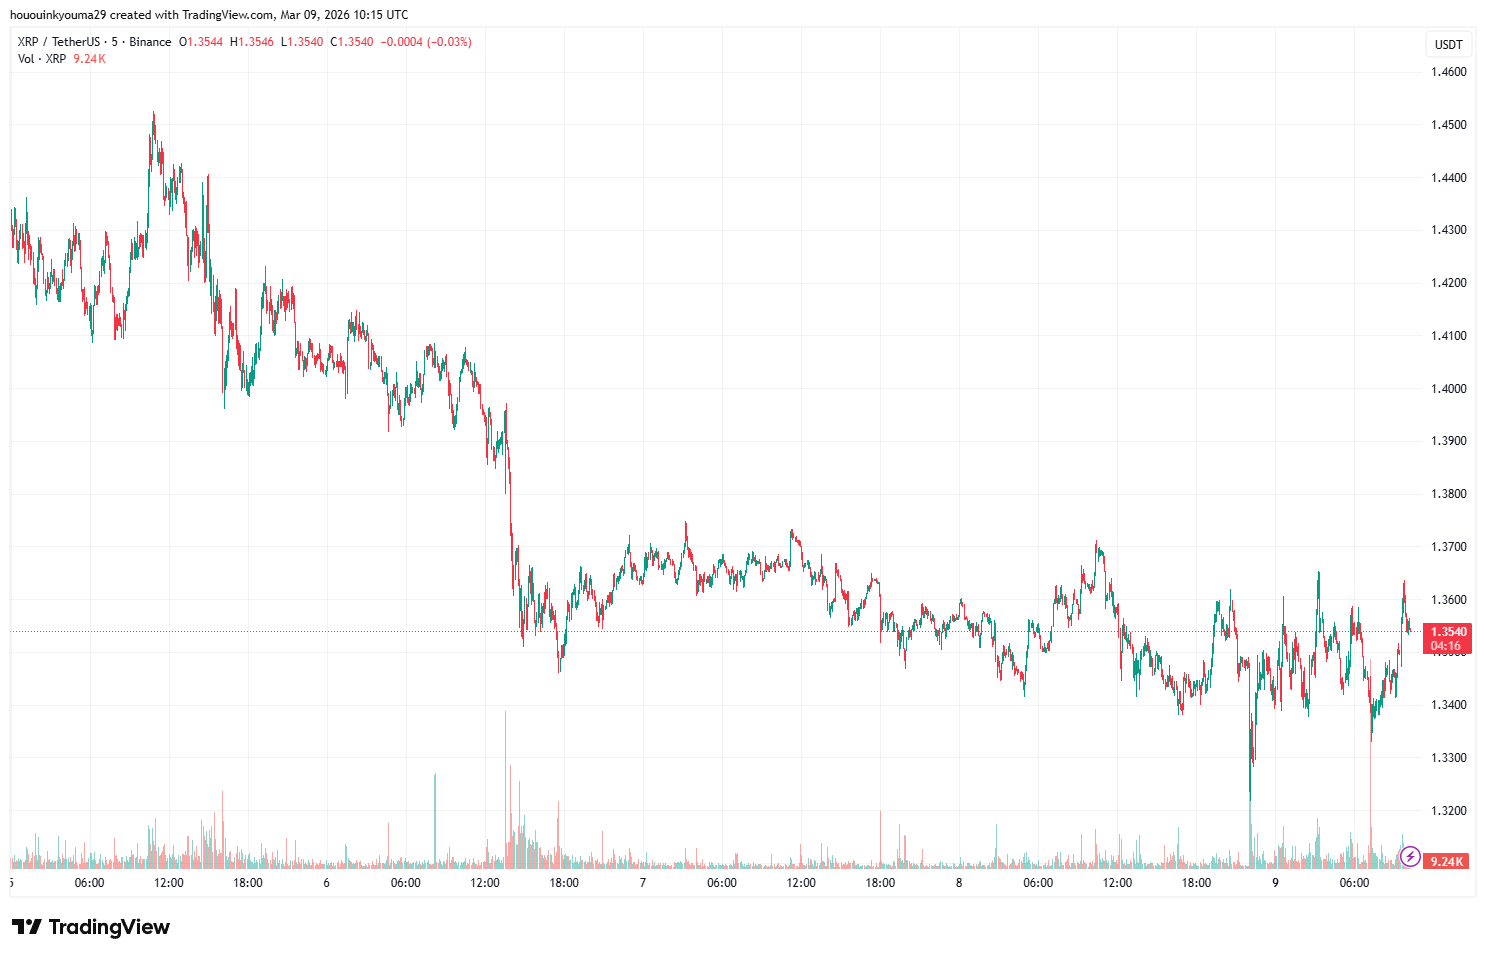
At the time of writing, XRP is floating around $1.35, down over 0.5% in the last 24 hours.