


Original Author: Garrett
Original Translation: Saoirse, Foresight News
Recently, some analysts have been comparing the current price movement of Bitcoin to that of 2022.
Indeed, the short-term price trends of the two may appear somewhat similar. However, from a long-term perspective, such a comparison is entirely absurd.
From the perspective of long-term price patterns, macroeconomic background, investor composition, and supply-demand/holding structures, there are fundamental differences in the underlying logic between the two.
In the analysis and trading of financial markets, the biggest mistake is to focus solely on short-term, superficial statistical similarities while neglecting long-term, macro-level, and fundamental driving factors.
Completely opposite macroeconomic background
In March 2022, the United States was deeply entrenched in a period of high inflation and interest rate hikes. The driving factors behind this included:
- Excess liquidity during the COVID-19 pandemic;
- The chain reactions caused by the Ukraine crisis have further significantly increased inflation.
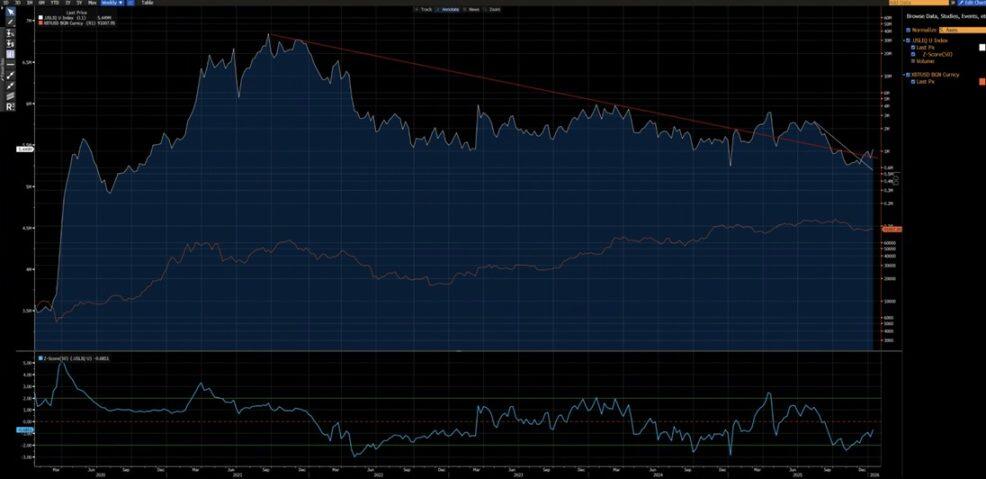
At that time, risk-free interest rates continued to rise, liquidity was systematically withdrawn, and the financial environment kept tightening.
In such an environment, the primary goal of capital is to avoid risks. The Bitcoin price movement we are seeing essentially reflects a topping-off distribution pattern during a tightening cycle.
The current macro environment is exactly the opposite:
- The situation in the Ukraine conflict continues to ease (partly due to U.S. efforts to reduce inflation and lower interest rates);
- Both the Consumer Price Index (CPI) and the risk-free interest rate in the United States are showing a downward trend;
- More importantly, the AI technology revolution has significantly increased the likelihood of the economy entering a prolonged deflationary cycle. Therefore, from a broader cyclical perspective, interest rates have entered a phase of reductions;
- Central banks around the world are re-injecting liquidity into the financial system;
- This means that capital currently exhibits a "risk preference" characteristic.
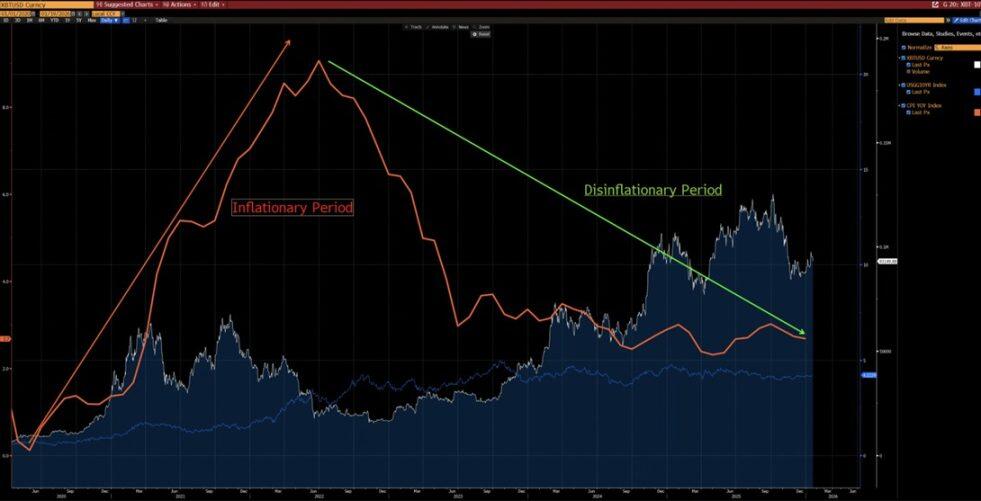
As can be seen from the chart below, since 2020, Bitcoin has shown a clear negative correlation with the year-over-year change in CPI. During inflationary upturns, Bitcoin tends to decline, while during periods of slowing inflation, Bitcoin tends to rise.
Against the backdrop of a technology revolution driven by artificial intelligence, long-term deflation is a likely scenario—Elon Musk agrees with this view, which further supports our argument.
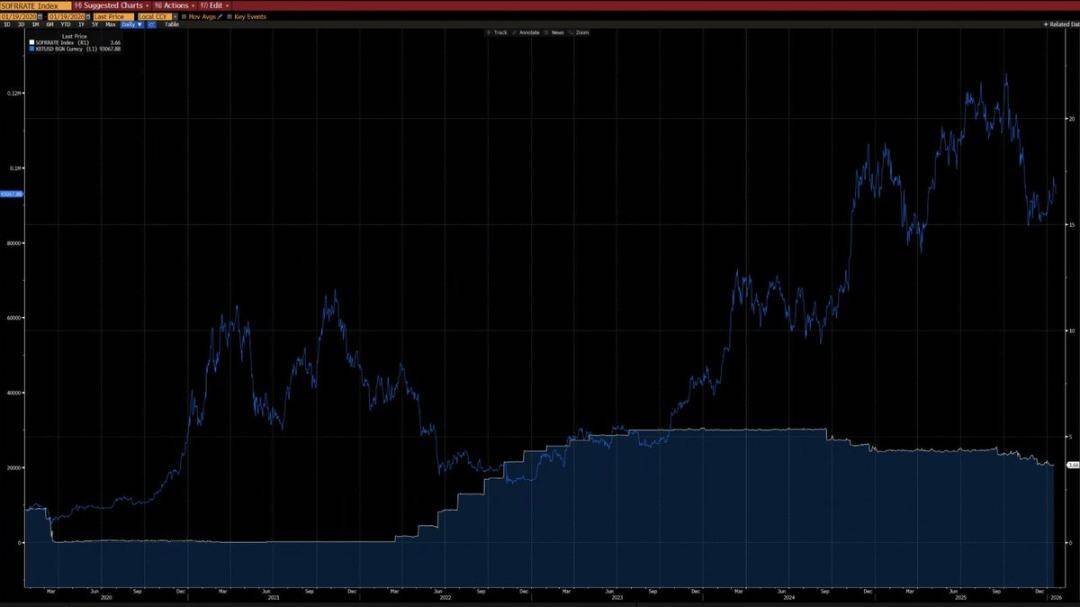
From another chart below, we can also observe that since 2020, Bitcoin has shown a very strong correlation with the U.S. liquidity index (excluding data distortions in 2024 caused by ETF inflows). Currently, the U.S. liquidity index has already broken through both the short-term (white line) and long-term (red line) downtrend lines — indicating the emergence of a new uptrend.
Completely different technical architecture
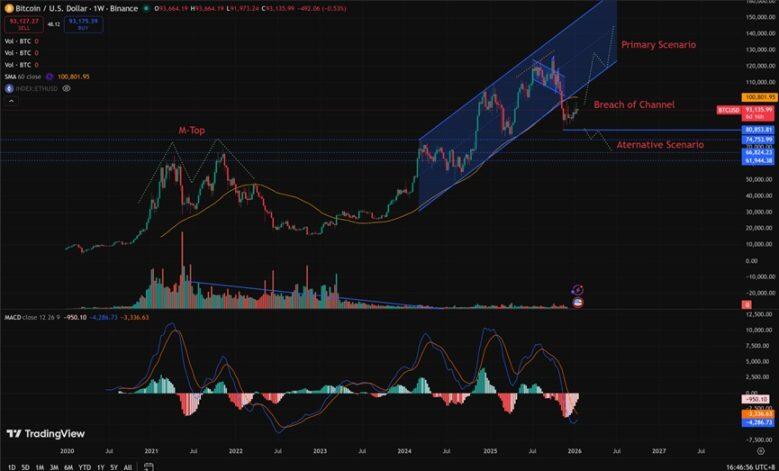
- 2021–2022: The weekly chart formed an "M-top" pattern. This type of formation is typically associated with long-term market tops and can suppress price movements over an extended period.
- 2025 (affecting the early 2026 trend): The weekly chart breaks below the ascending channel. From a probabilistic perspective, this is more likely to be a "bear trap" before a rebound back into the channel.
Of course, we cannot completely rule out the possibility that the current trend could evolve into a continuation of the 2022-style bear market. However, it is important to note that the range between $80,850 and $62,000 has previously experienced extensive consolidation and position swapping.
This early-stage accumulation of positions provides a much better risk-reward ratio for bullish positions — the upside potential significantly exceeds the downside risk.
What conditions need to be met to replicate the 2022-style bear market?
To recreate a bear market like the one in 2022, the following key conditions must be met:
- A new round of inflationary shocks, or a major geopolitical crisis of a scale comparable to that of 2022;
- Central banks around the world are restarting interest rate hikes or resuming quantitative tightening (QT) policies through their balance sheets;
- Bitcoin's price has shown a decisive and sustained breakdown below the $80,850 level.
It is premature and speculative to claim that the market has entered a structural bear phase before all these conditions are fully met; such a claim would not be a conclusion based on rational analysis.
Significantly different investor structure
- 2020–2022: The market was dominated by retail investors, with limited participation from institutional investors, especially long-term allocators.
- Since 2023: The launch of Bitcoin ETFs introduced "structural long-term holders," effectively locking up a portion of the Bitcoin supply, significantly reducing trading activity, and notably lowering volatility.
In 2023, both from a macroeconomic perspective and quantitative analysis standpoint, Bitcoin has reached a structural inflection point as an asset.
The volatility range of Bitcoin has also undergone a fundamental shift:
- Historical Volatility: 80%-150%
- Current volatility: 30%-60%
This change implies that the asset characteristics of Bitcoin have fundamentally shifted.
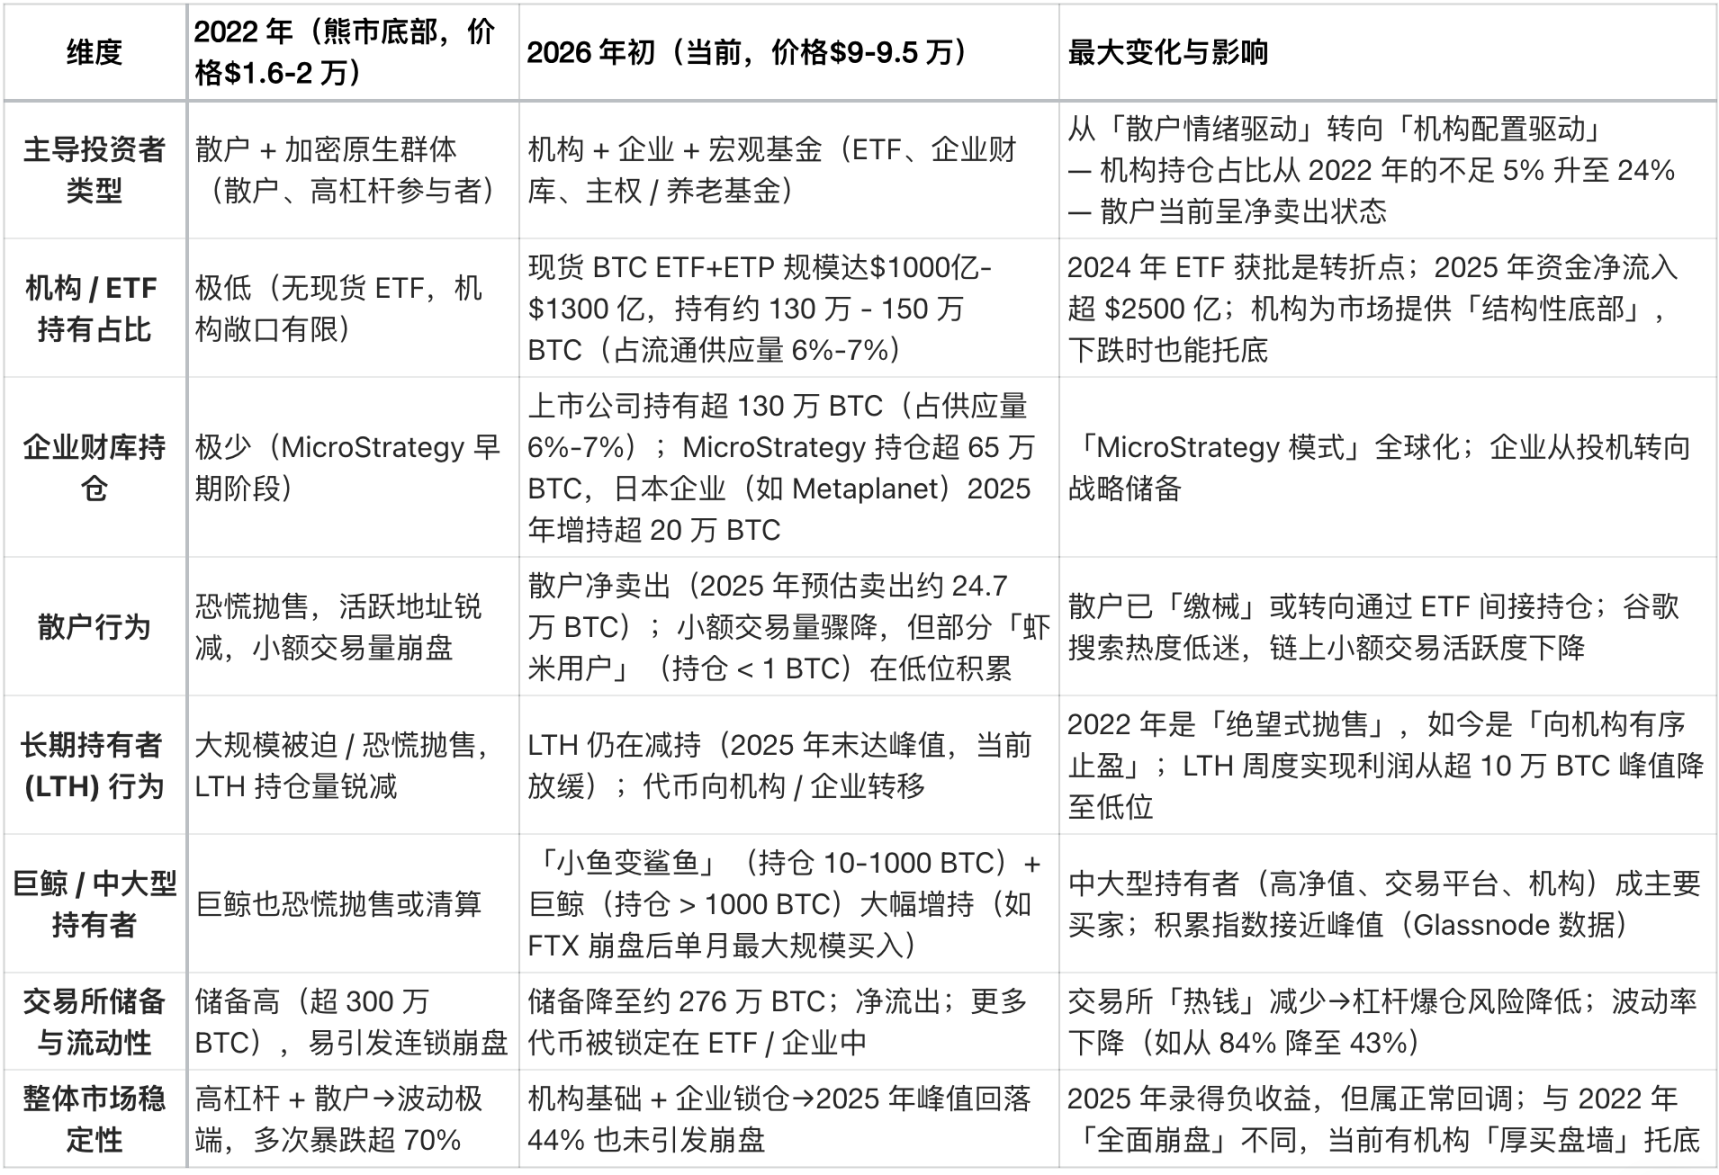
Core Structural Differences (Current vs. 2022)
The biggest difference in the structure of Bitcoin investors in early 2026 compared to 2022 is that the market has shifted from being "retail-dominated and highly leveraged speculative" to being "institutional-dominated and structurally long-term held."
In 2022, Bitcoin experienced a typical "crypto-native bear market," triggered by retail panic selling and chain reactions of leveraged liquidations.
Today, Bitcoin has entered a much more mature "institutional era," characterized by:
- Stable underlying demand
- Some supplies are locked in the long term.
- The volatility has reached an institutional level.
The following is a core comparison made by Grok based on on-chain data (such as from Glassnode and Chainalysis) and institutional reports (such as from Grayscale, Bitwise, and State Street Corporation) as of mid-January 2026 (when the price of Bitcoin was between $90,000 and $95,000):