


Vince Token [VVV] has delivered one of its strongest performances in recent sessions, surging 17% in the early hours of trading.
This sharp upswing reflects building momentum, with market conditions aligning for a possible extension toward new highs.
Capital inflows reinforce bullish conviction
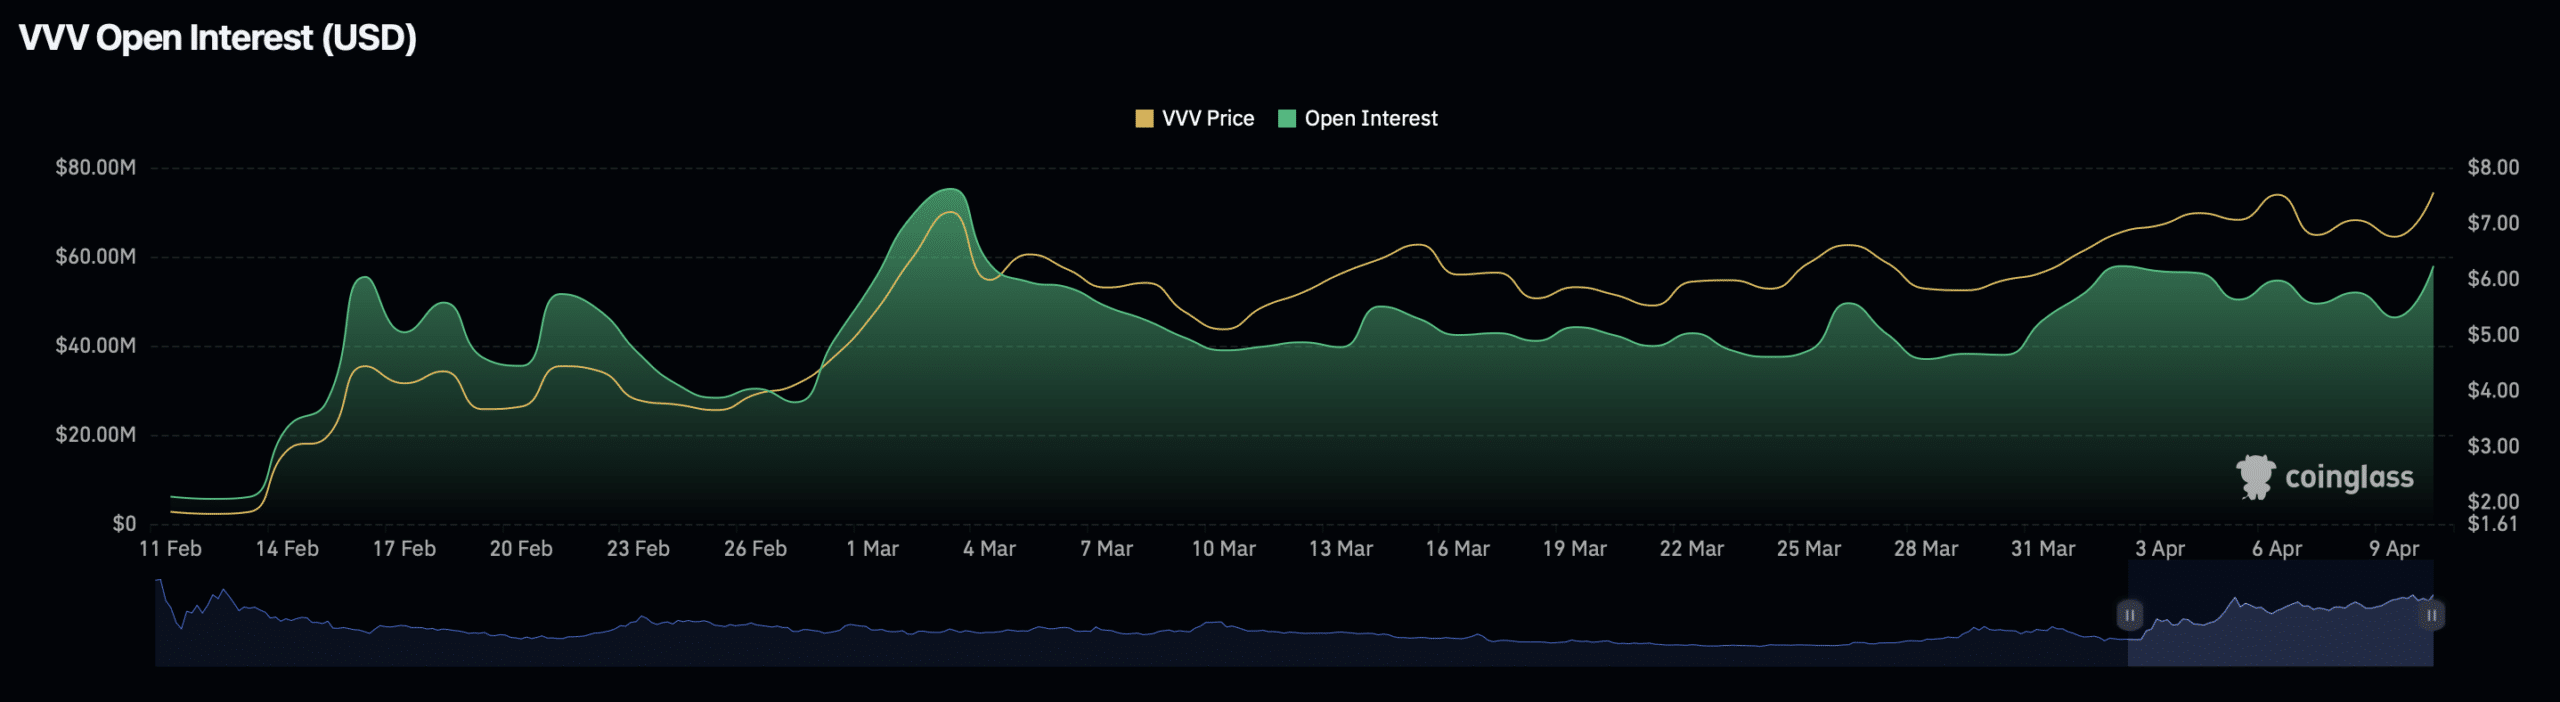
The clearest driver behind this move is the surge in activity within the VVV perpetual market.
At the time of writing, capital inflows have climbed significantly. Data from CoinGlass showed inflows reaching $59.84 million, while Funding Rates remained firmly tilted toward long positions.
Funding Rates have risen to 0.0085%, indicating that traders were increasingly willing to pay a premium to maintain long exposure. This reflected growing confidence in continued upside.
At the same time, short traders have faced mounting pressure. Liquidation data revealed a clear imbalance, with bearish positions absorbing the bulk of losses.
Over the past 24 hours, long liquidations have remained minimal at $28,000, while short liquidations have surged to $215,000. This disparity highlighted aggressive short squeezes, further fueling upward price movement.
Momentum indicators favor continued upside
Technical indicators have continued to align with VVV’s bullish structure. The Bull Bear Power (BBP) confirmed that buyers remained in control of the market.
The indicator, which tracks the dominance of bulls versus bears over a set period, showed a sustained green histogram on the daily timeframe at press time, signaling consistent buying pressure.
Notably, BBP has returned to levels last seen on the 13th of March, reinforcing the view that demand has strengthened meaningfully. The persistence of this trend suggests that buyers remain active and committed.
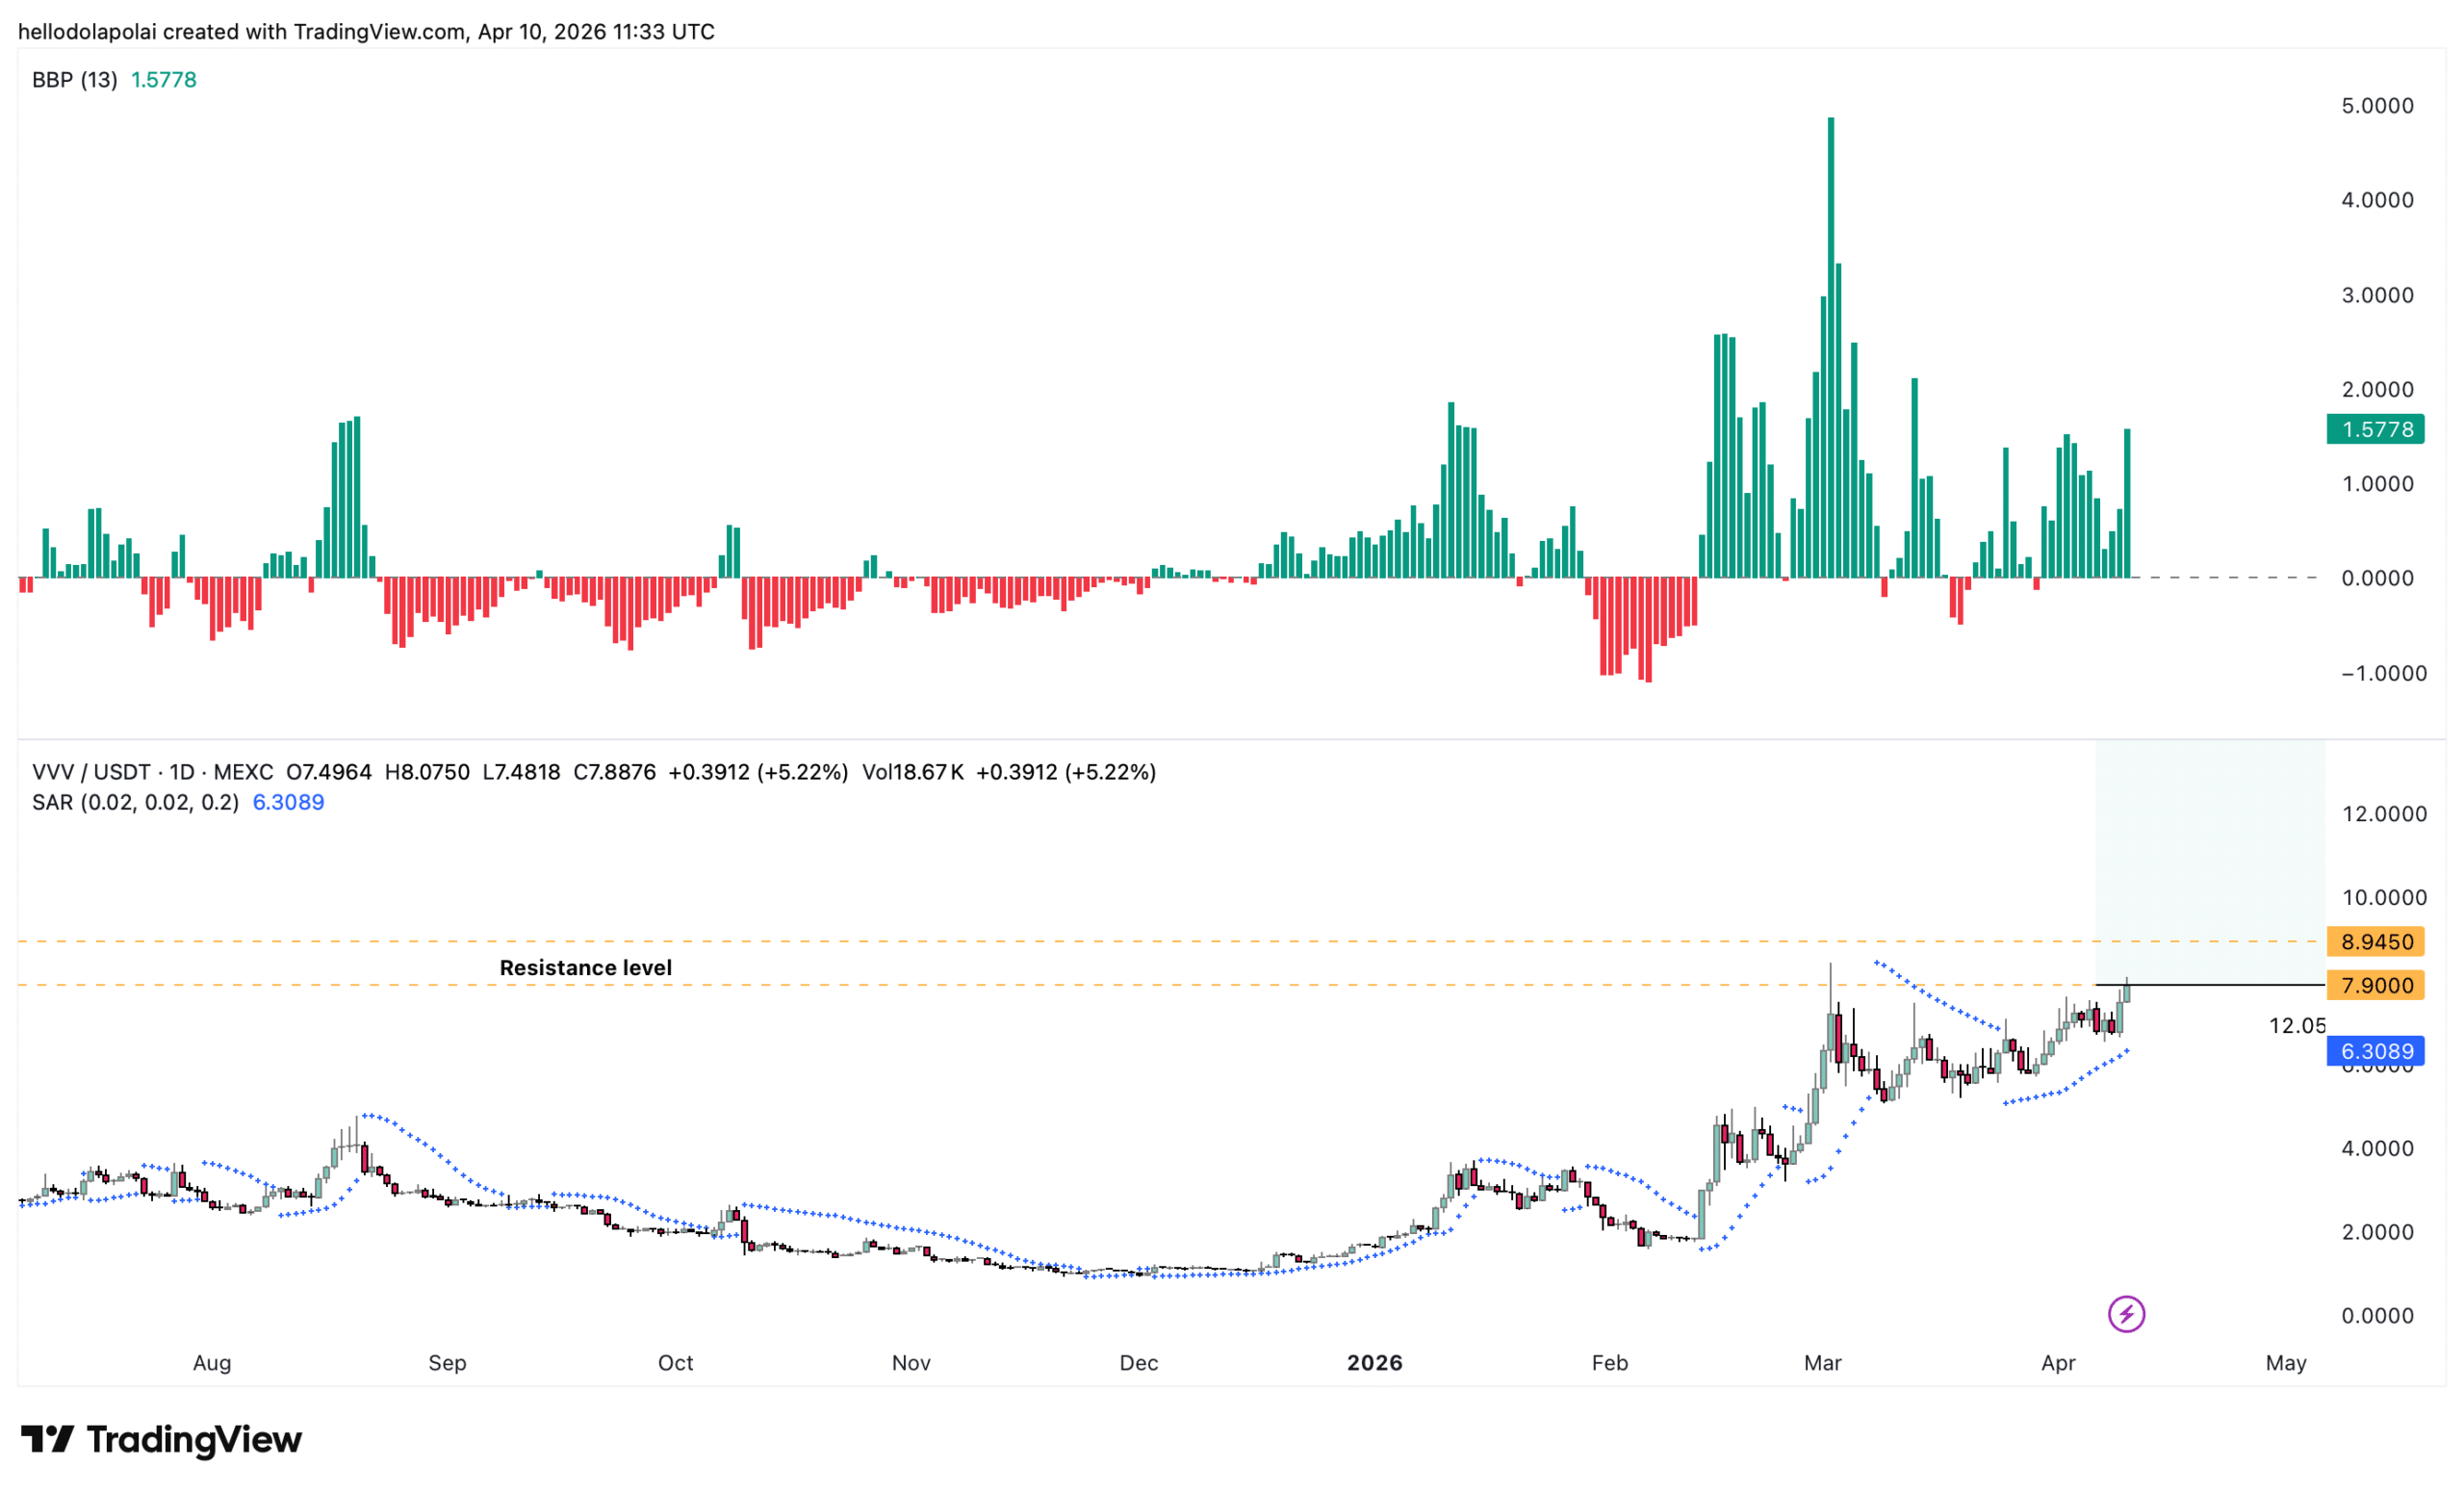
The Parabolic SAR (Stop and Reverse) further supports this outlook. Its dots remain positioned below the current price, a classic indication of an active uptrend and strengthening momentum.
With no visible signs of exhaustion among buyers, the structure remains firmly bullish, leaving room for further expansion.
All-time high back in focus for VVV
Given the current trajectory, a move toward a new all-time high is increasingly within reach.
Price action shows little resistance between current levels and a broader breakout zone, suggesting that VVV could transition into price discovery if momentum holds.
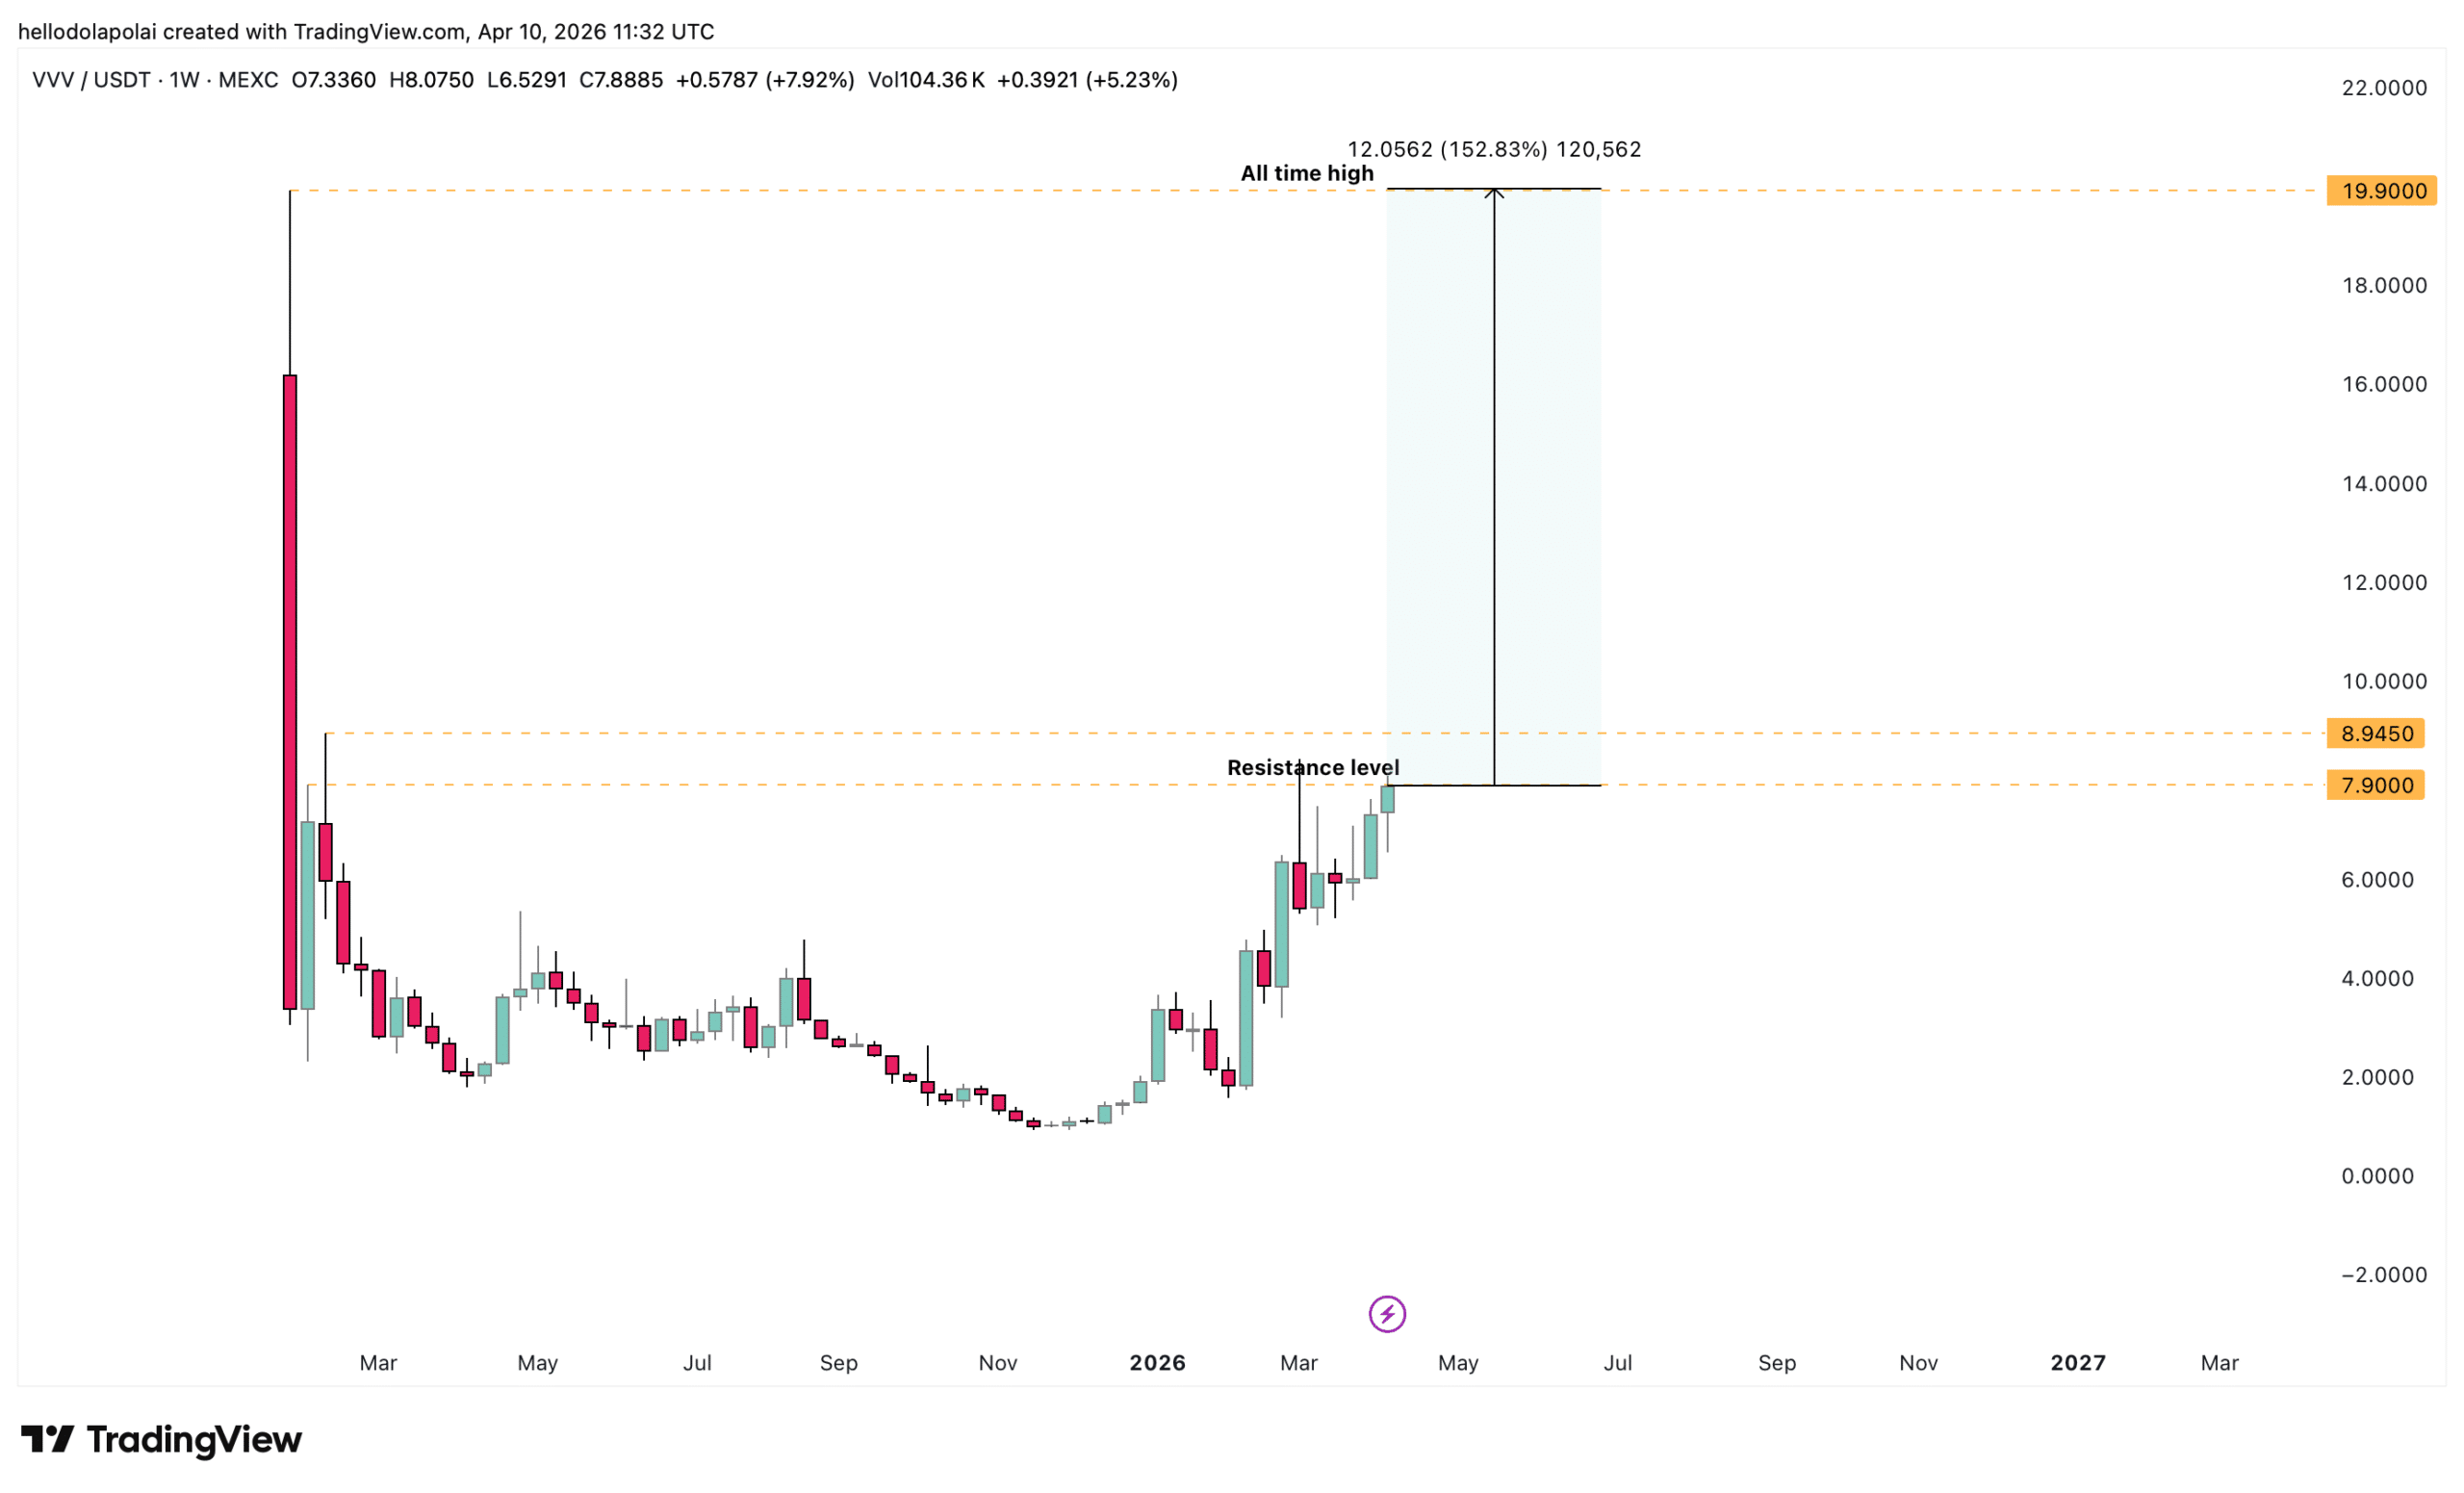
If the asset maintains its pattern of higher highs and higher lows, a 152% upside move appears achievable, bringing it back to its previous all-time high of $19.9.
A sustained push beyond that level would confirm a full breakout, placing VVV in a position to establish a new all-time high.
Final Summary
- VVV’s move is strongly supported by perpetual traders, with rising capital inflows and positive funding rates reinforcing a bullish long-term outlook.
- Technical indicators point to sustained upside, with VVV showing a clear structure that favors a continued rally and a potential breakout.