


Author: a16z New Media
Compiled by: DeepChain TechFlow
DeepChain Overview: a16z’s latest Chart Weekly uses extensive data to break down a core argument: the tech industry’s dominance over the global economy is still accelerating. The combined market capitalization of the world’s top ten companies now exceeds the GDP of all G7 nations except the U.S., and AI may reshape organizational structures as profoundly as railroads once did with the birth of modern corporate systems. Meanwhile, stablecoins are evolving from mere transfer tools into real-world payment use cases, and trust in traditional media among American youth has reached historic lows.
Software is eating the world
We certainly have a bias, but the importance of technology to the global economy is truly hard to overstate.
You could even say that software has really eaten the world:
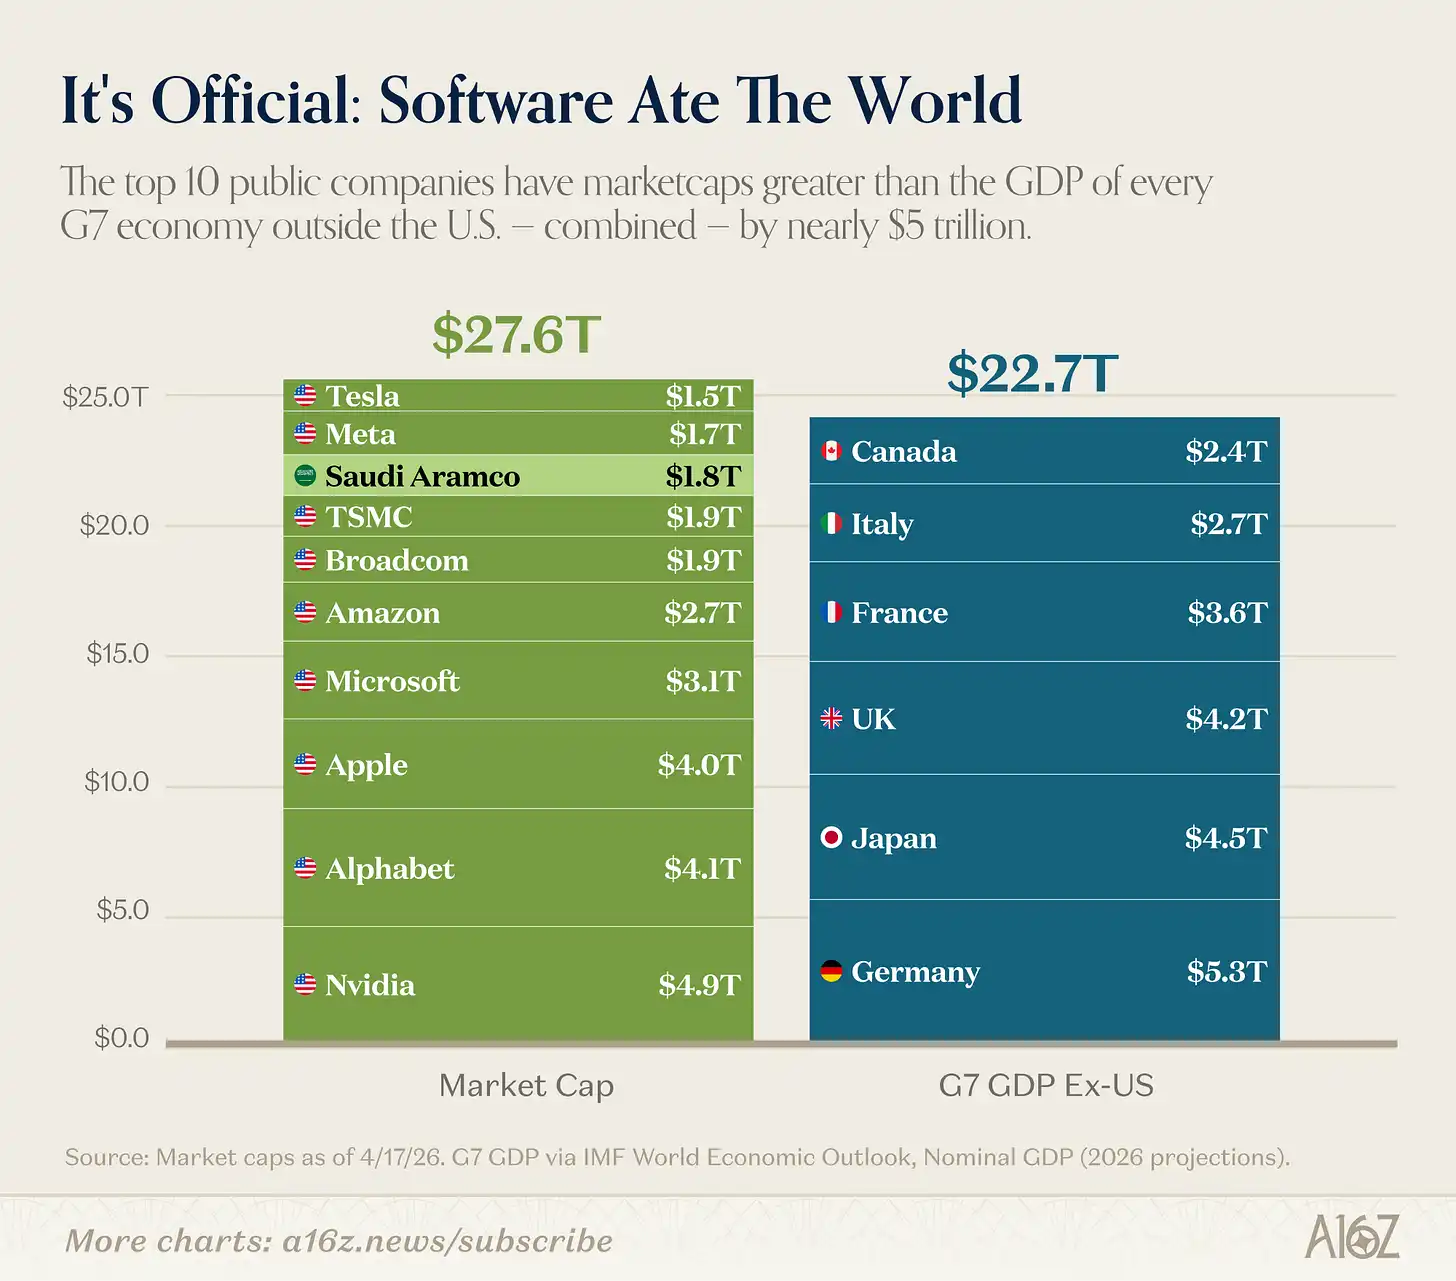
Caption: Top 10 largest companies by global market cap vs. GDP of G7 countries (excluding the U.S.)
The combined market capitalization of the top ten global companies by market cap exceeds the total GDP of all G7 countries except the United States. Even if you exclude Saudi Aramco—no one would classify it as a "tech company"—the conclusion holds. (Though Saudi Aramco was indeed founded in San Francisco!) [^1]
To be fair, the top ten are more like "technology + semiconductors (plus Tesla and Apple, which don’t fit neatly into any category)" rather than pure software companies. But the conclusion remains the same: technology isn’t just a big business—it’s the biggest business.
And the takeover of technology across the globe happened quickly:
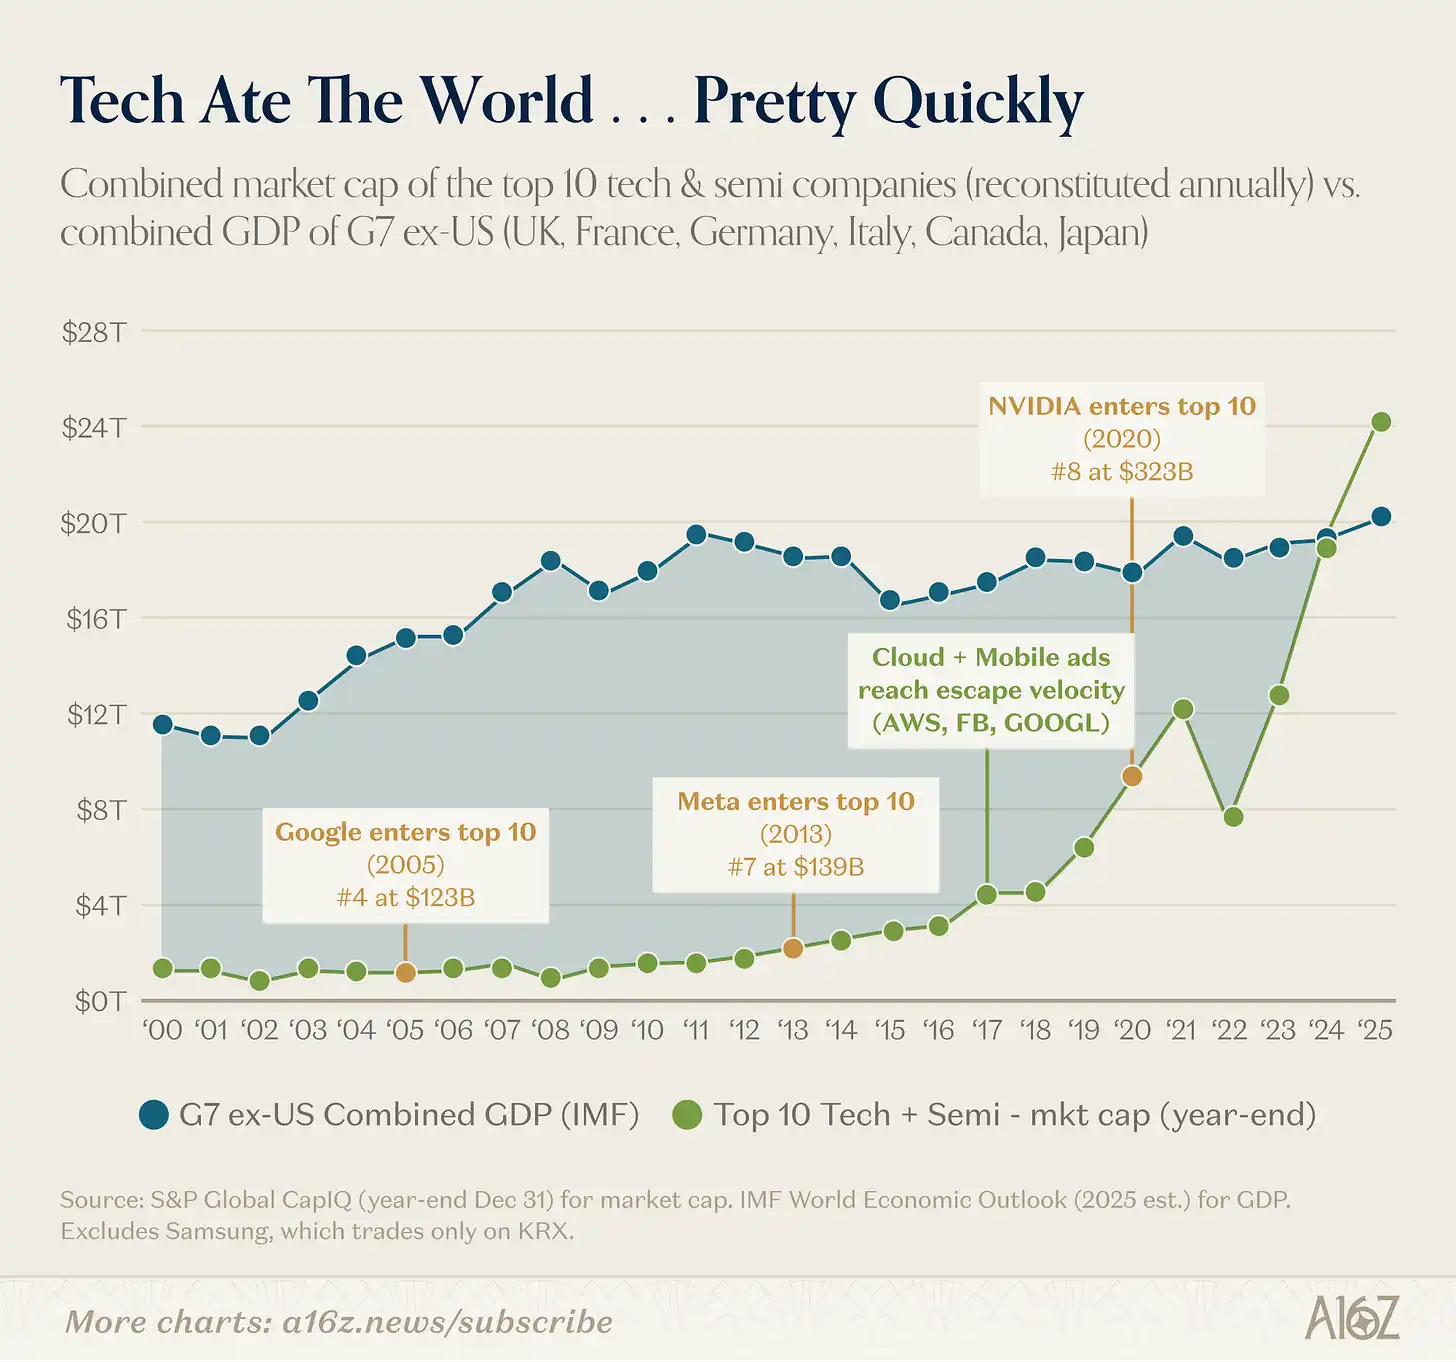
Caption: Market capitalization of the top ten tech companies vs. G7 GDP (excluding the U.S.), time series
The combined market capitalization of the top ten tech companies was once a fraction of the GDP of the G7 (excluding the U.S.), until cloud computing truly took off between 2016 and 2017. Since then, in less than a decade, their combined market cap has surpassed the entire world’s GDP excluding China.
The rise of technology is not simply a matter of replacing one set of winners with another.
The largest companies are much bigger than they were 10 years ago:
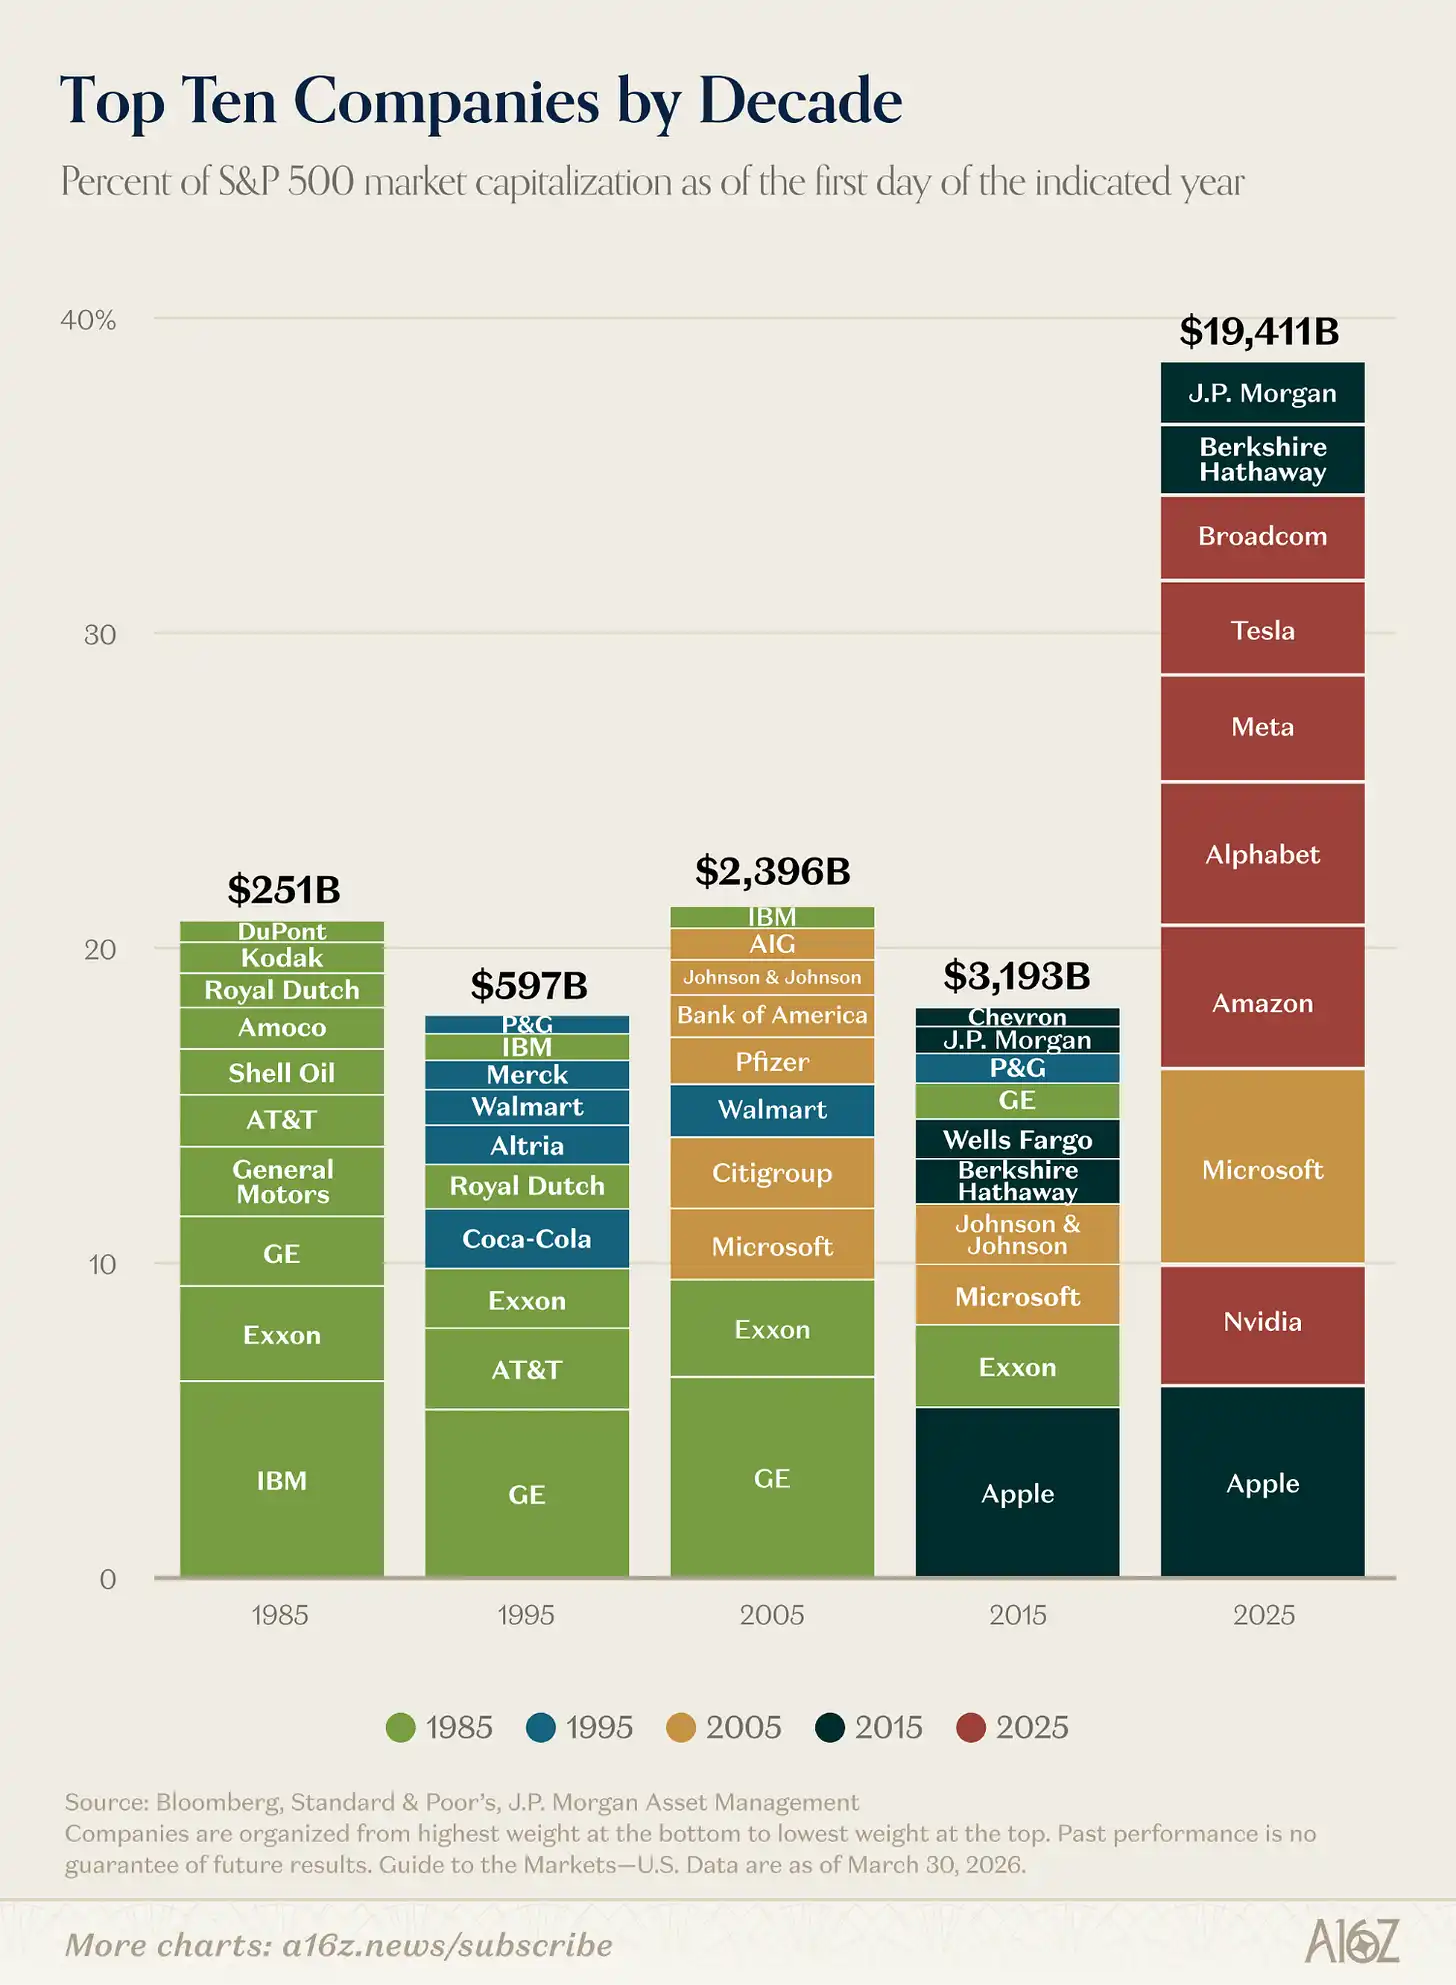
Caption: Changes in market capitalization and share of the top ten companies in the S&P 500
The combined market capitalization of the top 10 companies in the S&P 500 is about six times higher than in 2015, and their share of the index's total market capitalization has doubled.
There was indeed a "blood transfusion." The composition of the top ten has changed dramatically compared to the previous decades. By 2025, only three were holdovers from the previous decade, and only one (Microsoft, a technology company) remained from the decade before that.
If you were an investor in 2015 trying to model tech stocks using the largest companies in the index at the time, you would have underestimated the upside by about six times. Technology fundamentally «broke the model», redefining how large a company could become.
And this ceiling seems to be moving even higher.
In fact, the central role of technology in the global growth story has recently been further strengthened. Last week, we showed that the earnings growth outlook for the technology sector is approximately twice that of the rest of the market. Looking further back, you’ll find that technology is contributing a historically large share of overall market earnings growth:
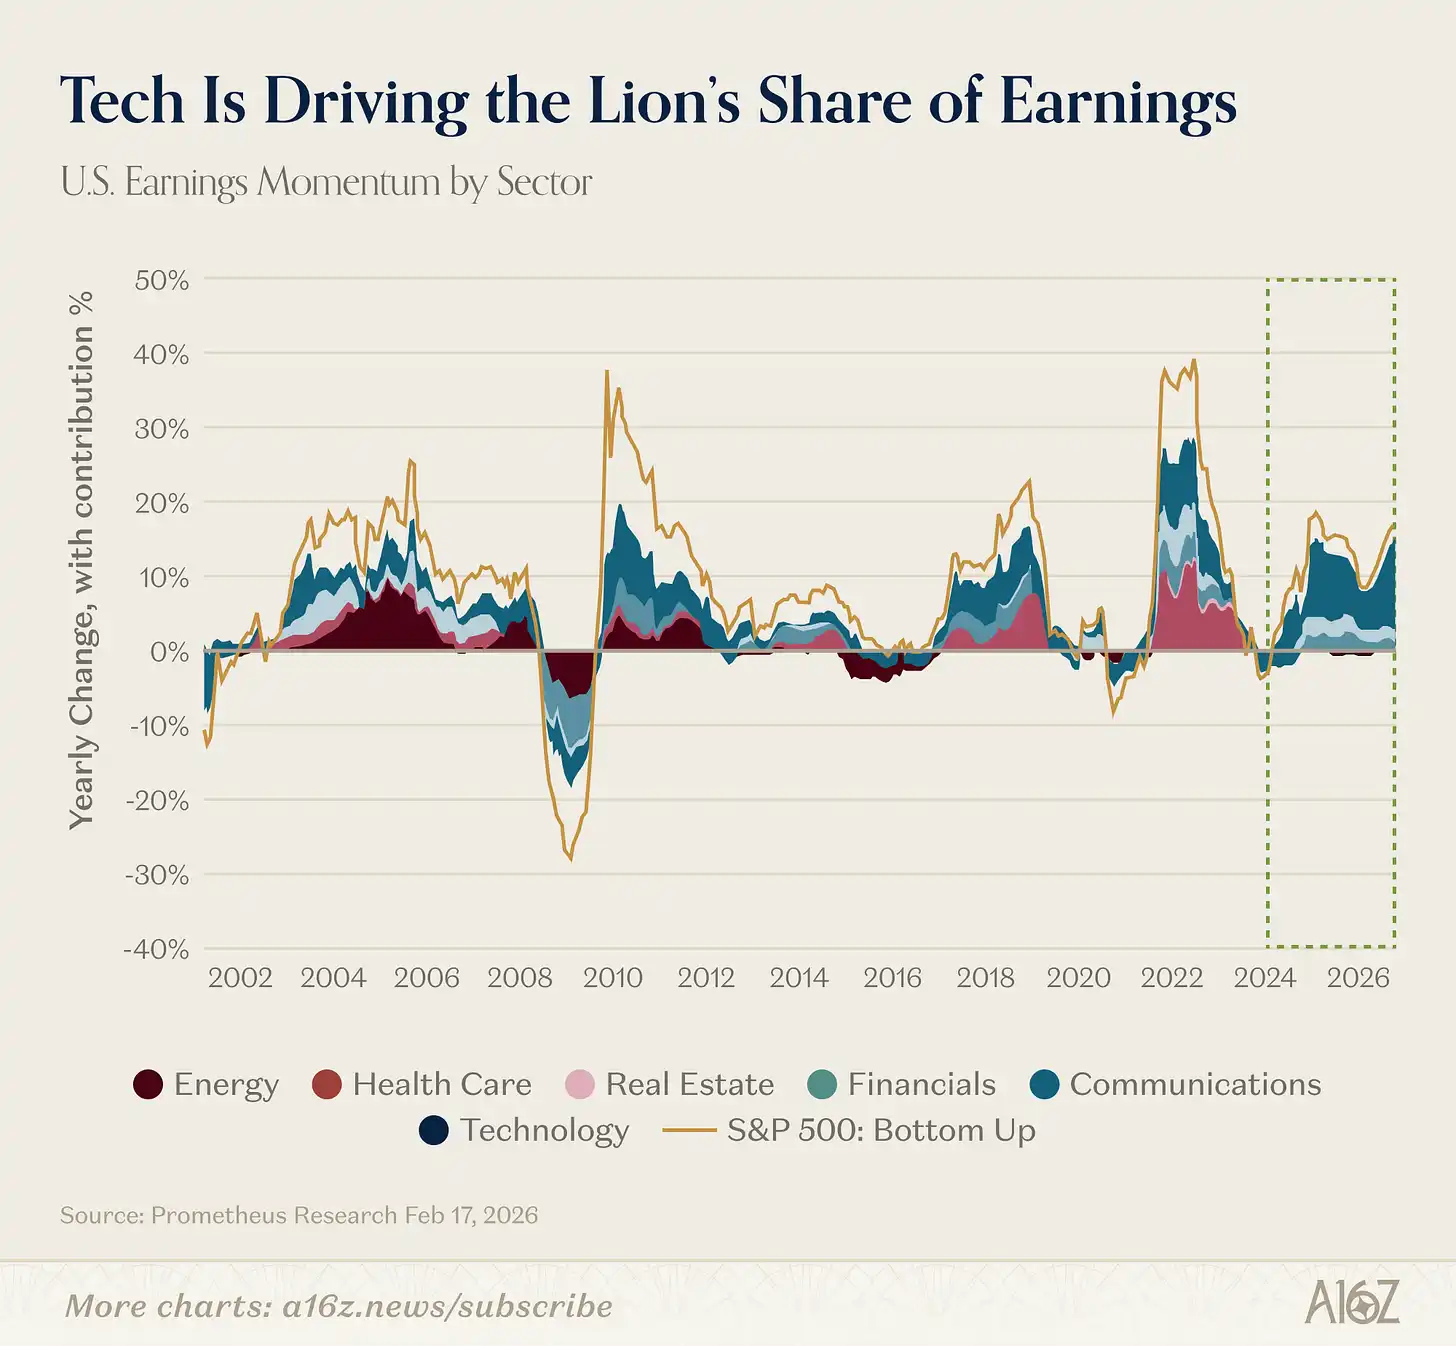
Caption: Contribution percentage of each industry to overall market profit growth
Since 2023, technology has accounted for over 60% of the market's total profit growth.
Aside from the brief prominence of the energy sector in the early 21st century, no other industry has played such a central role in profit growth for so long.
Today, technology is not merely a cycle—it is the cycle itself.
Railway GPT
We just said that technology is an unprecedented event, but that statement is actually not entirely accurate.
During the Industrial Age, no industry was more dominant than railroads:
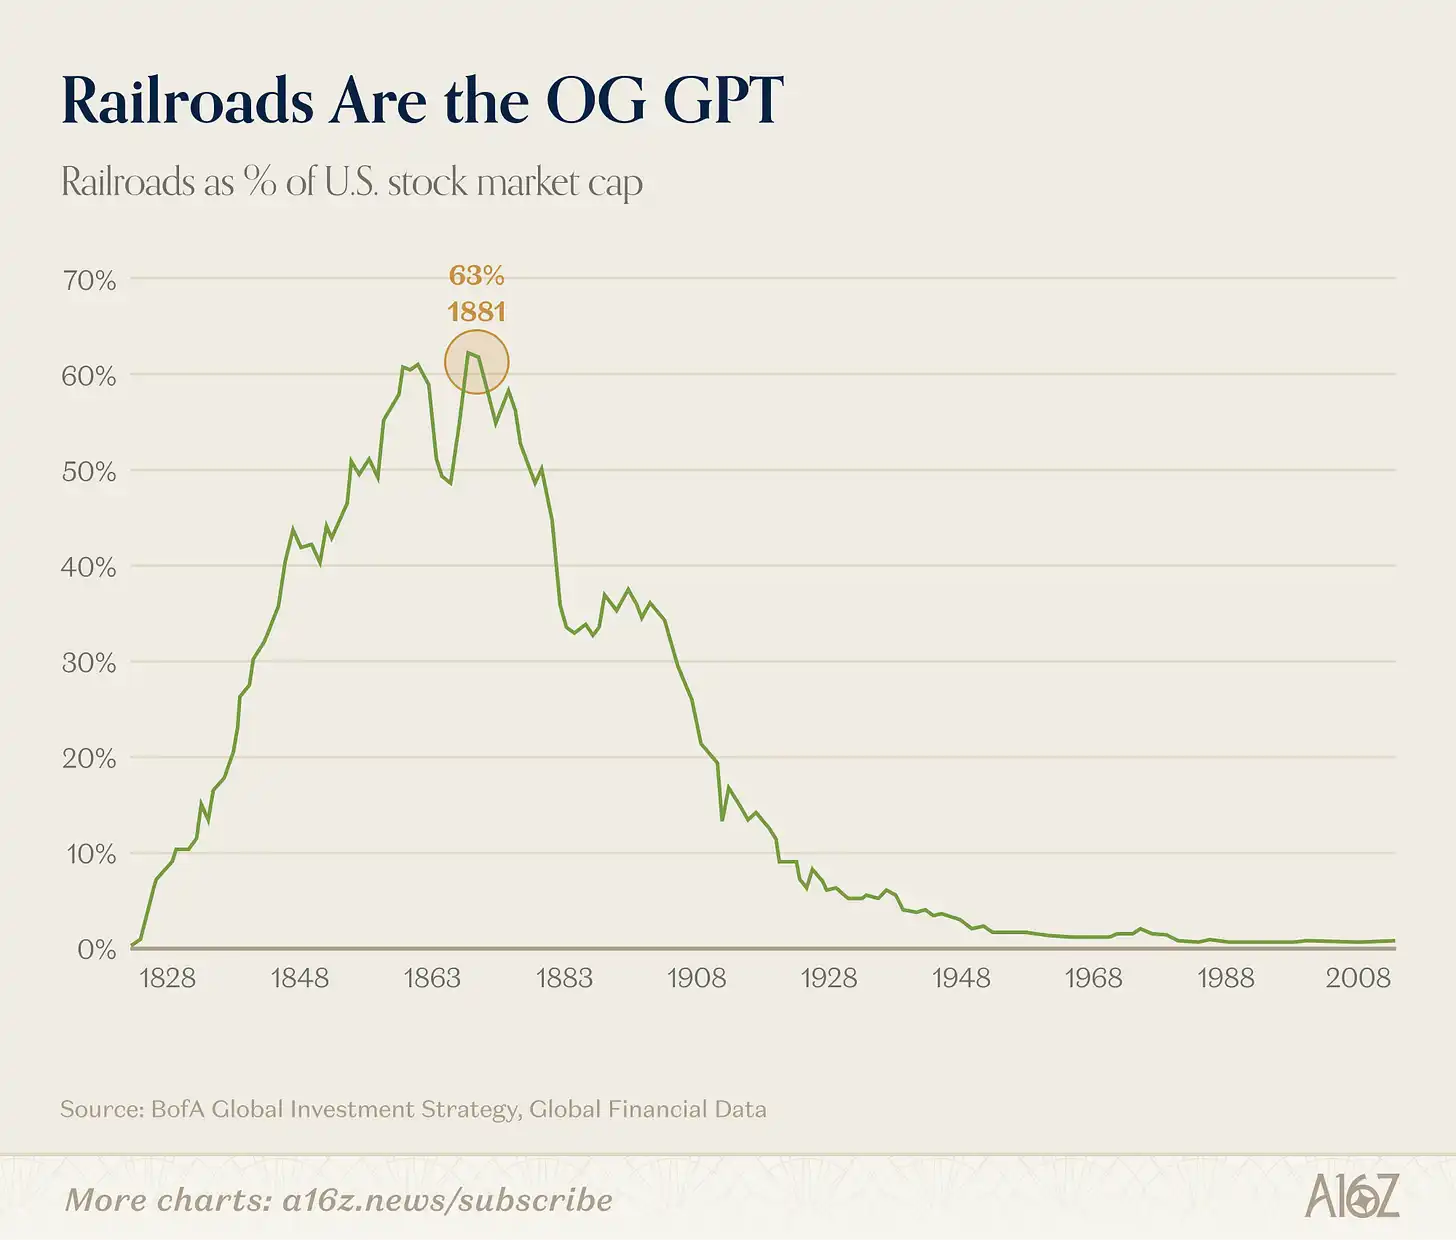
Caption: The railway industry's share of total market capitalization in the U.S. market (historical peak of approximately 63%)
At its peak, railroads accounted for approximately 63% of the total market capitalization in the United States, according to Bank of America, which called it "the most dominant innovative industry in history."
Bearish investors like to tell this story using this railway chart: Look, railways once accounted for 63% of the market, but after the bubble burst, they’re now negligible.
But it’s not that simple. Railroads are still important today; what actually happened is that railroads gave rise to an entirely new economic system—one that was previously unimaginable—and this system is much larger than the railroads themselves.
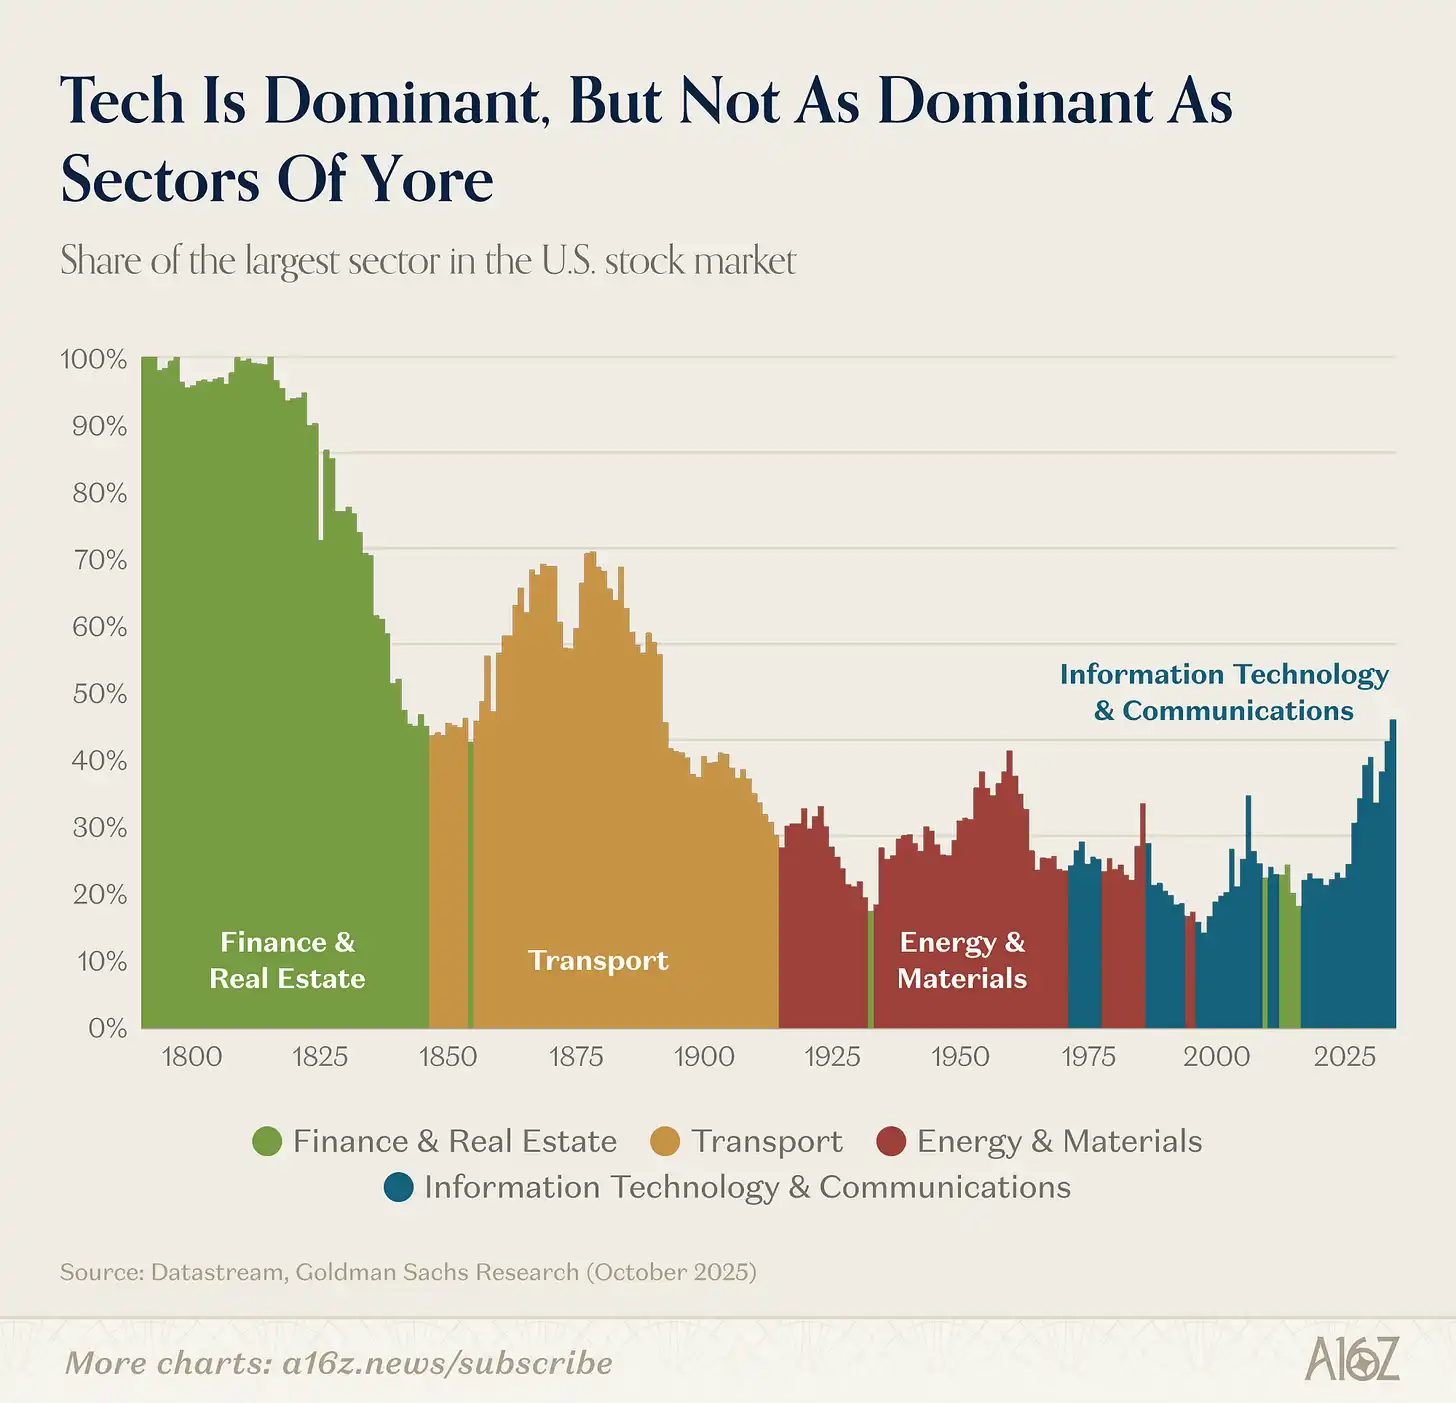
Caption: Changes in market capitalization share by sector in U.S. stock markets (19th century to present)
Rail gave way to industry, which in turn gave way to technology (with finance and real estate briefly rising in between before the global financial crisis).
Although technology is large today, in relative terms, it is much smaller than the transportation industry (or real estate and finance) at its peak in the 19th century.
The economy has become larger and more complex. Today, about 70% of industries in the market either did not exist or were very small in 1900.
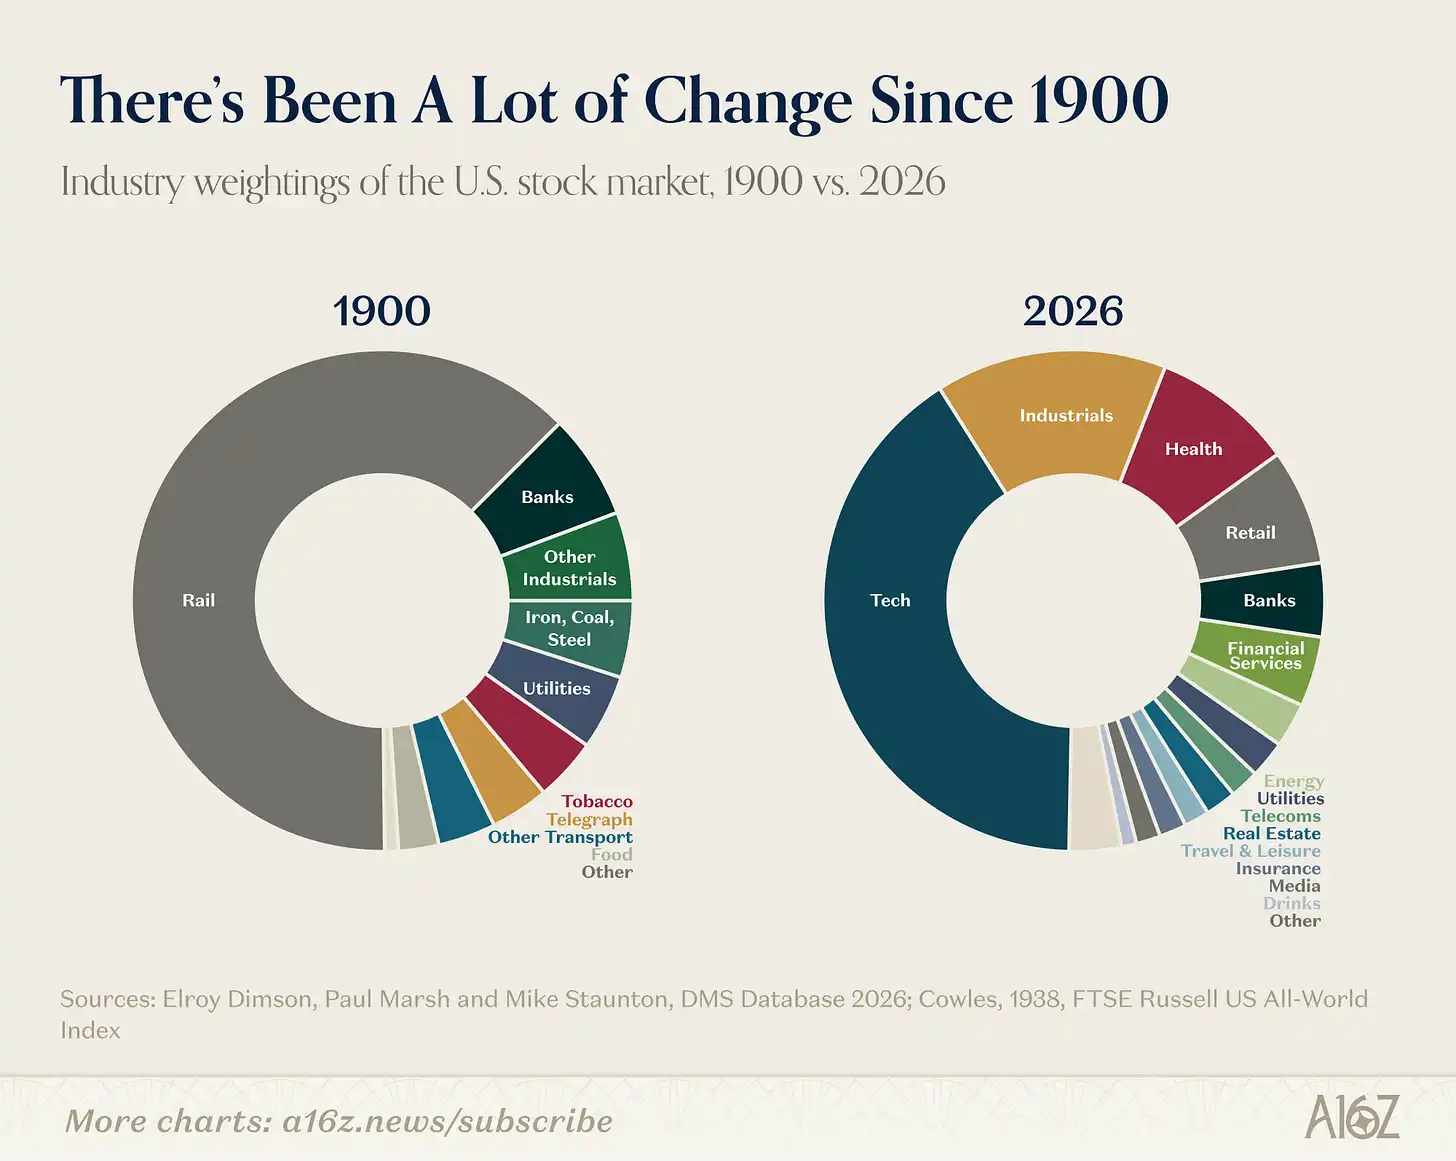
Caption: U.S. stock market sector composition in 1900 vs. today
In 1900, the U.S. economy was essentially made up of textiles, steel, coal, tobacco, along with the railroads that transported them and the banks that financed them. Today, these industries combined make up only a small fraction.
So the more interesting question is not whether the shift of a certain platform is a bubble, but what new economy this technological leap will unlock.
Railroads are an incredible general-purpose technology. One dramatic (but unexpected) change they spurred was the birth of the modern corporation. Before railroads, a business was typically small enough to fit in one person’s head. But railroads had too many crews, too many stations, and too many simultaneous decisions.
In 1855, the director of the New York and Erie Railroad drew what is considered the first modern organizational chart: a hierarchical tree of reporting relationships designed to address the increasingly complex scheduling challenges of the railroad. In many ways, middle management, multi-divisional structures, the professional managerial class, and the MBA degree all originated from the organizational problems created by the railroad industry.
Railroads changed not only what the United States produced, but the very nature of the "firm" itself. Railroads gave rise to middle management—the "visible hand" that Alfred Chandler described.「看得见的手」
What's interesting about AI is that, unlike railways, AI may once again rewrite the dominant organizational template established by railways over a century ago.
Last month, Jack Dorsey and Block’s leadership published an article making exactly this point: the value of AI in business isn’t about giving everyone a copilot, but about replacing middle management functions—absorbing and routing information, maintaining alignment, pre-calculating decisions. These coordination tasks traditionally handled by managers can be delegated to technology in an AI-driven company, allowing people to return to the edges and focus their judgment on customer interactions and human connections.
According to him, a corporate management model that has existed for 170 years will be entrusted to technology, creating an entirely new organizational form. This sounds like no small matter.
Whether Dorsey is right—and what new types of enterprises will ultimately emerge—remains an open question. But these impacts are far more significant than whether tech stocks will pull back from their highs this quarter.
Stablecoin trading volume shifts from transfers to payments
After stripping away the mechanical operations related to trading, fund management, and exchange activities—which account for the majority of stablecoin transactions—actual peer-to-peer payment transactions between different parties last year are estimated to have ranged between $350 billion and $550 billion.
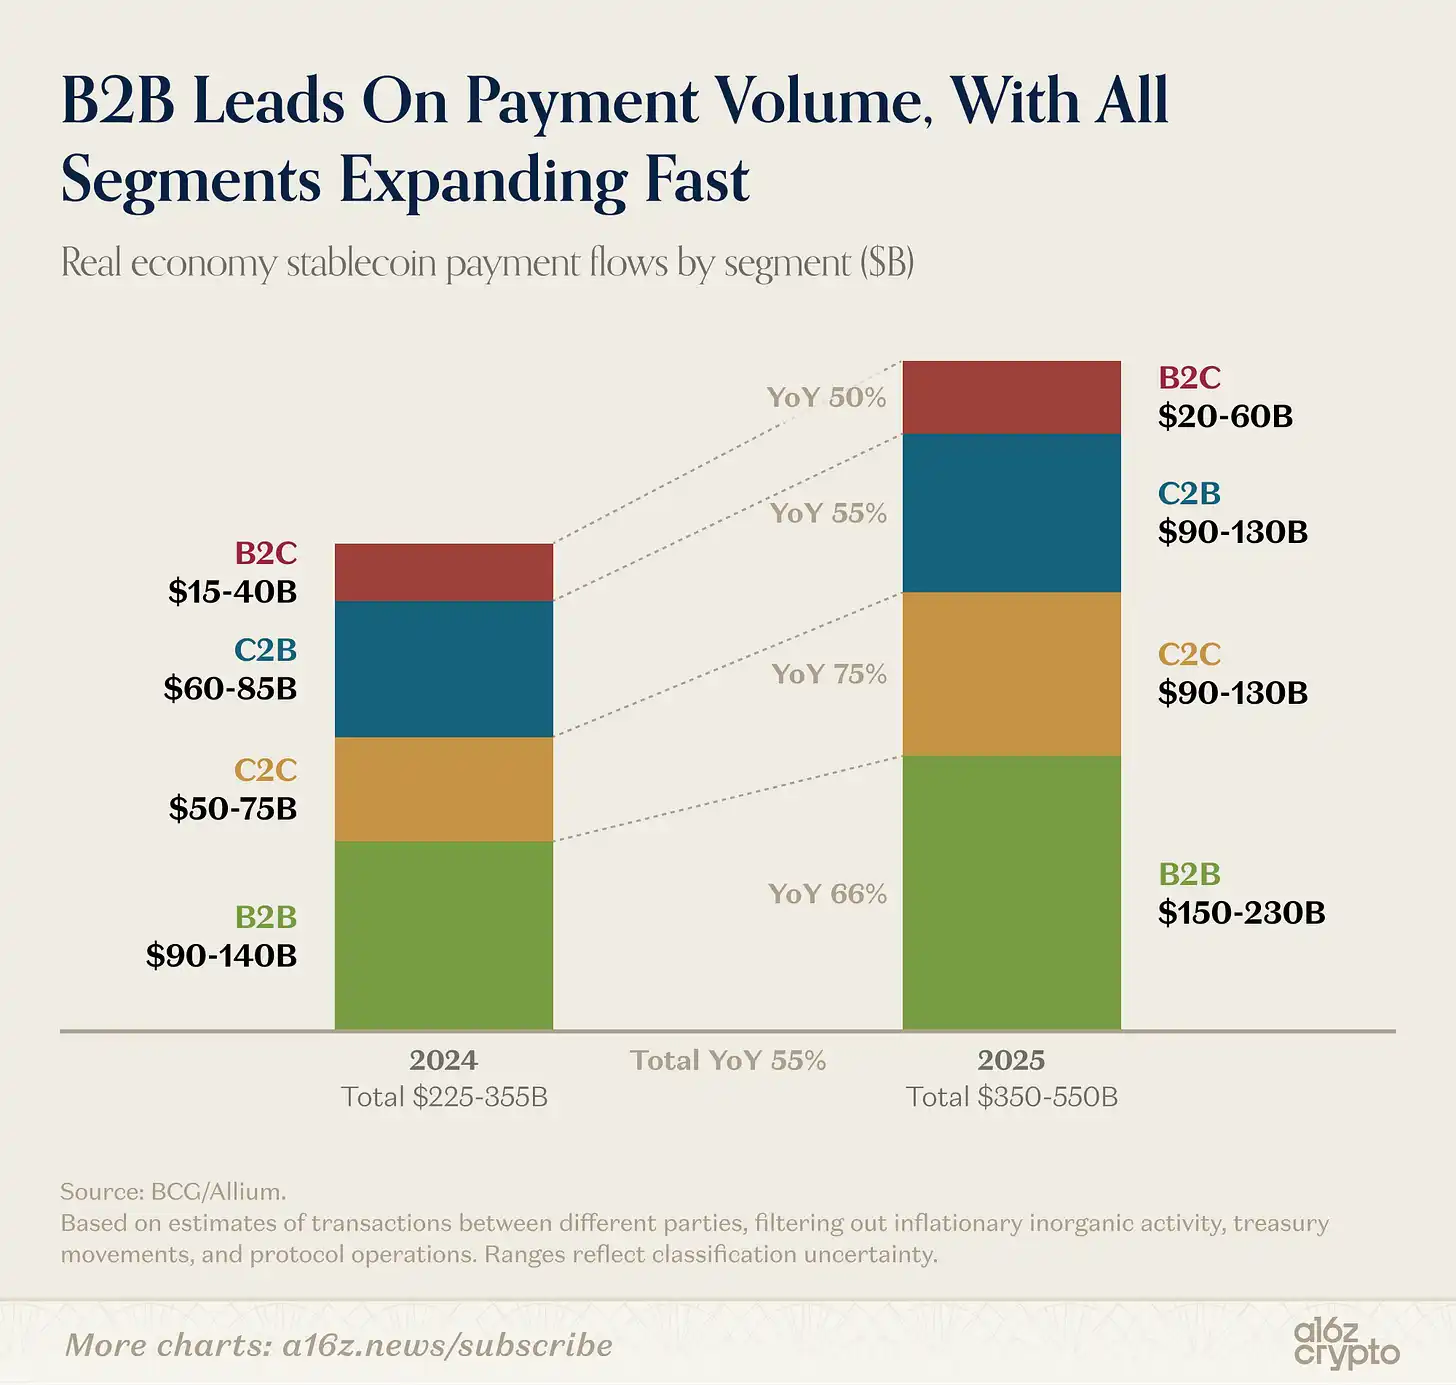
Caption: Stablecoin payments broken down by type (B2B, B2C, C2B)
B2B transactions make up the majority of stablecoin payments (which is not surprising given the scale), but B2C and C2B are also growing.
In short, stablecoins are increasingly being integrated into everyday commercial activities — part of a broader trend discussed in detail by a16z crypto in this article.
The next decade of journalism
Americans' trust in the mass media has recently hit a new low, one of the most dramatic slow-motion collapses in modern polling history.
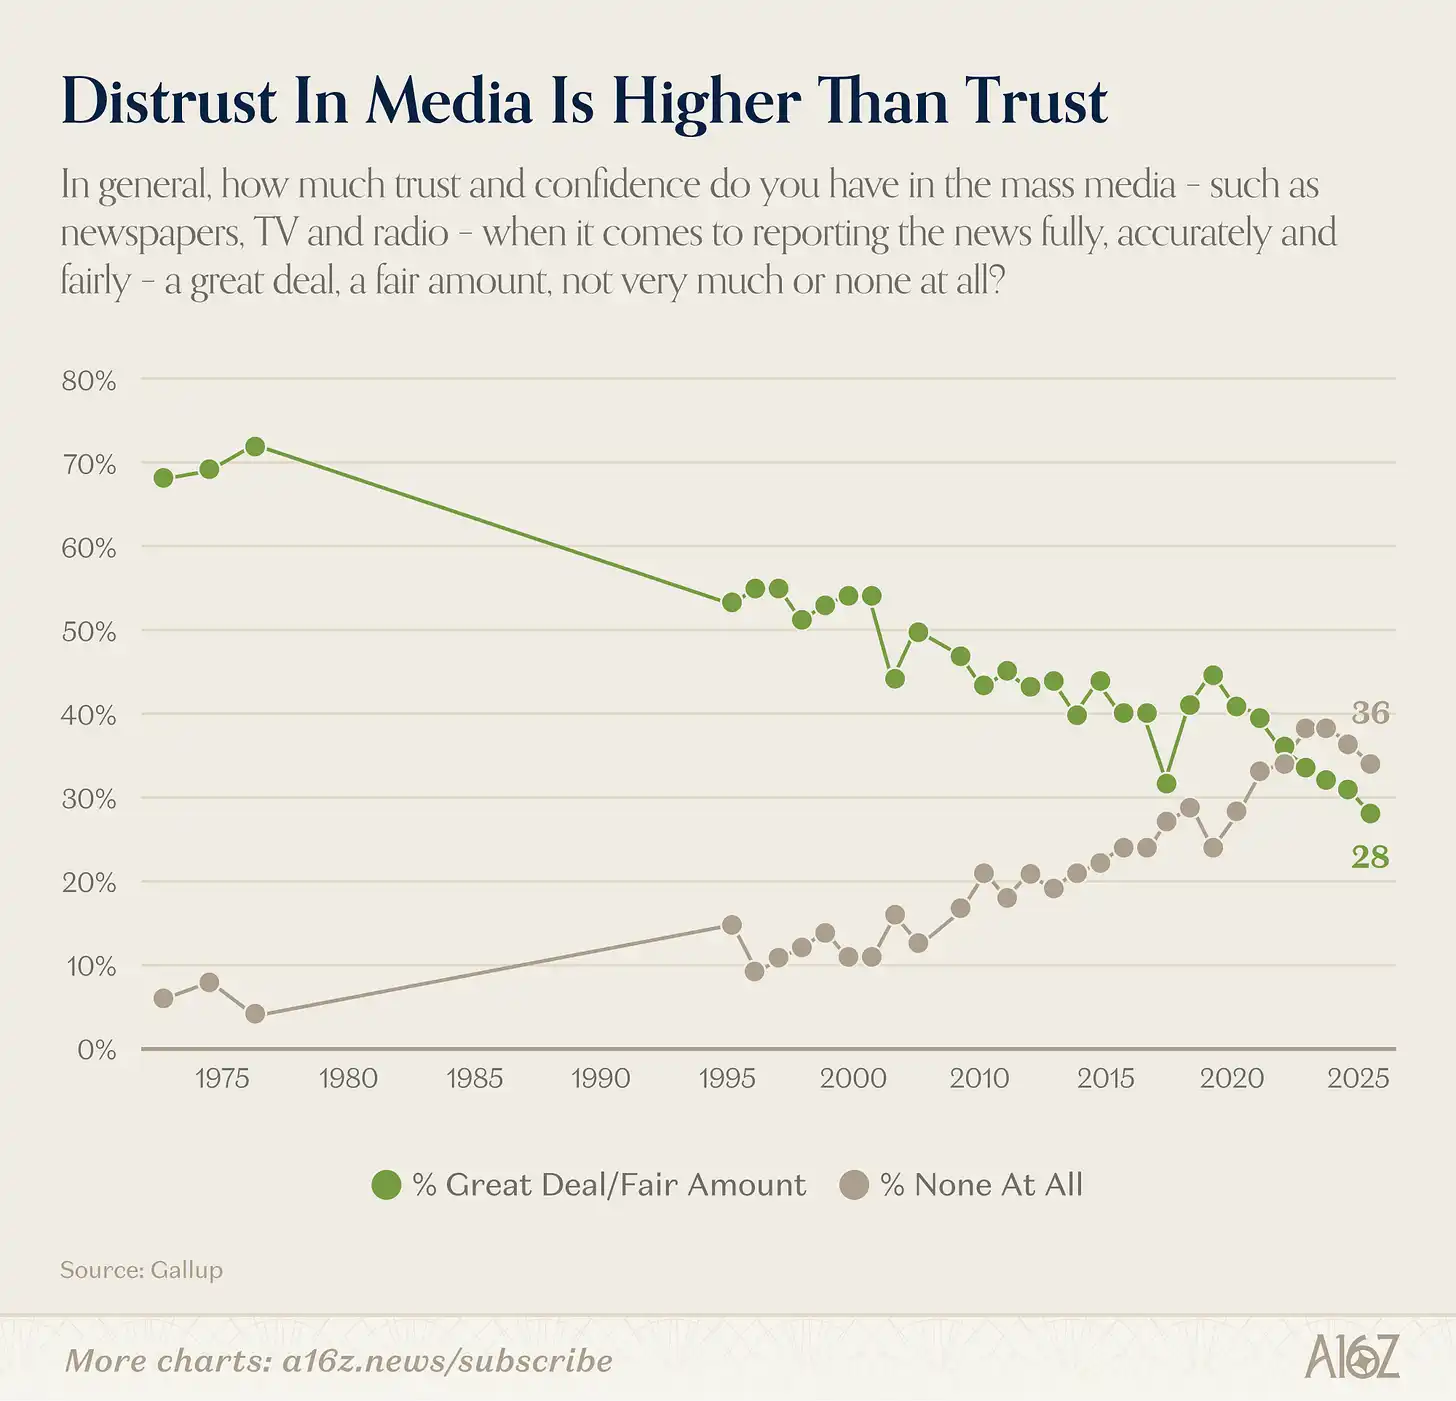
Caption: Changes in Americans' trust in mainstream media (1975–2025)
In 2025, only 28% of Americans expressed “a great deal” or “quite a lot” of trust in mainstream media (newspapers, television, radio). In 1975, that number was 72%.
But overall trust levels don't tell the whole story.
The real story lies in the generational divide, and the gap is enormous:
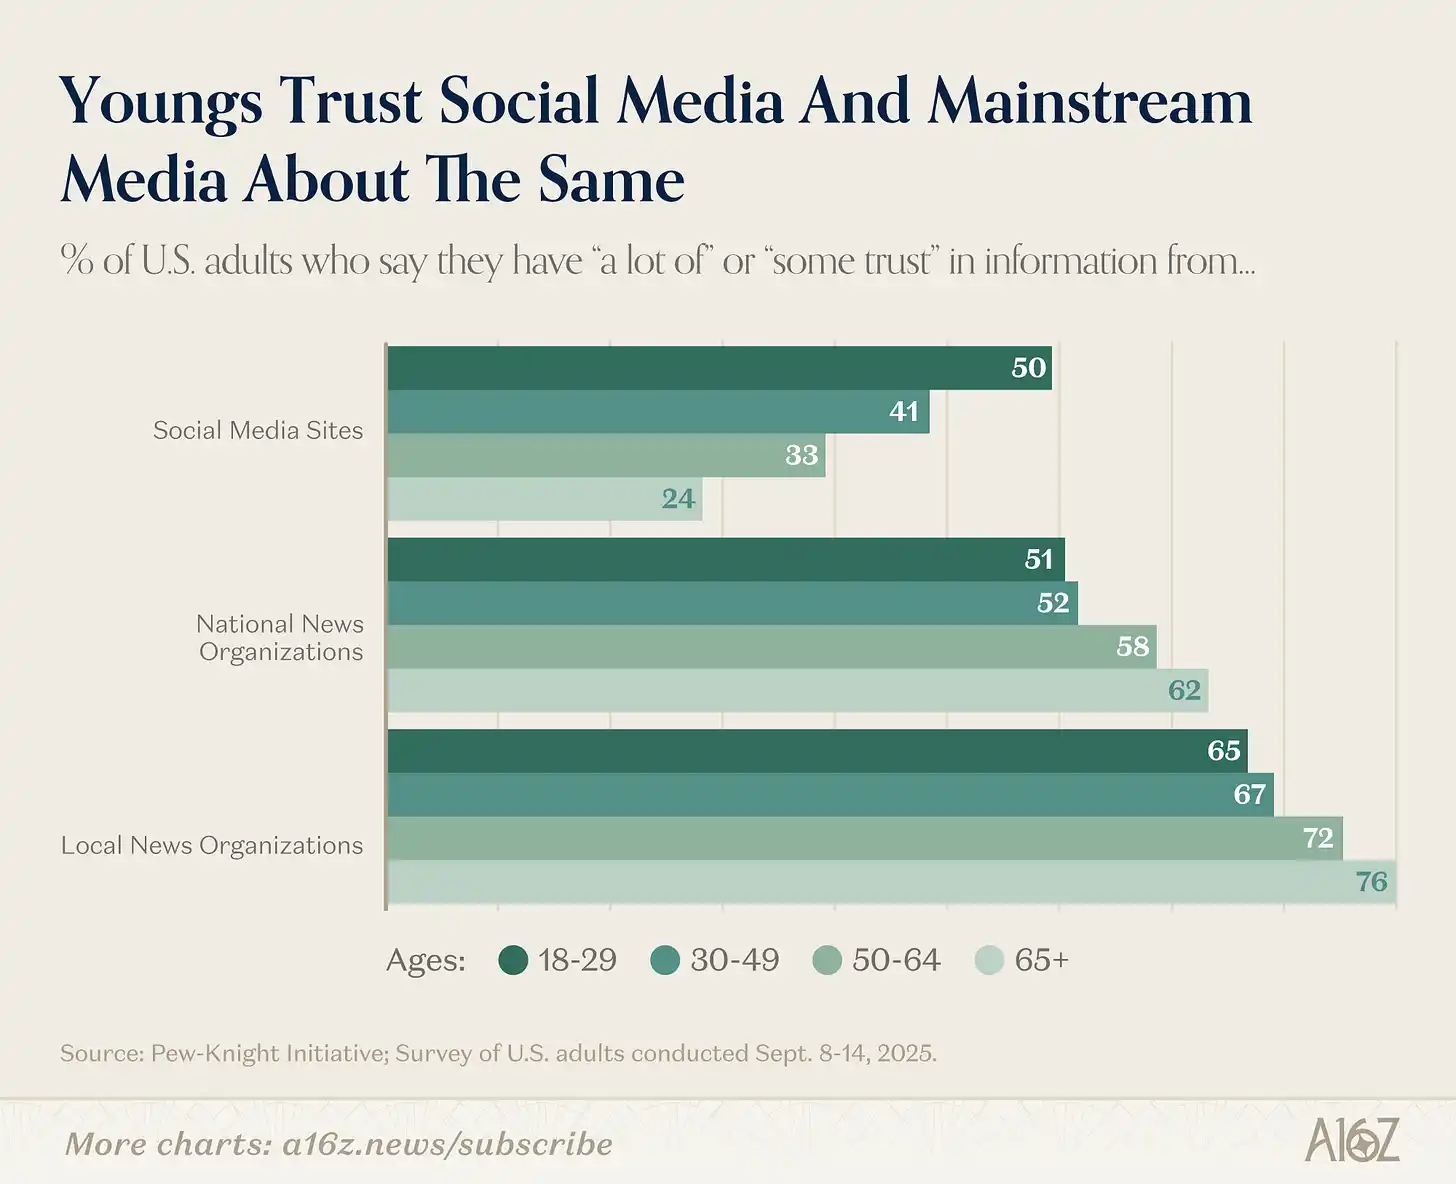
Caption: Comparison of trust levels in traditional media versus social media across different age groups
The younger you are, the less you trust traditional media and the more you trust social media. The opposite is also true—the older you are, the more you trust traditional media and the less you trust social media.
Beyond the trust gap, there is a consumption gap:
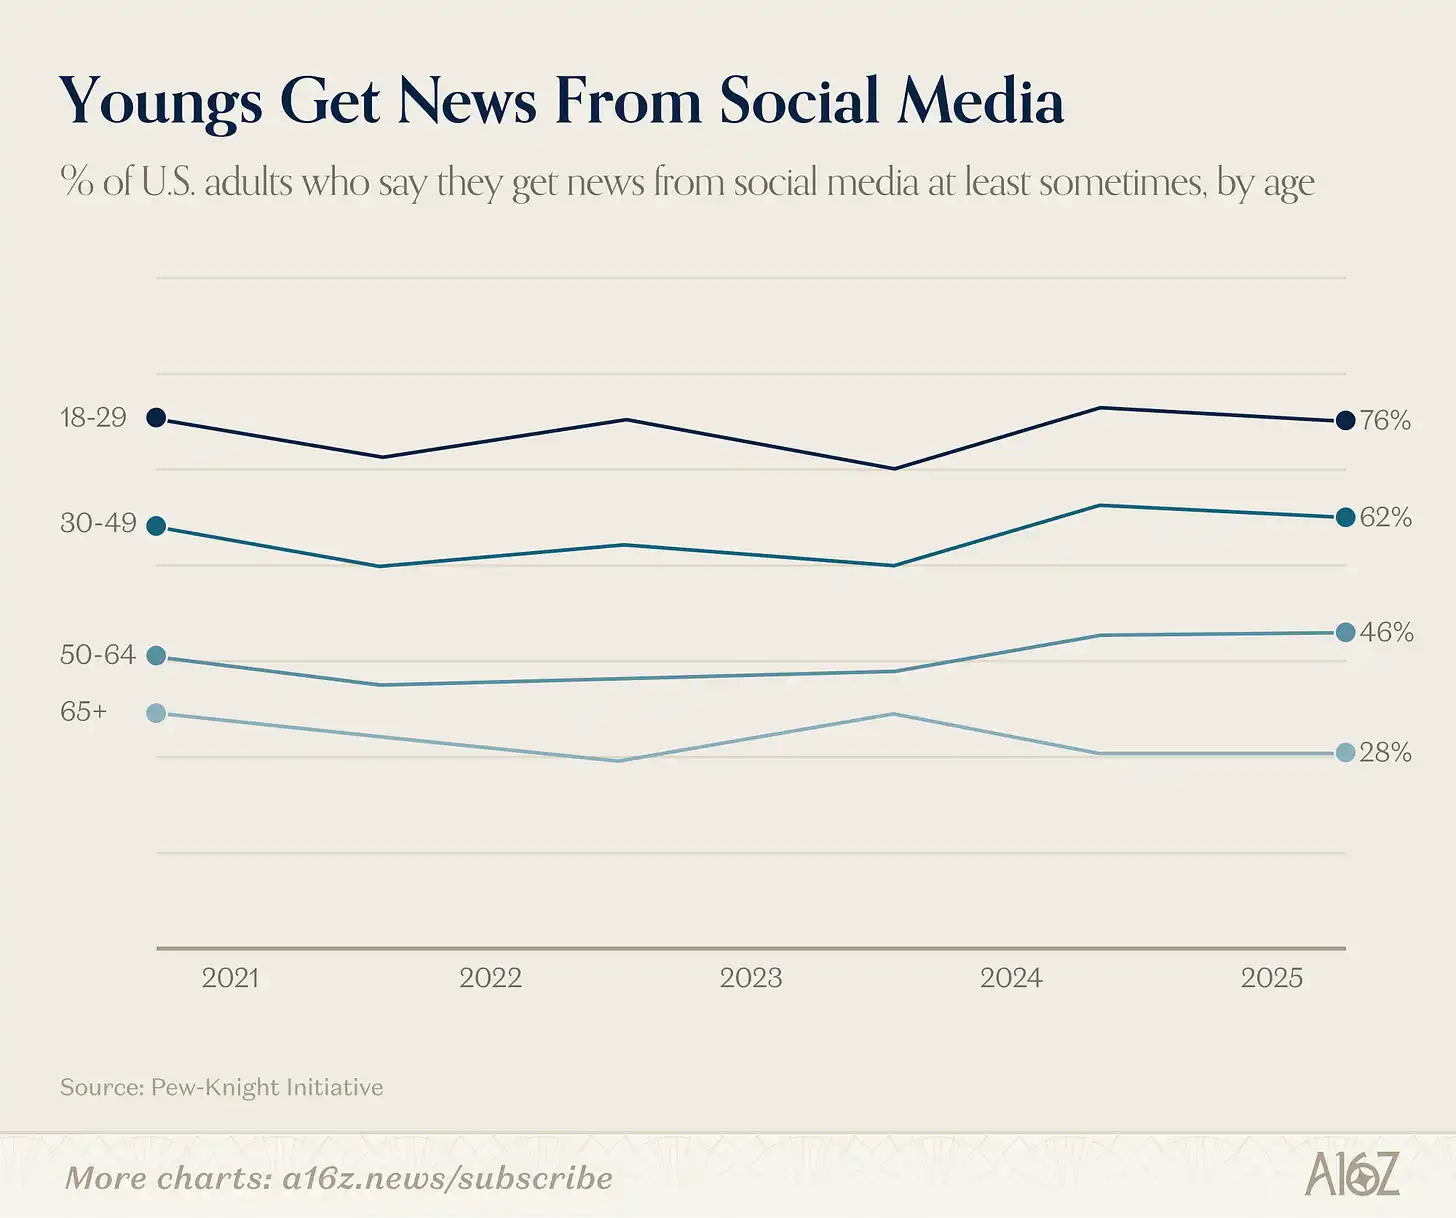
Caption: Percentage of people in different age groups who get news through social media
76% of adults under 30 get news from social media at least occasionally, compared to only 28% of those aged 65 and older (slightly lower than five years ago).
Trust in mainstream media has indeed declined from its peak, but a large part of this story is a shift in media habits among younger generations. Compared to their elders, younger people have much lower trust in mainstream media and are heavy users of social media alternatives.
Returning to the original observation: The 72% peak in media trust in 1975 is often nostalgically remembered as journalism’s golden age. But the same fact is that in the early 1970s, only a few television networks and newspapers monopolized information supply, with almost no competition.
So it’s reasonable to ask: how much of that "peak" trust came from quality journalism, and how much from having no other options? Of course, the two aren’t mutually exclusive—late 1960s and early 1970s may have had both good news and an captive audience. But it’s hard not to notice that the generation with the lowest trust in mainstream media grew up in an environment with the most choices.
This is precisely the argument Martin Gurri makes in The Revolt of the Public: the collapse of information monopolies across various domains—media, government, professional authority—has exposed authorities that were never truly earned. The public has seen behind the curtain, and trust has declined.
Gurri also said that the public is good at tearing down old things but not good at building new ones. He may be right. But at least, the barrier to funding alternatives in new media has never been lower than it is today. Whether they can rebuild trust in news will be the defining story of the next decade.
Goodbye, productivity boost
Sales of Zyn (nicotine pouches) have entered uncharted territory: year-over-year growth turned negative for the first time.
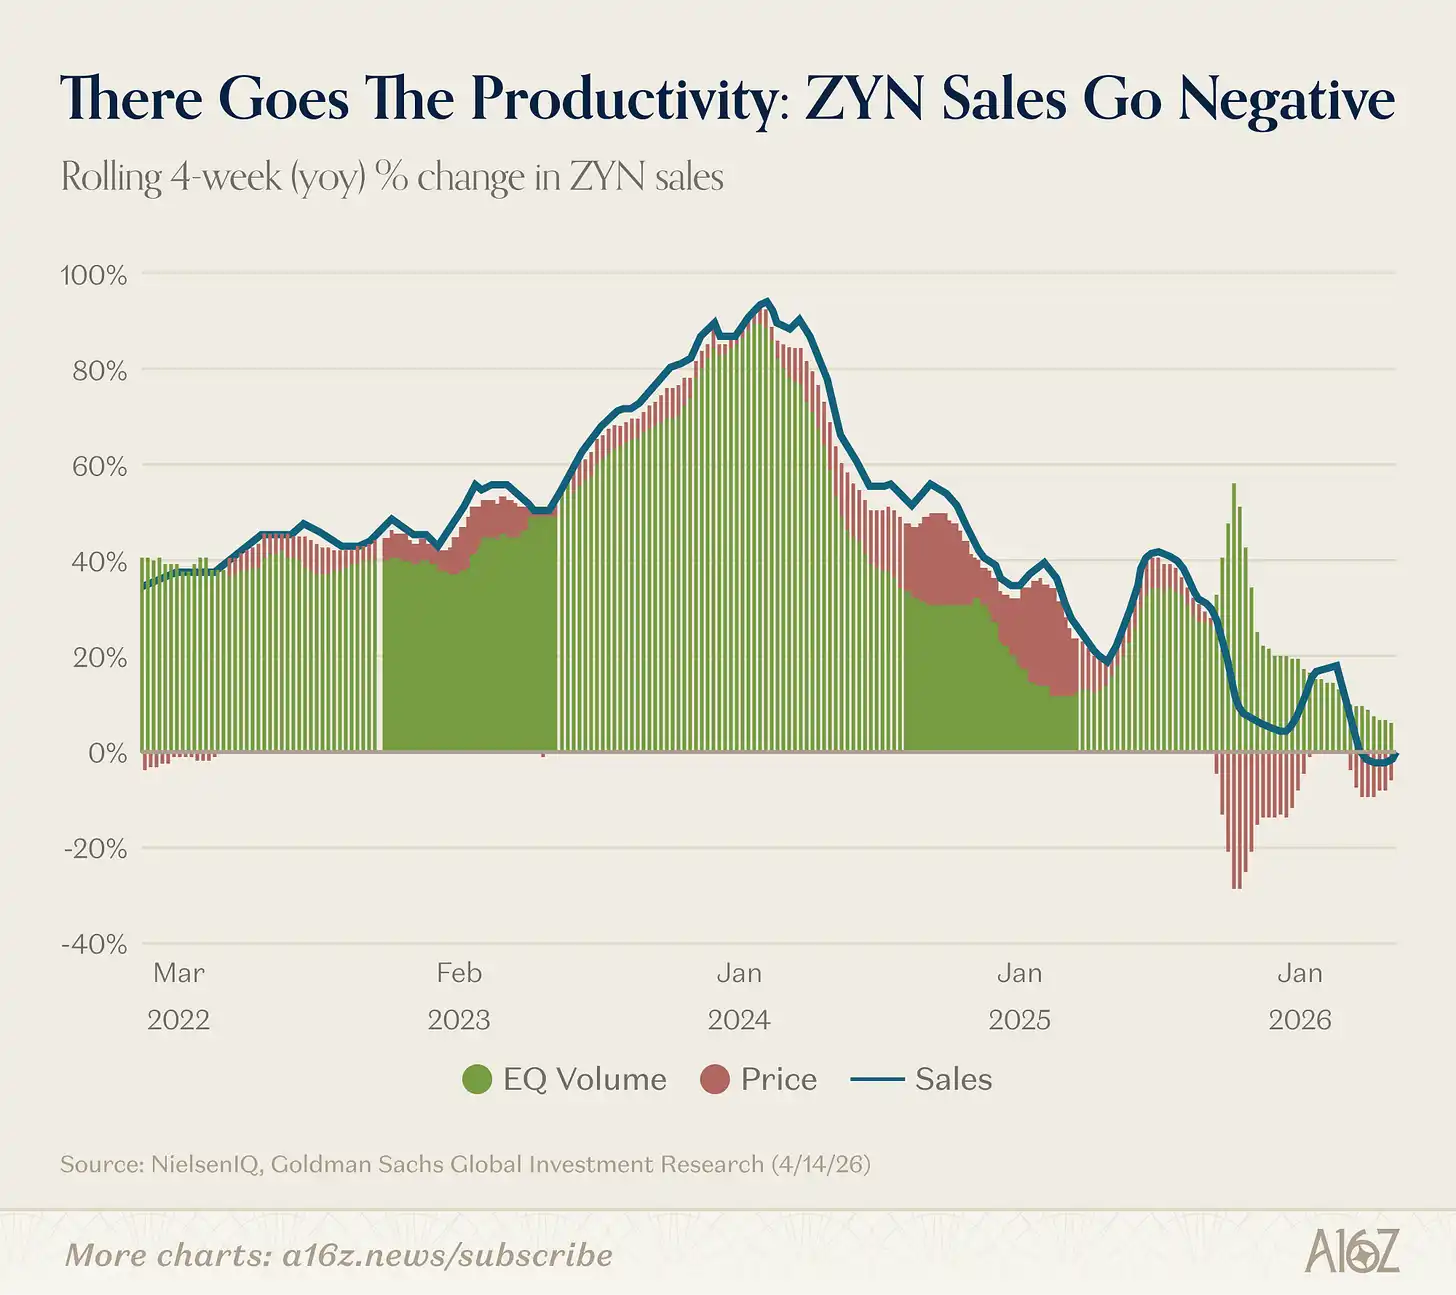
Caption: Zyn sales year-over-year growth rate (4-week rolling), turned negative for the first time
On a 4-week rolling basis, Zyn's year-over-year sales growth rate has turned negative for the first time ever, albeit by a small margin.
In fact, based on sales volume, Zyn is still growing. However, due to recent promotional activities, the total sales amount has slightly decreased.
Productivity bonus intact (laughing).
Another interesting detail: Zyn no longer holds more than half of the nicotine pouch market:
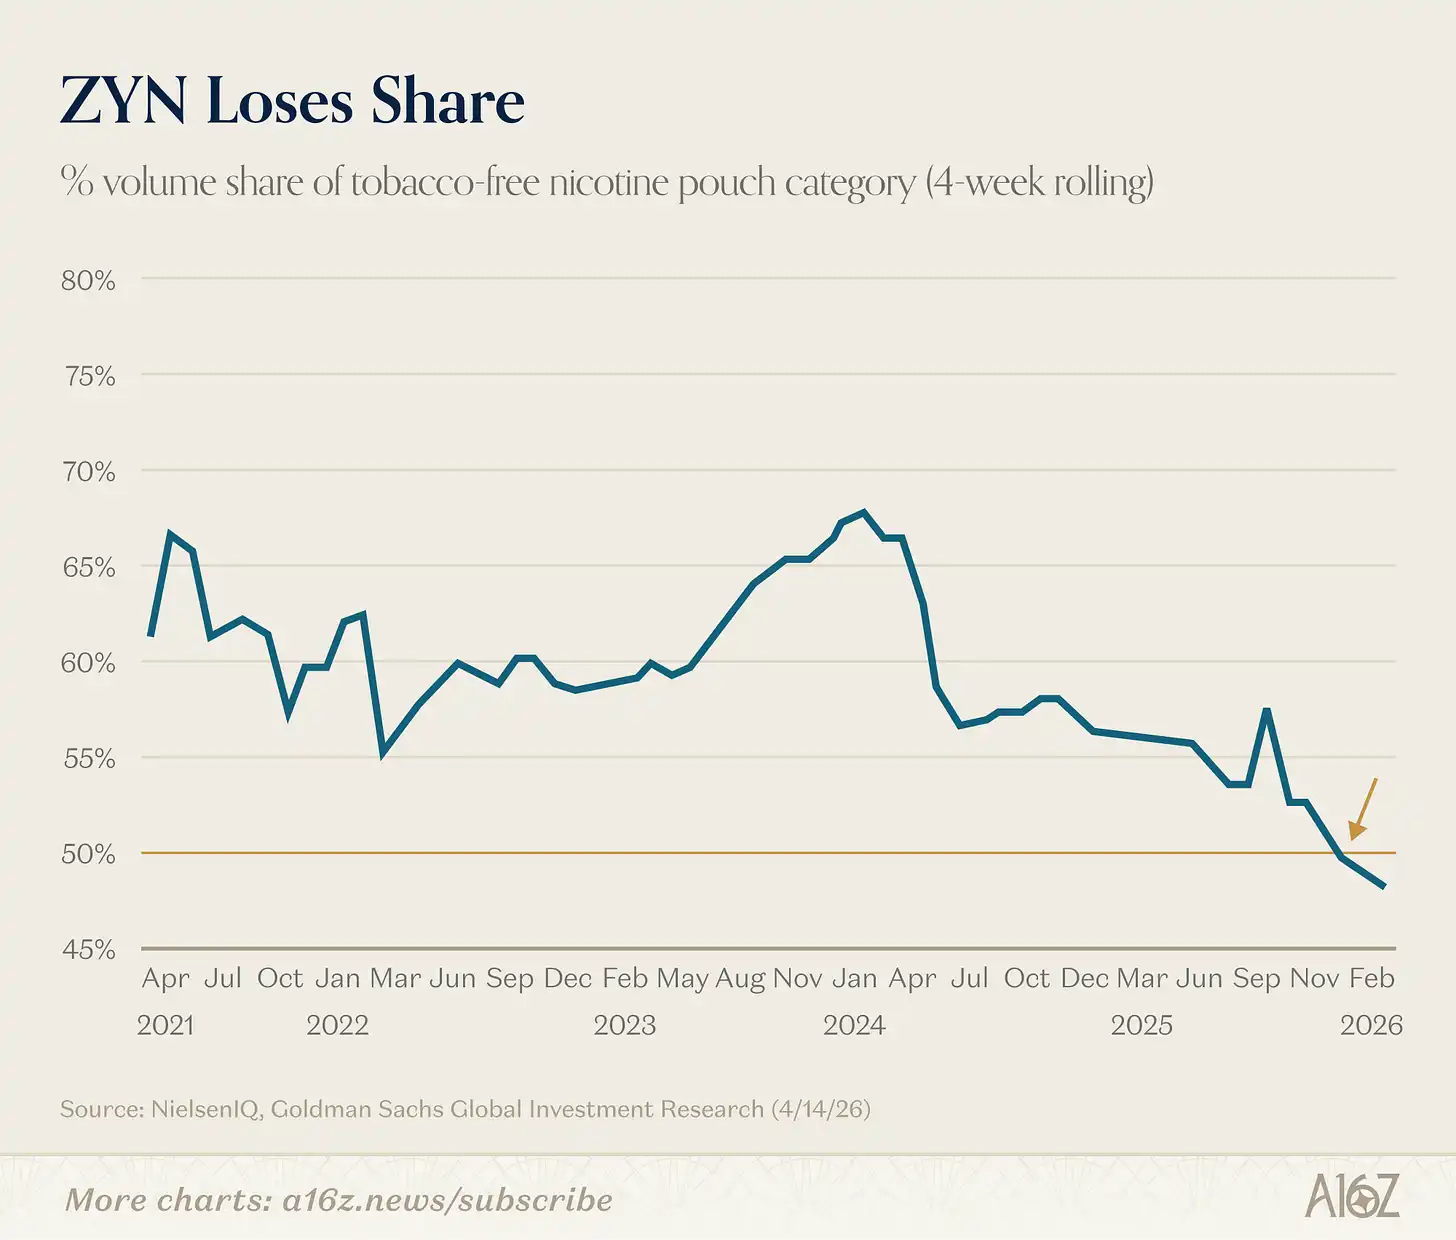
Caption: Zyn's market share changes in the nicotine pouch market
Zyn's market share fell below 50% at the end of last year.
[^1]: Yes, we know that stock market capitalization and GDP compare stock versus flow, but the chart still looks pretty good.