


Author: Claude, Deep潮 TechFlow
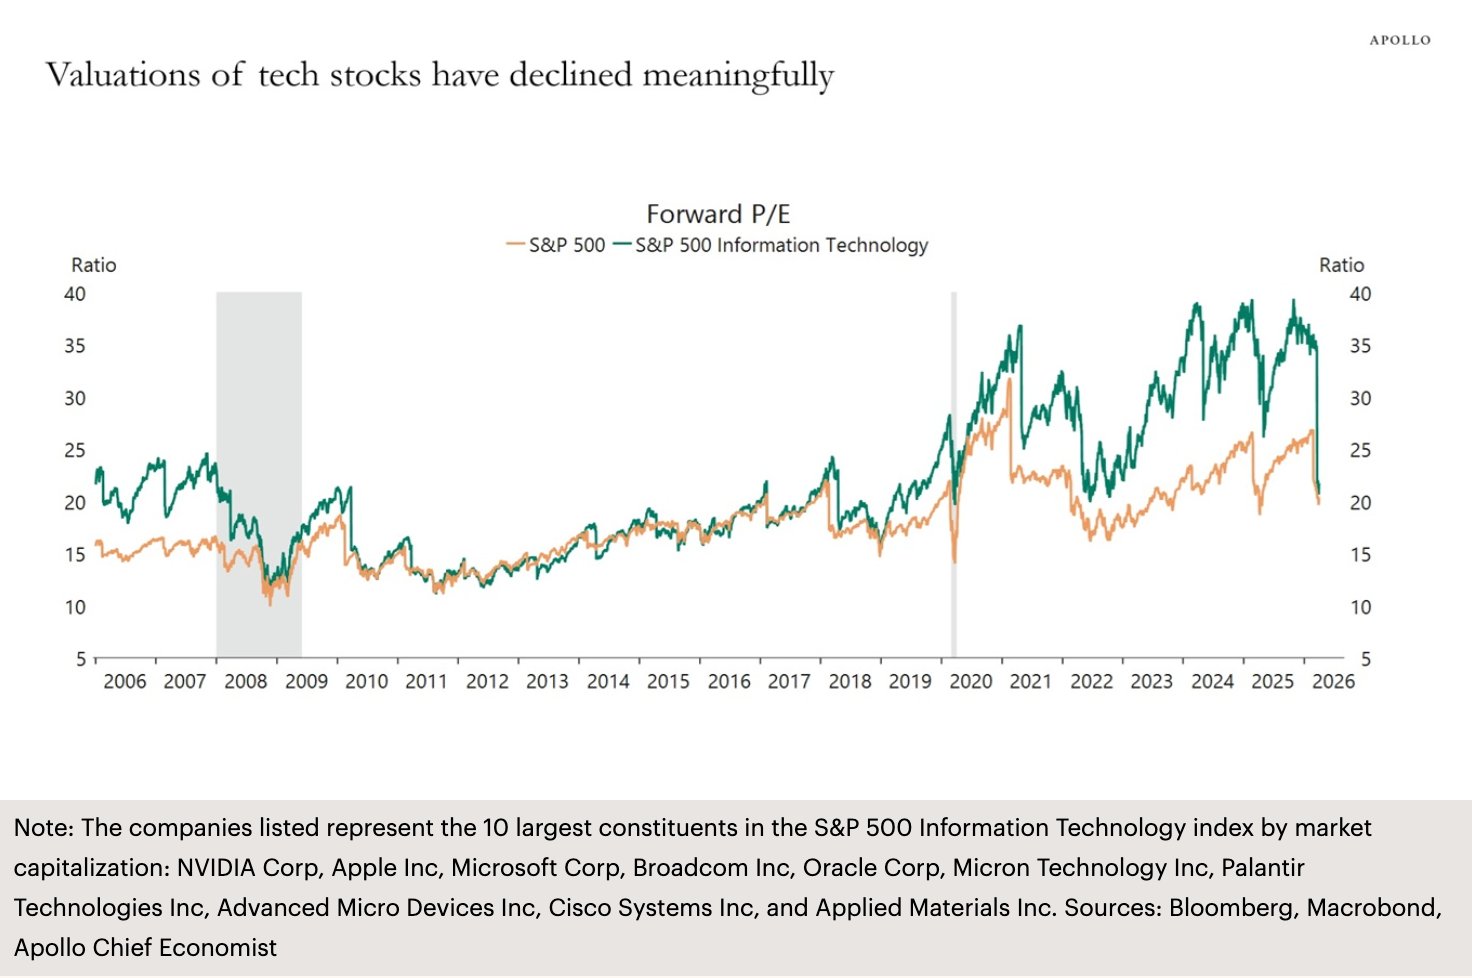
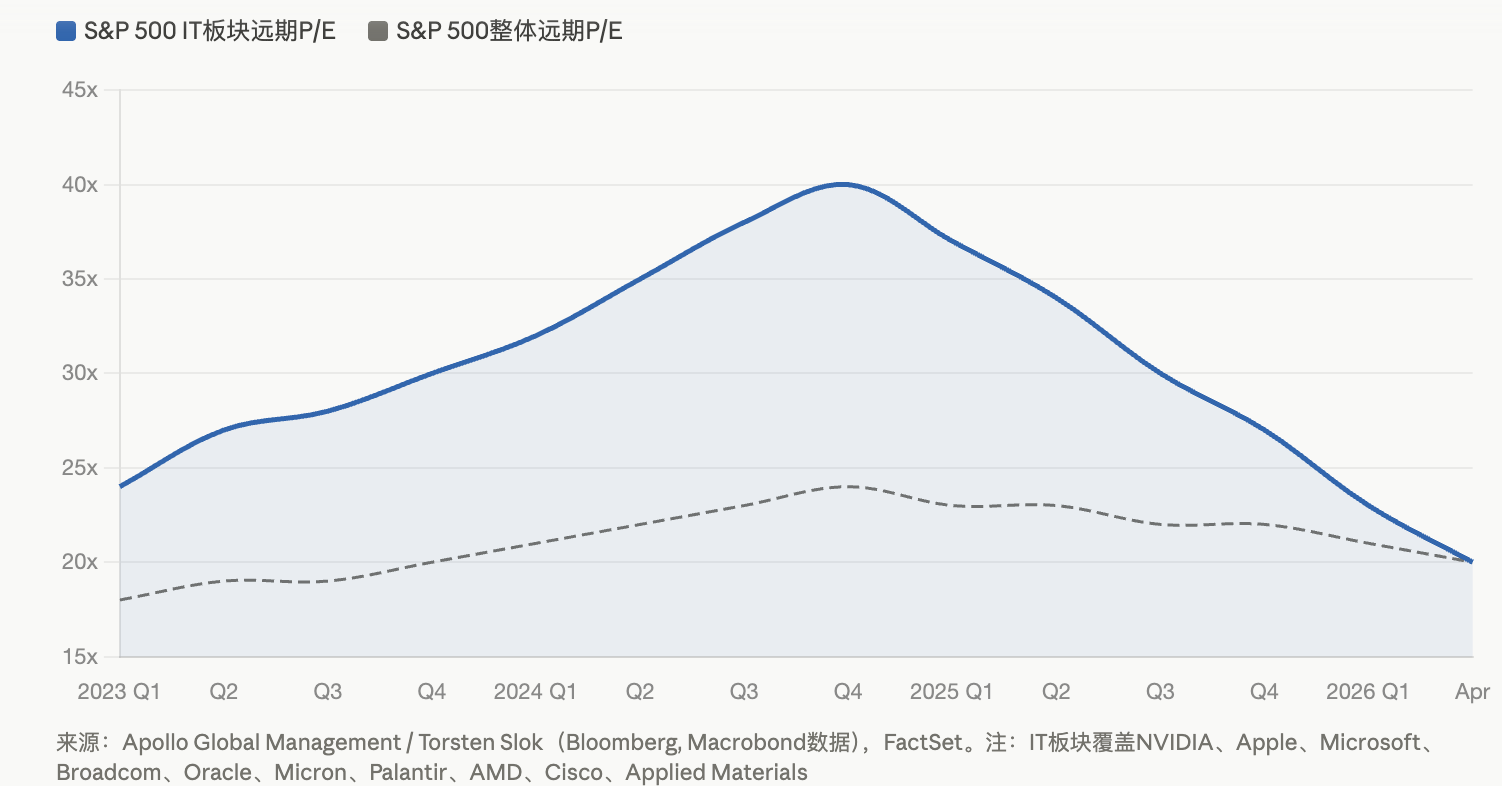
DeepOcean Overview: According to the latest chart from Torsten Slok, Chief Economist at Apollo Global Management, the forward P/E ratio of the S&P 500 Information Technology sector has declined from a peak of approximately 40 during the AI boom to around 20, returning to levels seen before the AI surge. Triple pressures—sector rotation triggered by Middle East conflicts, uncertain returns on AI capital expenditures, and slowing profit growth—are converging, causing tech giants to undergo their most painful valuation repricing since 2022.
The valuation bubble in the S&P 500 Information Technology sector is being rapidly squeezed.
According to Apollo Global Management’s Daily Spark report released on April 11, the firm’s partner and chief economist, Torsten Slok, used a chart to illustrate the current state of technology stocks: the forward P/E ratio of the S&P 500 Information Technology sector has compressed from a peak of around 40 during the AI boom to approximately 20, returning to valuation levels seen before the AI rally began.
This chart covers the ten largest components by market capitalization in the index: NVIDIA, Apple, Microsoft, Broadcom, Oracle, Micron, Palantir, AMD, Cisco, and Applied Materials. In other words, the core group of winners of the AI era collectively reversed their valuation premiums accumulated over the past two years.
Three pressures converge as tech giants face a valuation repricing.
The valuation compression is not driven by a single factor, but rather the cumulative effect of multiple negative influences.
The Middle East conflict is the most direct catalyst. Since the outbreak of war in Iran, the energy sector surged over 34% in the first quarter, with ExxonMobil rising nearly 42% year-to-date. Large-scale capital has flowed out of technology stocks and into energy and defensive sectors, making technology stocks the largest source of outflows. The S&P 500 formed a "death cross" (50-day moving average crossing below the 200-day moving average) at the end of March, and as of early April, the index struggled near 6,582 points—just under 100 points away from the 6,300 threshold for a correction.
The uncertain return on AI capital expenditures is the second source of pressure. According to FactSet data, the expected earnings growth rate for the S&P 500 in Q1 is 12.6%, with a forward P/E ratio of approximately 20.4x. Over the past two years, tech giants have made massive capital expenditures—Amazon plans to spend $200 billion by 2026, while Microsoft, Meta, and others have each planned investments in the hundreds of billions of dollars—yet AI-related revenues remain far below the scale of these investments. According to estimates cited in a CEIBS research report, to break even on approximately $400 billion in AI capital expenditures in 2025 alone, annual AI-related revenue would need to rise to $160 billion, whereas actual revenues at the time were only around $15 to $20 billion.
Slowing profit growth constitutes the third pressure. According to Bloomberg Intelligence, the seven major tech companies are expected to achieve a profit growth rate of approximately 18% in 2026, the lowest level since 2022, with the gap narrowing against the 13% expected growth rate of the other 493 companies in the S&P 500. In January, David Lefkowitz, UBS Global Wealth Management’s Head of U.S. Equities, stated that profit growth is becoming more widespread, and technology is no longer the sole driver.
NVIDIA up 21 times, Microsoft down 23%: Divergence among major tech stocks intensifies
Valuation compression is more pronounced at the individual stock level.
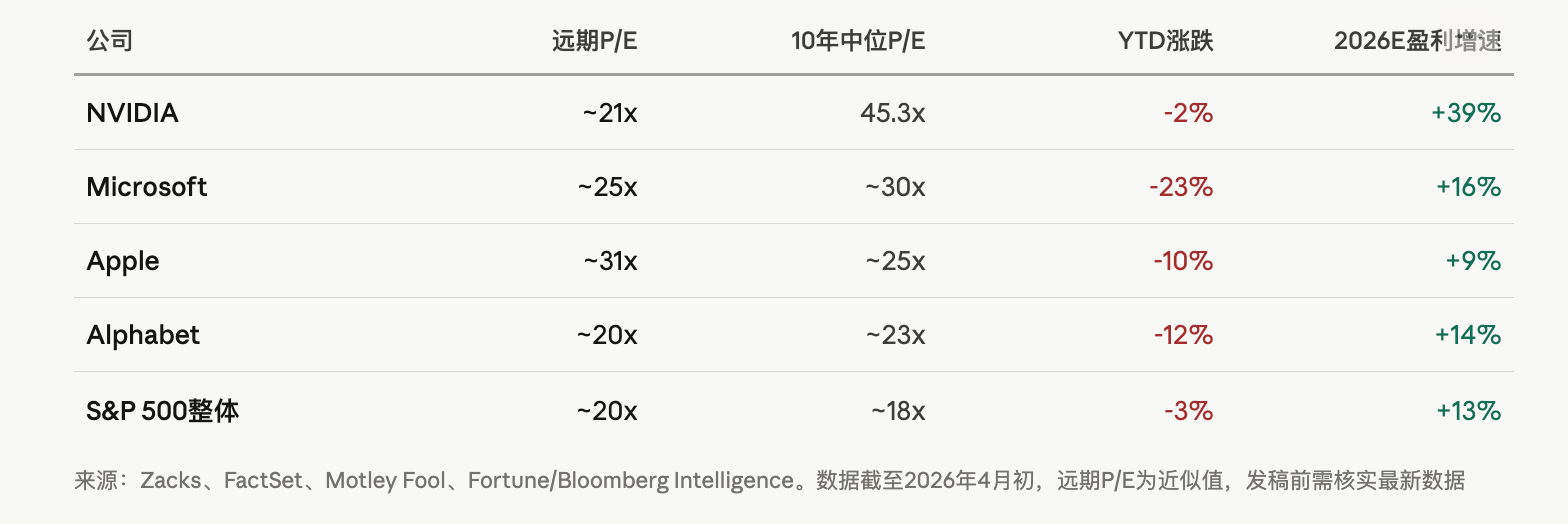
According to Zacks analysis, NVIDIA’s forward P/E ratio has declined to approximately 21.4x, significantly below its decade-long median of 45.3x, despite projected annualized earnings growth of 39.1% over the next three to five years. Microsoft has declined about 23% year-to-date, with its market capitalization falling below $3 trillion after surpassing $4 trillion in October last year. Apple has been relatively stable among the Magnificent Seven, partly due to its much lower AI capital expenditures compared to peers; it repurchased $24.7 billion in shares over one quarter, earning a premium for its capital discipline as markets penalize heavy spenders.
Insider activity may speak louder. According to Motley Fool, citing SEC Form 4 data, insiders at NVIDIA, Apple, Alphabet, Microsoft, and Amazon collectively sold approximately $16.1 billion in net shares over the two years ending April 2. Although most of these sales relate to tax-driven compensation processing, the absence of insider buying amid such a large net sell-off has unsettled the market.
The debate over the AI bubble is intensifying, but it differs fundamentally from the 2000 dot-com bubble.
Have tech stock valuations returned to pre-AI levels, signaling that the AI bubble has burst?
There are clear differences among institutions. BlackRock, in its technology sector report, noted that the forward P/E ratio of the S&P 500 Information Technology Index was approximately 30x in October 2025—although at a historical high, it remains far below the approximately 60x level seen at the peak of the dot-com bubble for the Nasdaq 100 Index. BlackRock emphasized that current valuations reflect genuine revenues, proven business models, and accelerating AI adoption, which are fundamentally different from the conditions in 2000.
Goldman Sachs' previous research report also noted that the implied long-term dividend growth rate embedded in current stock prices, while unusually high, remains below the extreme levels seen during the internet bubble and the 1960s "Nifty Fifty" era.
But warning signs are equally clear. According to the Globe and Mail, the S&P 500 entered its second-highest valuation level in 155 years at the start of the year, as measured by the Shiller P/E ratio. Historically, when the Shiller P/E ratio exceeded 40—during the dot-com bubble and in January 2022—the S&P 500 subsequently declined by 49% and 25%, respectively.
Zacks analysts offer a more pragmatic assessment: as stock prices decline while earnings expectations rise, valuation multiples are being compressed passively, improving the risk-reward profile for some individual stocks. NVIDIA is currently viewed as the stock with the best alignment between growth and valuation, while Microsoft is seen as having potential for a catch-up rebound.
For investors, the key question is not whether AI has value, but whether today’s massive capital expenditures can generate profit returns commensurate with valuations within a reasonable time frame. If 2026 marks the cyclical peak in capital spending by hyperscale customers, then even as the technology continues to evolve, the return period for investments in AI infrastructure may far exceed market patience.