


Key Insights
- SUI was up 10% in a day. The last two times the TD flashed a buy signal for SUI on the biweekly chart, the price rallied 388% and 617%. A new buy signal has now appeared.
- The 4-hour chart indicated that the price was nearing a crucial resistance zone, which, if breached, could pave the way for a surge towards $2 or higher.
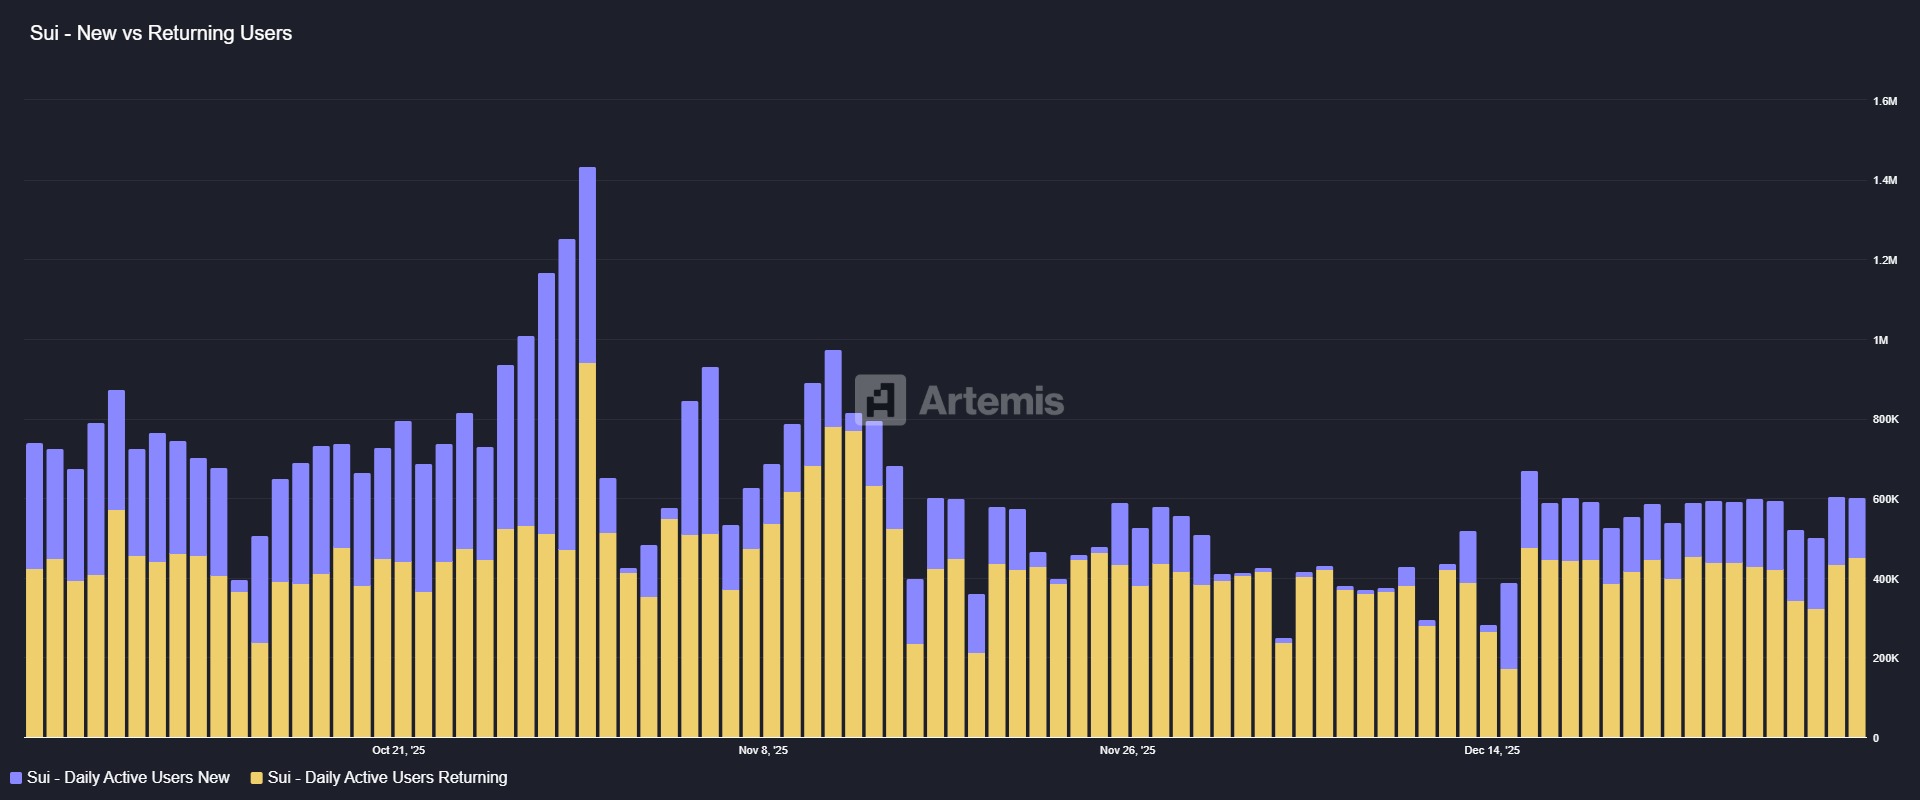
- Activities on the SUI blockchain were on the rise. Daily transactions surpassed 13 million, while new active users were half of returning active users.
The recent rebound in the crypto markets did not exclude Sui Network (SUI). The altcoin rose by more than 10% in 24 hours, with trading volume following a similar trail.
The altcoin is deemed the Solana killer, which is not far from the truth if it can keep up with SOL’s pace. The activities on the blockchain alongside its price structure resembled those of Solana. However, it was yet to hit the same heights.
That said, the SUI crypto price was forming a potential repetition of the previous rally.
Sui Price On The Verge Of Repeating History
SUI price was getting a lot of attention as its bi-weekly chart got a new TD Sequential buy signal. This pattern resembled those that came before big rallies.
In the past, the last two “9” buy signals caused prices to rise by 388% from early lows in 2024. Another 617% resulted in a new peak. This showed that the volatility of 2025 was higher than that of 2024.
The most recent signal came in around $1.42. Meanwhile, the chart showed a downward trend from the highs of 2025 to the lows of 2026. This pattern represented a correction that was similar across the sector.
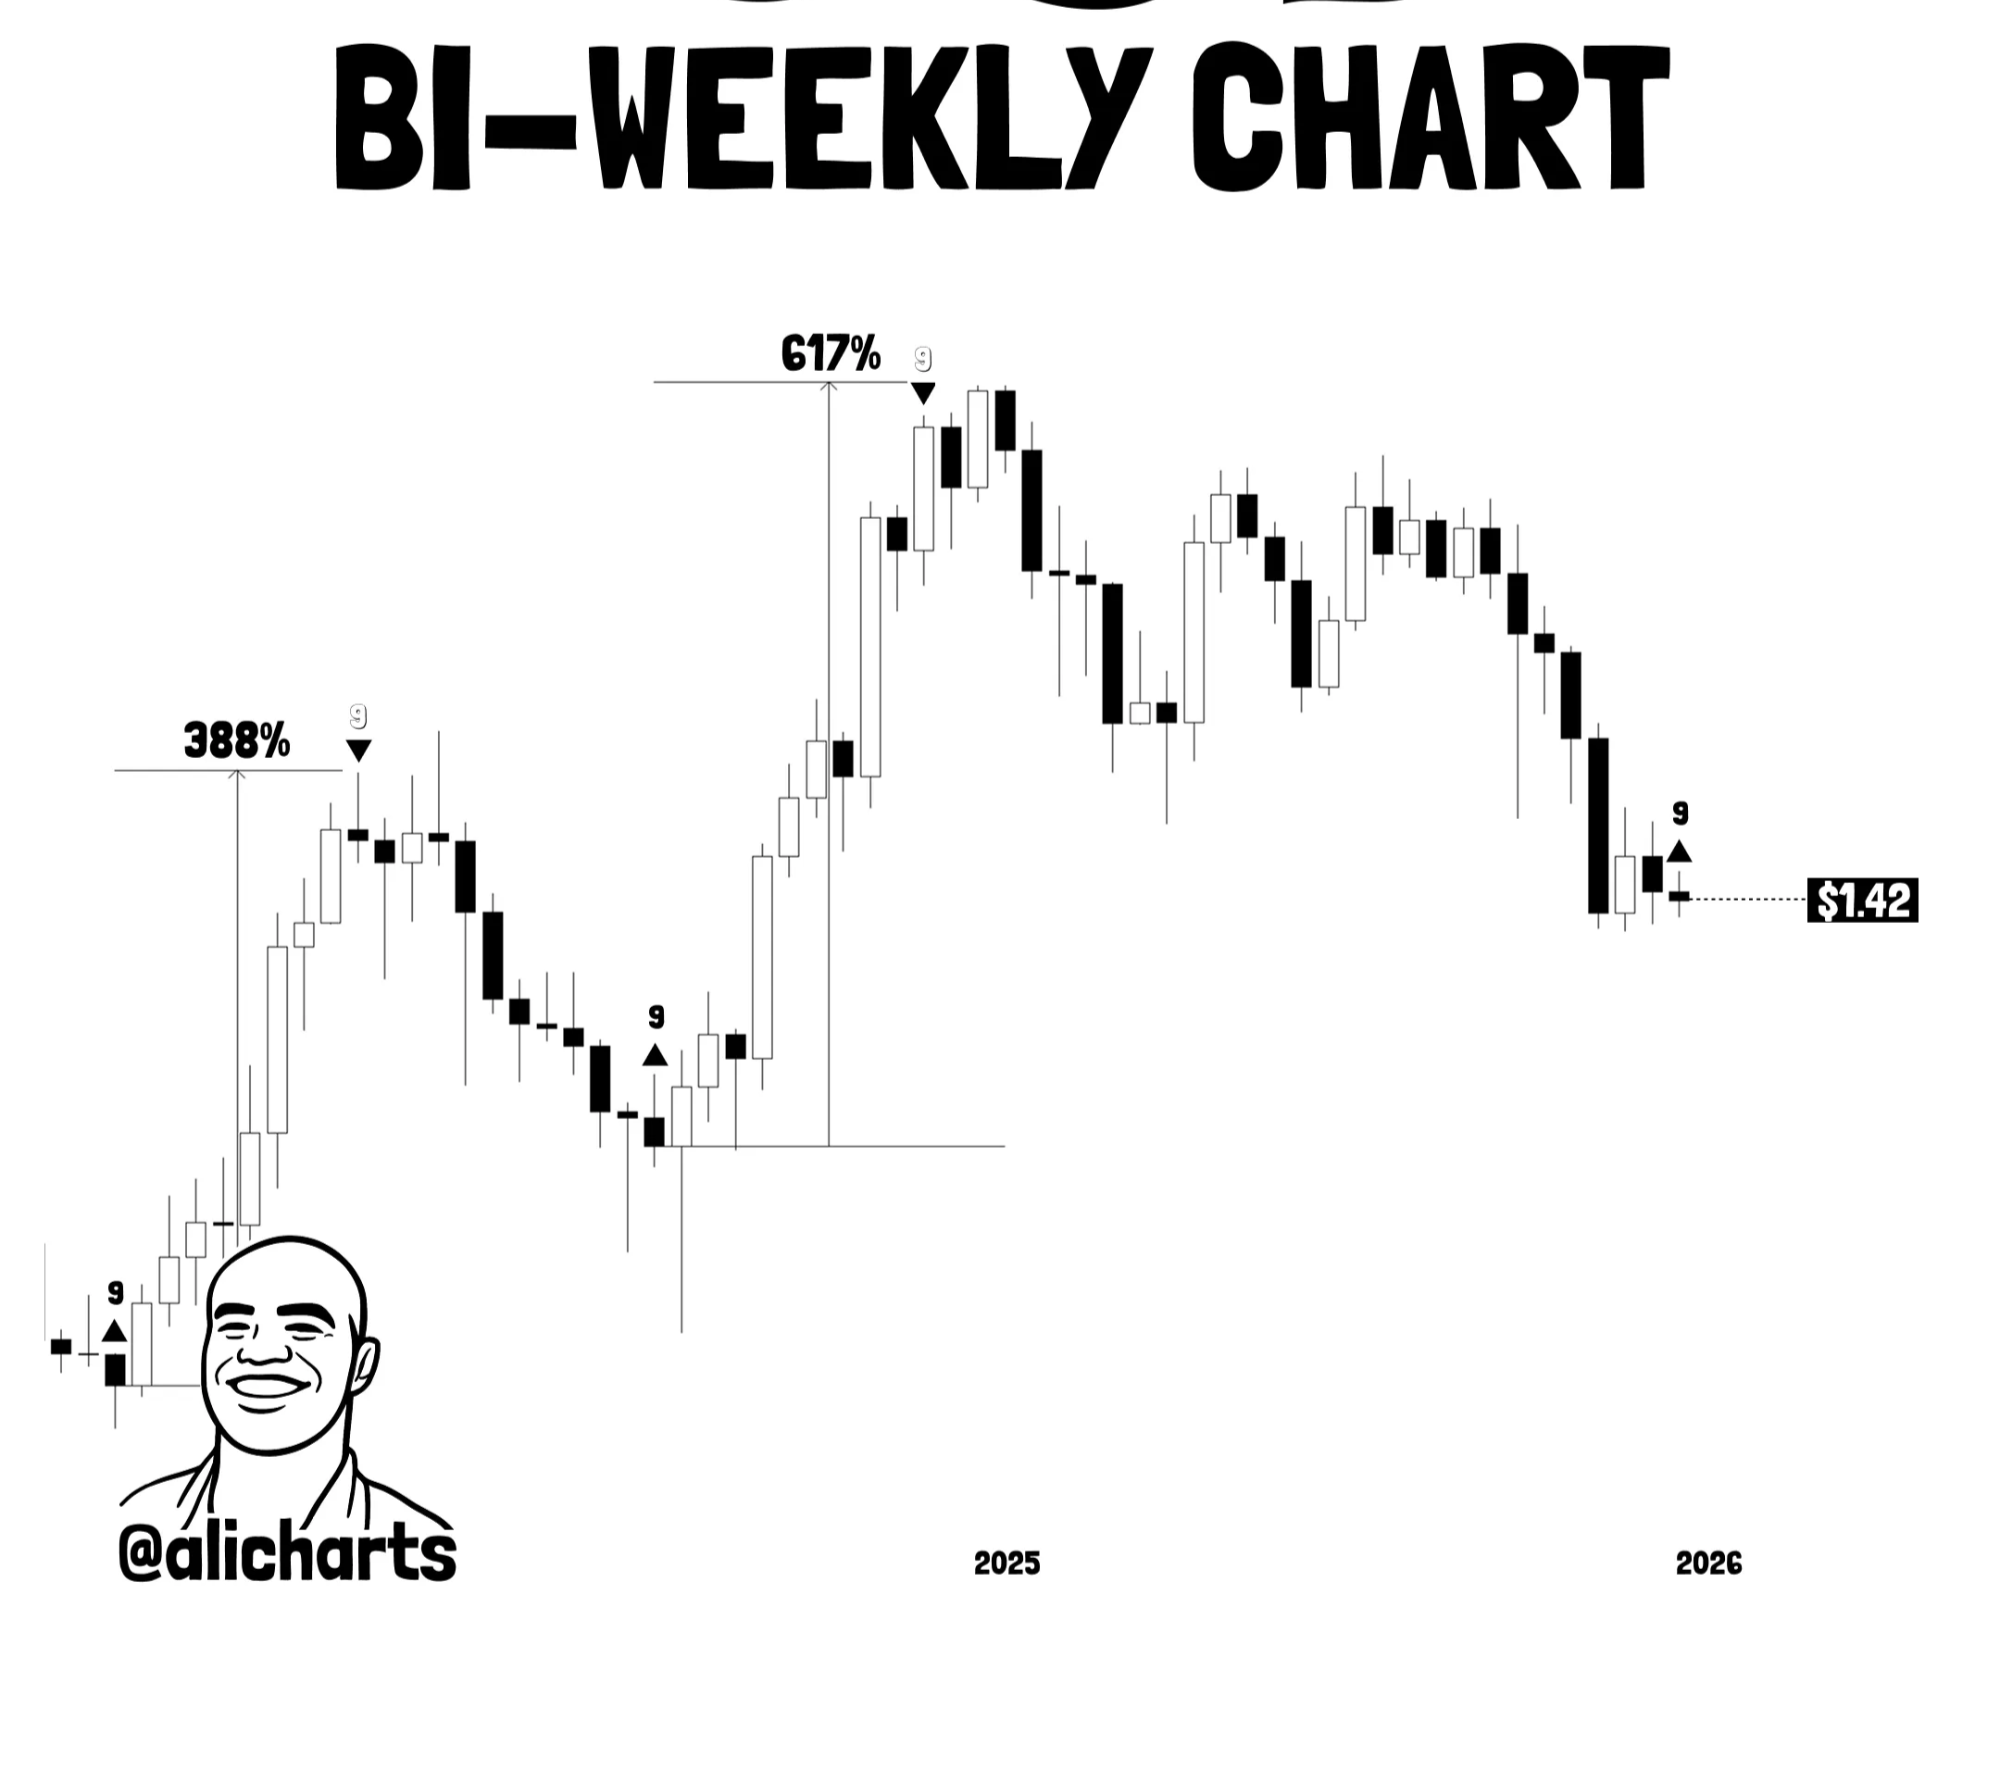
After the signal, the price went up, reaching about $1.70 by January 4, 2026, more than 20% in gains. This spike suggested that the momentum was there at first.
Ali Charts predicted that SUI could replicate previous rallies. This would push SUI past $7. However, some analysts pointed out the changing market conditions.
A 388%+ rally was possible because of technical similarities, but it was not certain. More factors are needed to confirm it.
Sui Crypto Price Action Analysis: Will SUI Break Out?
SUI Crypto rebounded sharply from the $1.32 support on the 4‑hour chart. Prices are now climbing toward the $1.73 resistance zone. This move happened after a long period of consolidation. It suggested that there was renewed interest in the upward direction.
The RSI was close to 78, which meant that the market was overbought. Furthermore, it suggested that the upward momentum had picked up but could cool off in the short term.
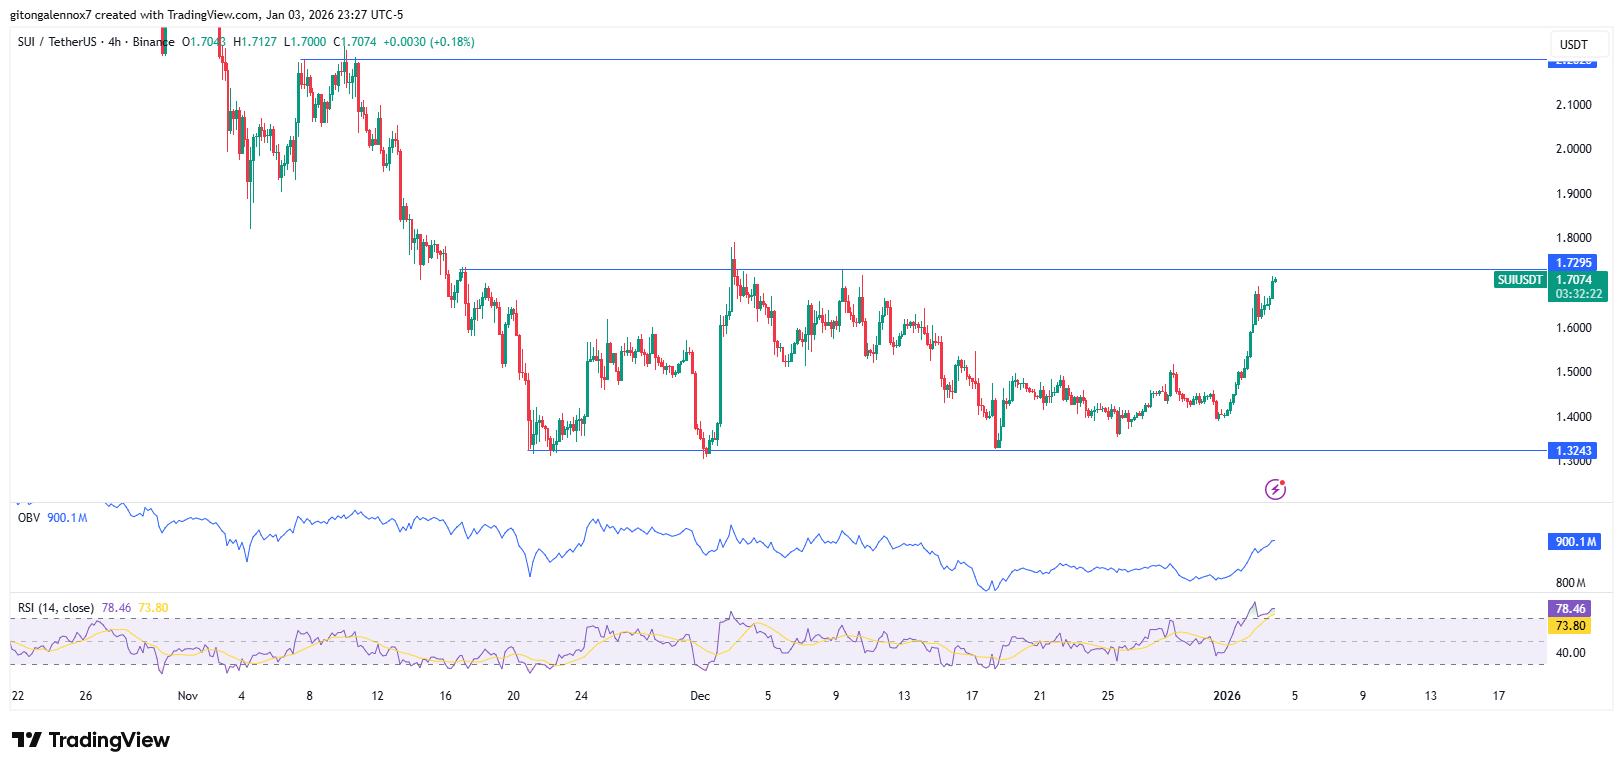
OBV went up to around $900 million. This demonstrated increased participation and confirmed that volume, not just price spikes, was supporting the recent rise.
Thus, if the price stayed above $1.60, it could go on past $1.73 and maybe even higher. On the other hand, if the price fails to break past $1.73, it might have a pullback to $1.50 or a full-range retest near $1.32.
Activities on Sui Crypto Blockchain
Looking at Sui crypto on-chain data, similarities were still there, influencing supply dynamics. The blockchain recently absorbed a $60 million token unlock without any problems.
Mysticeti v2 upgrade greatly reduced latency. The transactions per second (TPS) were maintained at around 866. The total value locked (TVL) was over $1 billion, thanks to a 30% rise in DEX trading volume and BTCfi integrations.
Daily transactions surpassed 13 million, while new active users, who were at 1.3 million, were half of the returning active users.
Again, if Bitwise and Canary approve the Spot SUI ETFs, it could lead to more money coming in. Thus, Sui price has been steady. This stability after the unlock showed that holders were very confident.
SUI is considered a scalable execution layer. However, how well it works depends on how many people use it and what the rules are. Bearishly, risks or delays in the broader market could put pressure on gains.
The post SUI Price Eyes 388%+ Rally Amid Crypto Market Recovery appeared first on The Market Periodical.