


Author: Prathik Desai
Compiled by: Block Unicorn
Foreword
Everyone agrees that stablecoins are thriving. Their circulating supply has more than doubled, and adjusted trading volume has more than tripled—all in just two years. Last month, stablecoins set a new all-time high for monthly adjusted trading volume. While some dismiss these figures, the crypto Twitter (CT) community is celebrating.
Butnumbers alone don’t tell the full story of growth. Equally important is the context in which this growth is occurring—for example, who is using stablecoins, for what purposes, and whether usage patterns are shifting. Allium generously shared with us their latest report on stablecoin infrastructure, “Stablecoins: The Rise of a New Payment Channel.” This report is well worth reading, as its charts show that stablecoin usage is transitioning from enabling low-cost cross-border remittances to supporting general business activities and B2B supplier payments.
TodayMost of the debate surrounding stablecoins focuses on whether they are financial products (such as narrow banks, treasury bond packages, or yield instruments) or simply payment infrastructure. Policy discussions about the future of stablecoins are based on the assumption that stablecoins are primarily financial tools. However, data in the report suggests otherwise: recent stablecoin transaction activity is increasingly resembling a payment channel rather than a savings product.
This follows the same development pattern as the ACH network: from replacing paper checks in payrolls to becoming an infrastructure cornerstone for general commerce, B2B payments, and consumer bill payments.
In today'sin-depth analysis, I’ll use data from the Allium stablecoin infrastructure report to explain how it has reshaped my perspective on the future direction of stablecoins.
Speed divergence
Since January 2024, the circulating supply of stablecoins (calculated by subtracting non-circulating supply from total supply) has increased by more than 100%. During the same period, adjusted trading volume (calculated by excluding fake trades, intra-entity flows, and round-trip transfers) has increased by 317%.
During the accumulation phase of anynew asset, supply typically grows faster than usage. As the asset matures, usage grows faster than supply. This occurs because asset holders increasingly use the asset. Here, since the adjusted trading volume of stablecoins has grown far faster than their circulating supply, this indicates that stablecoins have evolved from store-of-value assets into more effective mediums of exchange or transfer.
This shift is also reflected in the velocity of stablecoins, which is the adjusted trading volume divided by the circulating supply..
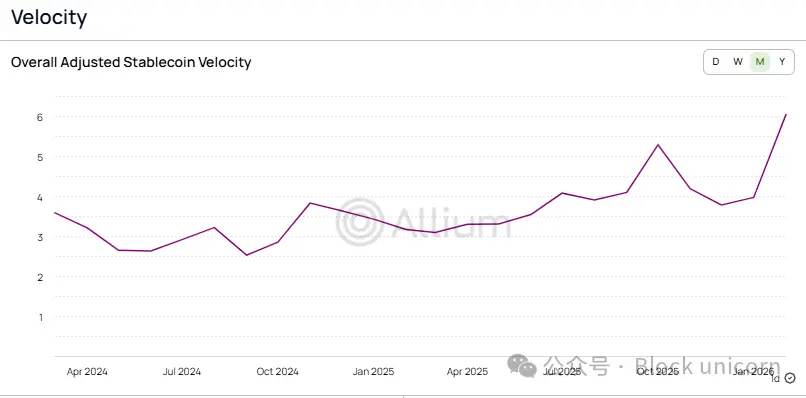
Over the past two years,the transaction velocity of stablecoins has increased from 2.6 times to more than 6 times, meaning the turnover rate per dollar of stablecoin has risen by 2.3 times compared to January. When compared to traditional payment systems, it is clear that stablecoin adoption has become highly mature.
Another metric for measuring the maturity of stablecoin usage is the number of transactions. It is least affected by fluctuations in large-volume trades. Therefore, when the growth rate of payment transactions exceeds the growth rate of trading volume, it indicates that the average payment amount is decreasing. This phenomenon typically suggests that the payment system is gradually stabilizing, rather than being an experimental tool being promoted across exchanges.
This raises the question: who is paying for all these transactions, and what are these payments used for?
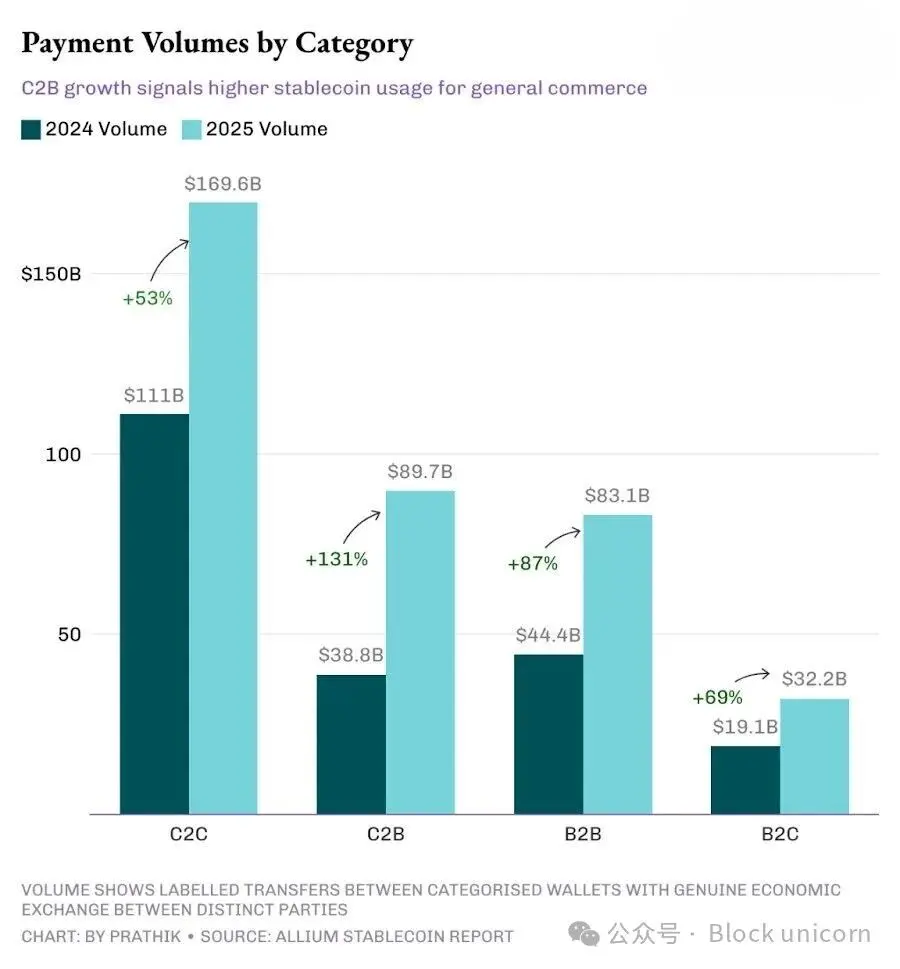
By 2025, consumer-to-consumer (C2C) channels will remain the largest, outpacing consumer-to-business (C2B), business-to-business (B2B), and business-to-consumer (B2C) channels. However, their growth rate will be the slowest among the four channels.
C2C Trading growth has slowed, highlighting the maturity of stablecoin applications, as peer-to-peer transfers represent their simplest use case. It requires no merchant integration, no invoicing tools, no API, and faces minimal barriers to adoption. This is how most new payment technologies typically begin.
When India launched the Unified Payments Interface (UPI) ten years ago, retail users were the first to adopt it, largely due to cashback and other customer acquisition strategies. I remember people using Google Pay (originally called Tez in India) to transfer money between their own accounts because it offered $1 cashback at the time. It wasn’t until business tools, reporting features, and dedicated voice-based payment confirmation systems were introduced that stores and merchants began to join.
As infrastructure matures,commercial use cases are beginning to capture a larger market share—and this shift appears to be underway.
C2BThe rapid growth in this sector indicates that an increasing number of users are utilizing stablecoins for general commercial activities, subscription services, and merchant payments. Meanwhile, growth in the B2B sector shows that business counterparties are adopting stablecoins for invoicing, supply chain payments, and treasury operations. With growth rates of 131% and 87% respectively, both C2B and B2B have surpassed the overall payment growth rate of 76%, signaling that commercial payments are gaining a larger share of total payment volume.
将不断增长的 C2B 交易量与 C2B 交易的平均单价(从 456 美元降至 256 美元)结合起来看,这表明人们正在使用稳定币支付定期购买的款项,这是一种趋势。
Although peer-to-peer peer-to-peer mode still dominates in absolute numbers, it is rapidly being replaced by peer-to-peer mode.
Quarterlymarket share data makes this rotation even more apparent.
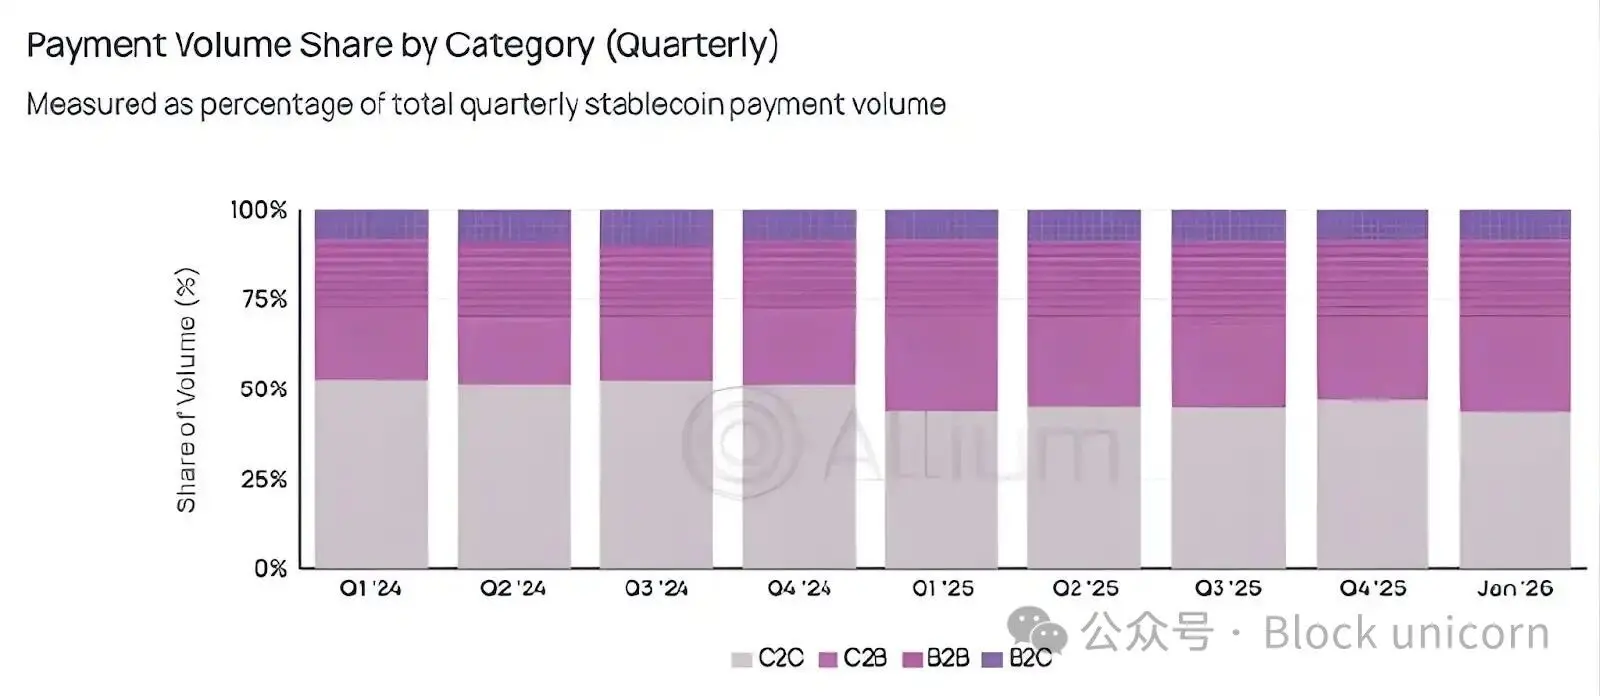
Since dropping below 50% in the first quarter of 2025, C2C payments have never exceeded 50% of total payment volume.
The world appears to be moving beyond the experimental phase of using stablecoins for low-risk, infrequent peer-to-peer transfers, toward consistently using them for frequent payments.
But the data tells a different story.When I first began tracking the adoption of stablecoins, one of the prevailing narratives was that they could enable cross-border remittances and potentially disrupt Western Union’s business model by allowing workers in developed economies to send money home. But the data shows a different outcome.
Currently, about three-quarters of stablecoin payment transactions occur domestically. Over the past year, the share of cross-border payment volume has declined from 44% to approximately 25–29%. At the regional level, 84% of payment transactions still take place within the same geographic region.
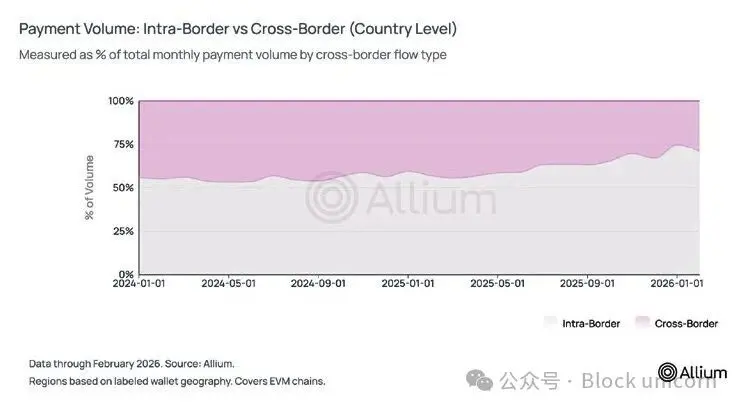
Based on all our previous charts, it is clear that stablecoins are not competing with SWIFT for the international settlement market. Instead, B2B metrics—including 74% dominance in the domestic market, declining average transaction sizes, increased use cases for payroll settlements, and expanding invoice applications—indicate that stablecoins are competing with domestic payment channels such as ACH.
For reference, ACH B2B payments grew by approximately 10% in 2025, while stablecoin B2B payments grew by 87% during the same period. I recognize that the absolute scales of the two are not directly comparable, and we must also account for the lower baseline of stablecoins. However, this growth momentum cannot be ignored.
The road ahead is long.
For a long time, I believed that cross-border remittances and peer-to-peer transfers were the main drivers behind the adoption of stablecoins. Imagine someone in Asia receiving U.S. dollars from family in Dubai during bank holidays, without paying 7–8% in intermediary fees—that’s still a compelling story. But while it remains valid, it may no longer be the dominant narrative.
It's interesting to observe how domestic commercial theories have quietly and rapidly surpassed everything else. The C2C category has not been able to reclaim 50% market share for over a year, yet this fact remains largely unknown in cryptocurrency discussions. But it is precisely this metric that signals stablecoinstransitioning from a cryptocurrency product into a financial infrastructure underpinning commercial activities between consumers and merchants, or between merchants themselves.
It is also worth noting that Allium’s payment volume analysis is based on wallet data they have covered, identified, and labeled. While the analysis shows that payment volume accounts for only 2–3% of adjusted stablecoin transaction volume, this is likely an underestimate, as there are likely many wallets that Allium cannot cover.
Looking ahead, I will closely monitor whether the C2B and B2B shares continue to grow, and whether the trend of declining average transaction sizes persists over the next few quarters. If both trends remain intact even during periods of crypto market downturn, it would indicate that stablecoin payment infrastructure is beginning to decouple sustainably from speculative crypto activities.