


Author: Elad Gil (Data Analysis: Shreyan Jain)
Compiled by: DeepWave TechFlow
DeepSight Summary: Elad Gil’s team has tracked global unicorn market valuations for six consecutive years; 2025 data reveals a clear trend: the San Francisco Bay Area is emerging as the epicenter of generative AI, with 91% of global AI unicorn market value concentrated within a one-hour drive. Meanwhile, the pace of new unicorn creation has slowed, but the average valuation of existing unicorns has reached a six-year high. This report uses hard data to show that the center of gravity in the global startup ecosystem is rapidly shifting toward the United States and the Bay Area.
All data is as of December 31 of the respective year; "2025" in the text refers to the market capitalization as of December 31, 2025 / January 1, 2026.
Over the past two years, we have witnessed market corrections in a post-zero-interest-rate era, the explosive rise of cutting-edge AI labs such as OpenAI and Anthropic, and ongoing debates surrounding the “AI bubble.” Data shows that the San Francisco Bay Area has evolved into an AI supercluster, with 91% of global AI private market valuation concentrated within a one-hour drive.
Previous year analyses can be referenced: 2019, 2020, 2021, 2023.
Key Findings
- Generative AI has turned the Bay Area into a supercluster. The Bay Area currently accounts for approximately 39% of global unicorn market value—more than four times that of the second-ranked city—up from 29% just one year ago. When considering only generative AI unicorns, the Bay Area’s share rises to 91%.
- The absolute dominance of U.S. unicorns. The U.S. added nearly $1.2 trillion in unicorn market value over the past year, accounting for approximately 65% of the global total. Europe has surpassed China in market share but holds only around 10%.
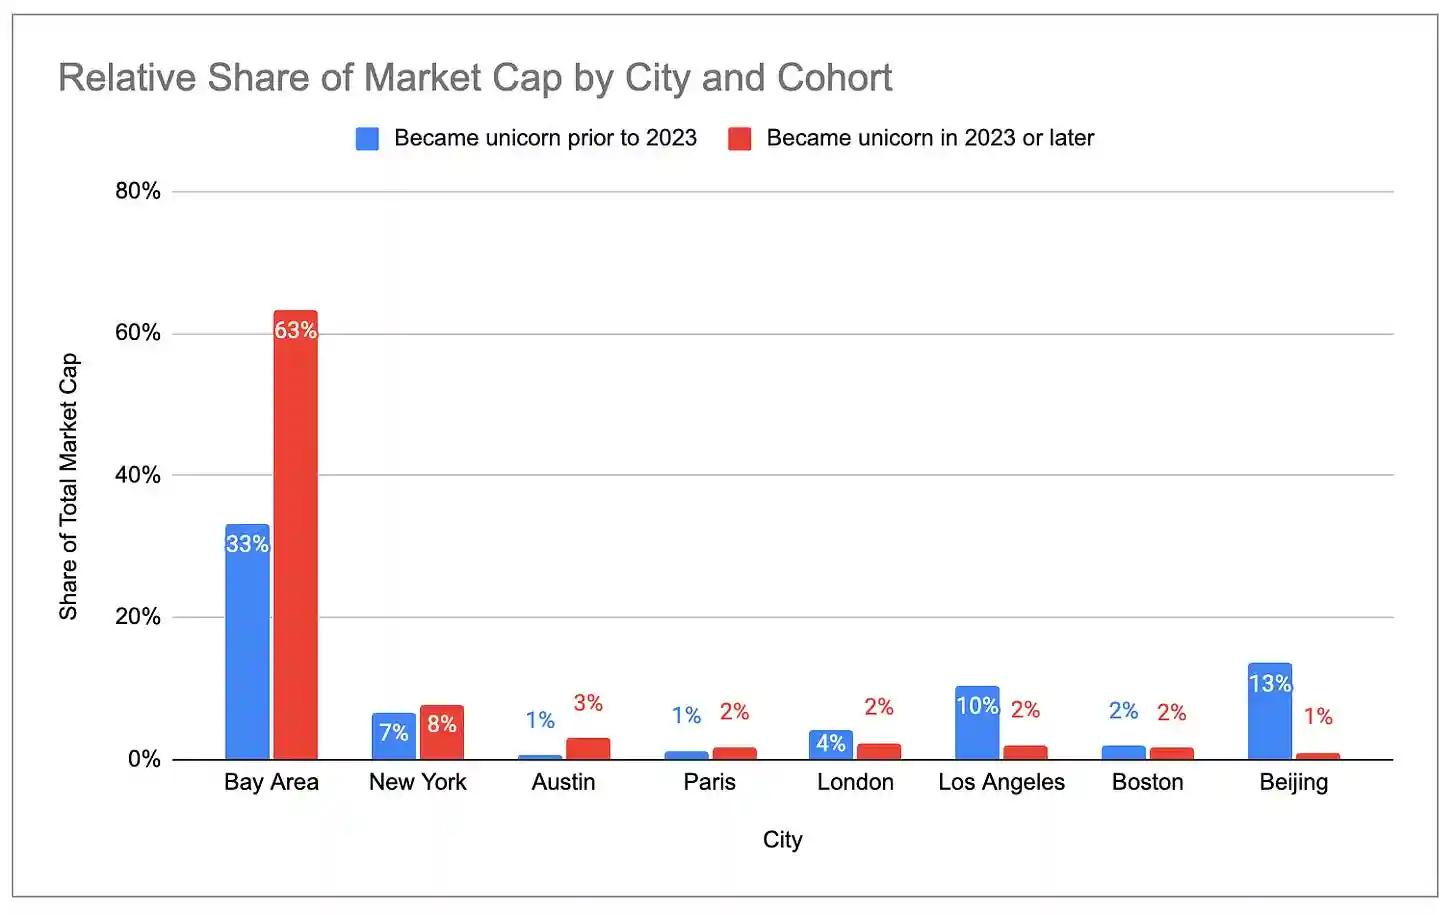
- The new generation of unicorns is more concentrated in the United States and the Bay Area. Among unicorns founded in 2023 and later, the U.S. accounts for 83% of total market capitalization, compared to 60% for those founded in 2022 and earlier. The Bay Area’s share is even more pronounced: 63% for the new generation versus 33% for the older generation.
- The rate of new unicorn creation is slowing. Only around 300 new unicorns were added between 2022 and 2025, compared to over 900 in the previous three years.
- But existing unicorns are more valuable than ever. While the total number of unicorns grew by only 6% year-over-year, their combined market capitalization increased by 33%. The average market capitalization per unicorn reached its highest level in six years.
- Valuation growth has been primarily driven by AI companies. In 2025, the average year-over-year valuation increase for generative AI unicorns was approximately $2.2 billion, compared to just $400 million for non-AI unicorns. The share of generative AI in the global unicorn market cap surged from 2% in 2024 to 22%. The concentration in the Bay Area will only continue to expand.
- Unicorn hubs cluster around specific industries. Six of the top ten unicorns in the Bay Area are AI companies; seven of the top ten in New York are fintech/crypto companies; three of the top five in Los Angeles are defense/aerospace companies (SpaceX, Anduril, Relativity, accounting for 83% of Los Angeles’s total unicorn valuation), with four additional consumer companies in the top ten.
Data description
All original data comes from CB Insights and can be viewed here. There are a few notes to keep in mind:
Updates to private funding rounds in the public dataset are delayed, and some unicorn valuations may not be current. For example, the latest funding rounds for Anduril, Stripe, and SpaceX are not reflected in the data.
The market capitalization of unicorns is at best a crude and lagging proxy for the vitality of the startup ecosystem, and inevitably contains some inaccuracies in mapping companies to valuations, cities, and industries. However, we believe the data is accurate in broad trends.
Unicorn concentration
The geographic concentration of global unicorn valuations has reached a historic high. The United States accounts for 65% of all unicorn valuations, up from 58% a year ago and 44% in 2020. The U.S. share is approximately four times that of China, the second-ranked country.
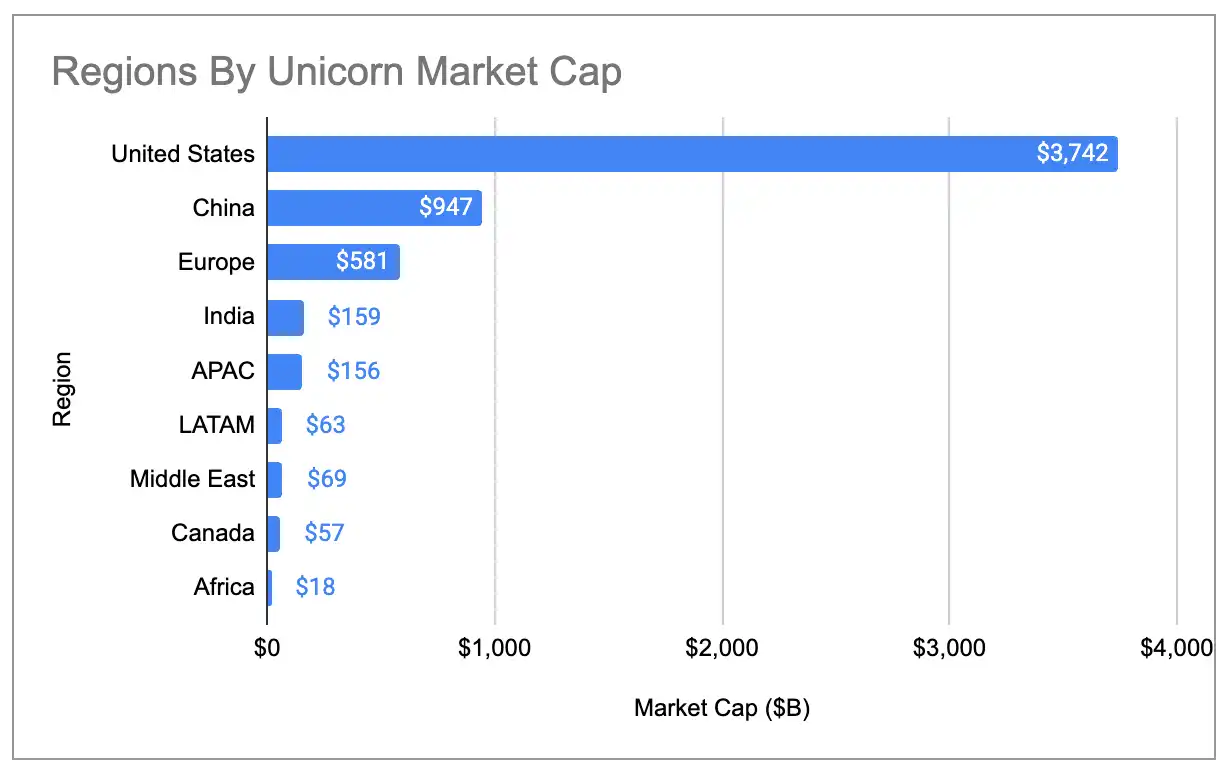
Caption: Global share of unicorn market capitalization by country (including three outliers)
The unicorn market capitalization in the Bay Area is more than four times that of the second-largest city, increasing its global share from 29% in 2024 to 39%:
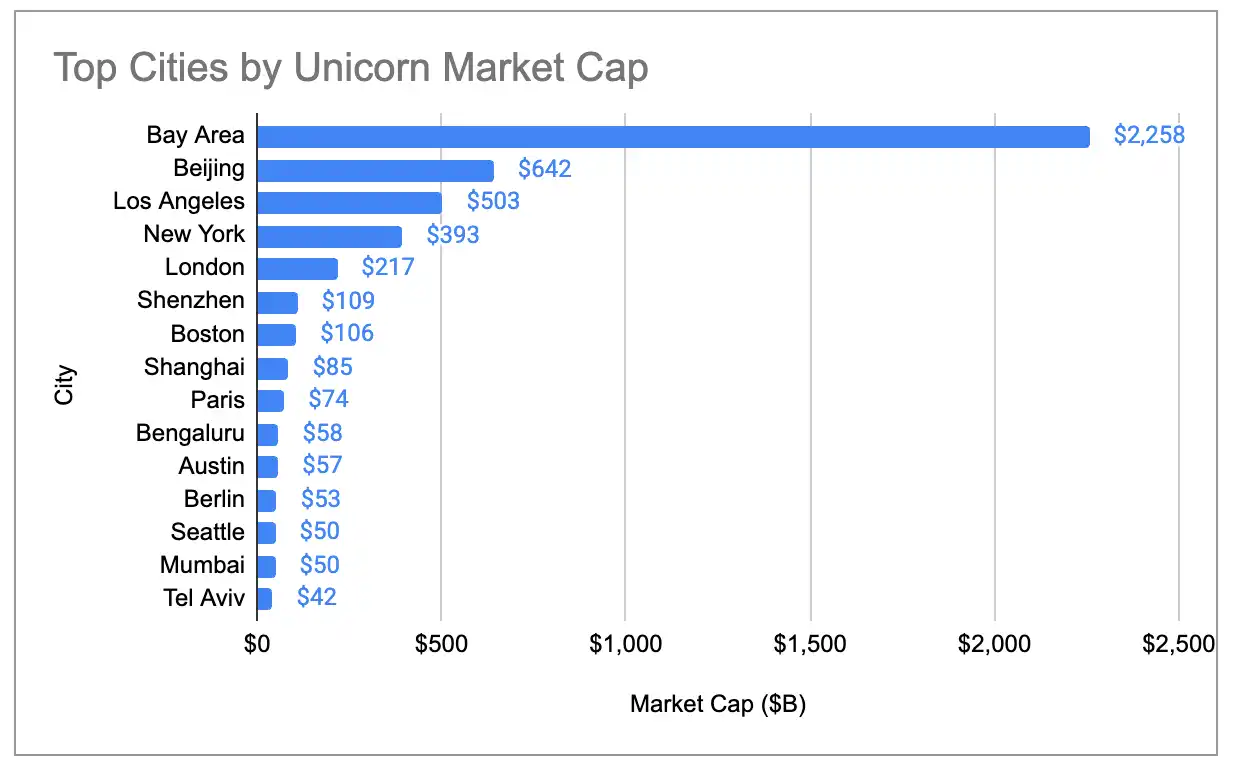
Caption: Global market share of unicorns by city (including three outliers)
Even after excluding the three largest outliers—OpenAI ($500 billion), SpaceX ($400 billion), and ByteDance ($300 billion)—the major ecosystems have continued to concentrate since 2019. The U.S. share has steadily risen, while China’s has steadily declined. In 2024, the total valuation of Europe’s unicorns surpassed China’s, with New York and London exceeding Beijing.
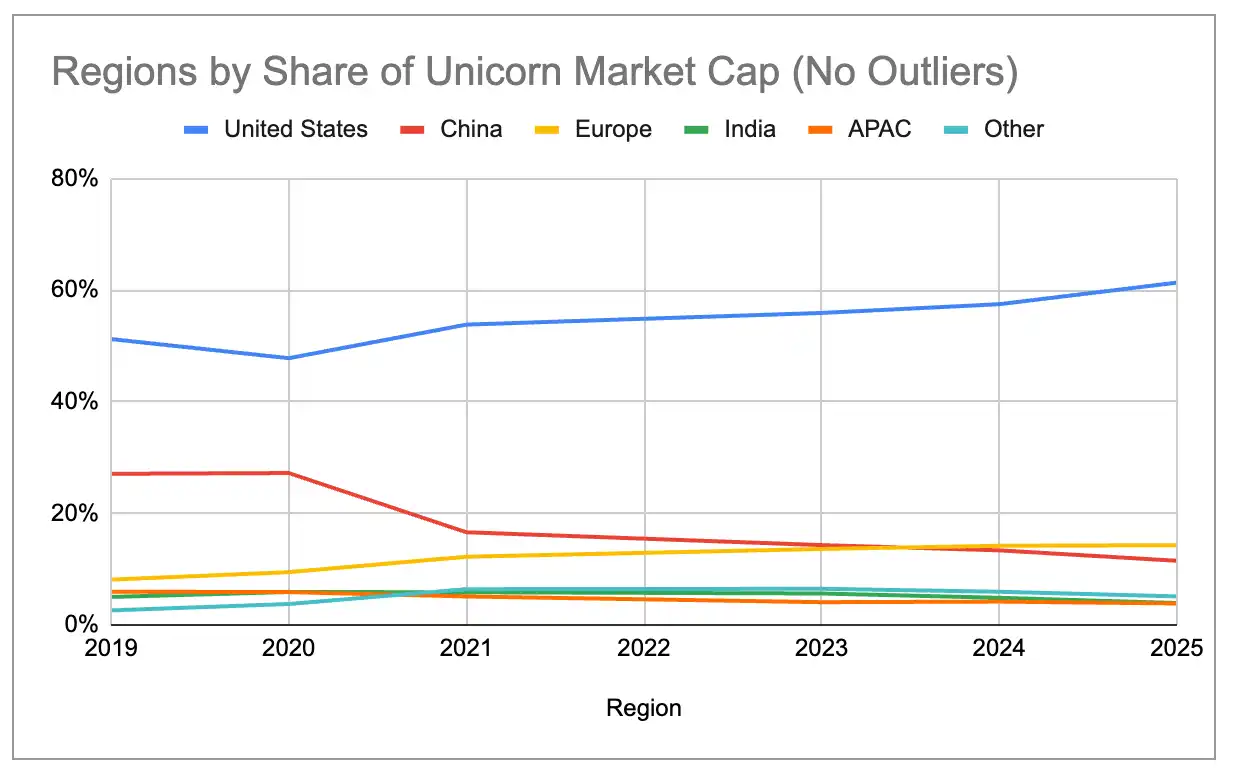
Caption: Global share of unicorn market capitalization by country (excluding three outliers)
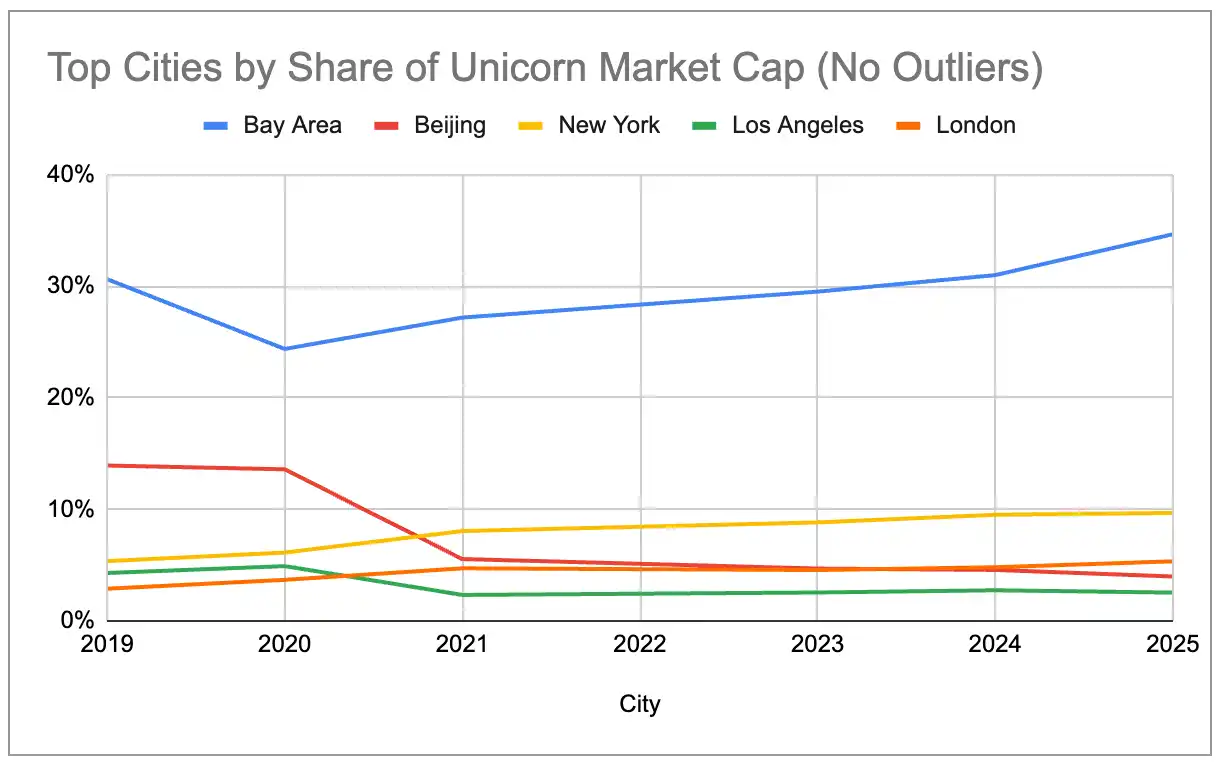
Caption: Global market share of unicorns by city (excluding three outliers)
The extreme centralization of generative AI
If we look only at the 97 unicorns whose core revenue comes from generative AI products or services, the clustering effect in the Bay Area is even more extreme: the Bay Area accounts for 91% of the global market value of AI unicorns, with no other city exceeding 2%.
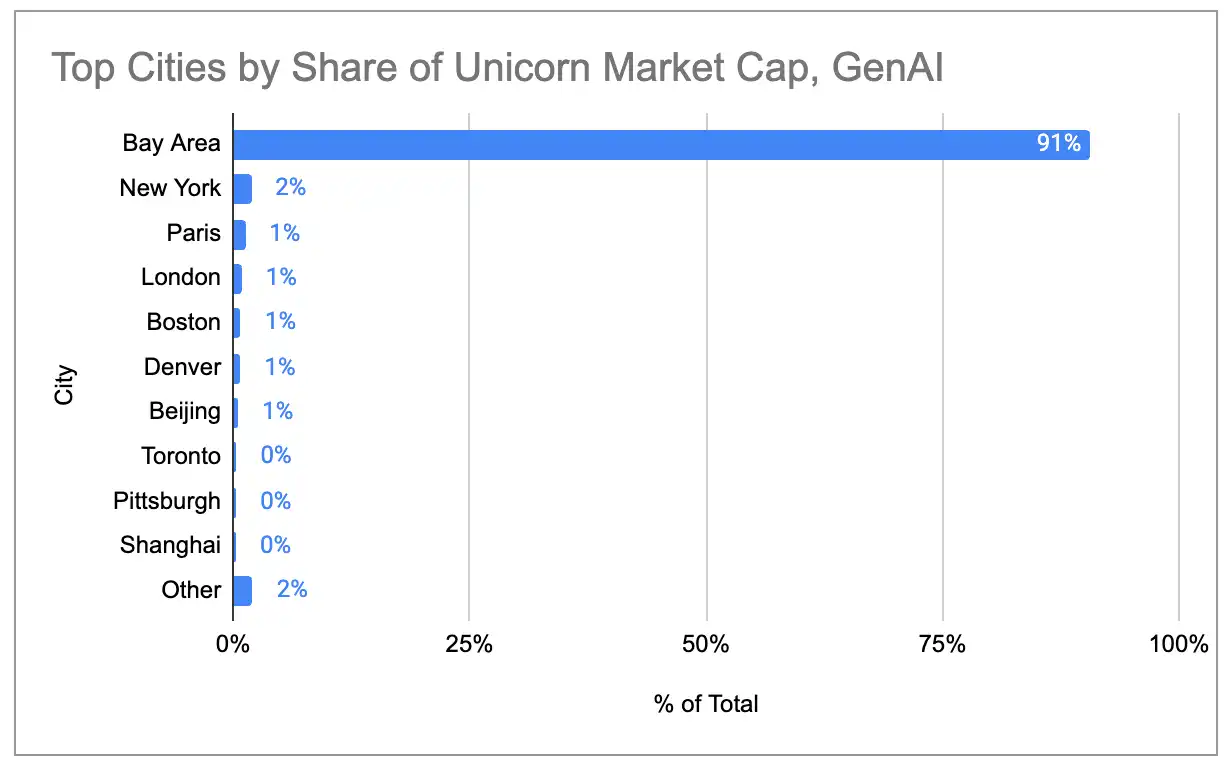
Caption: City distribution of generative AI unicorn market capitalization
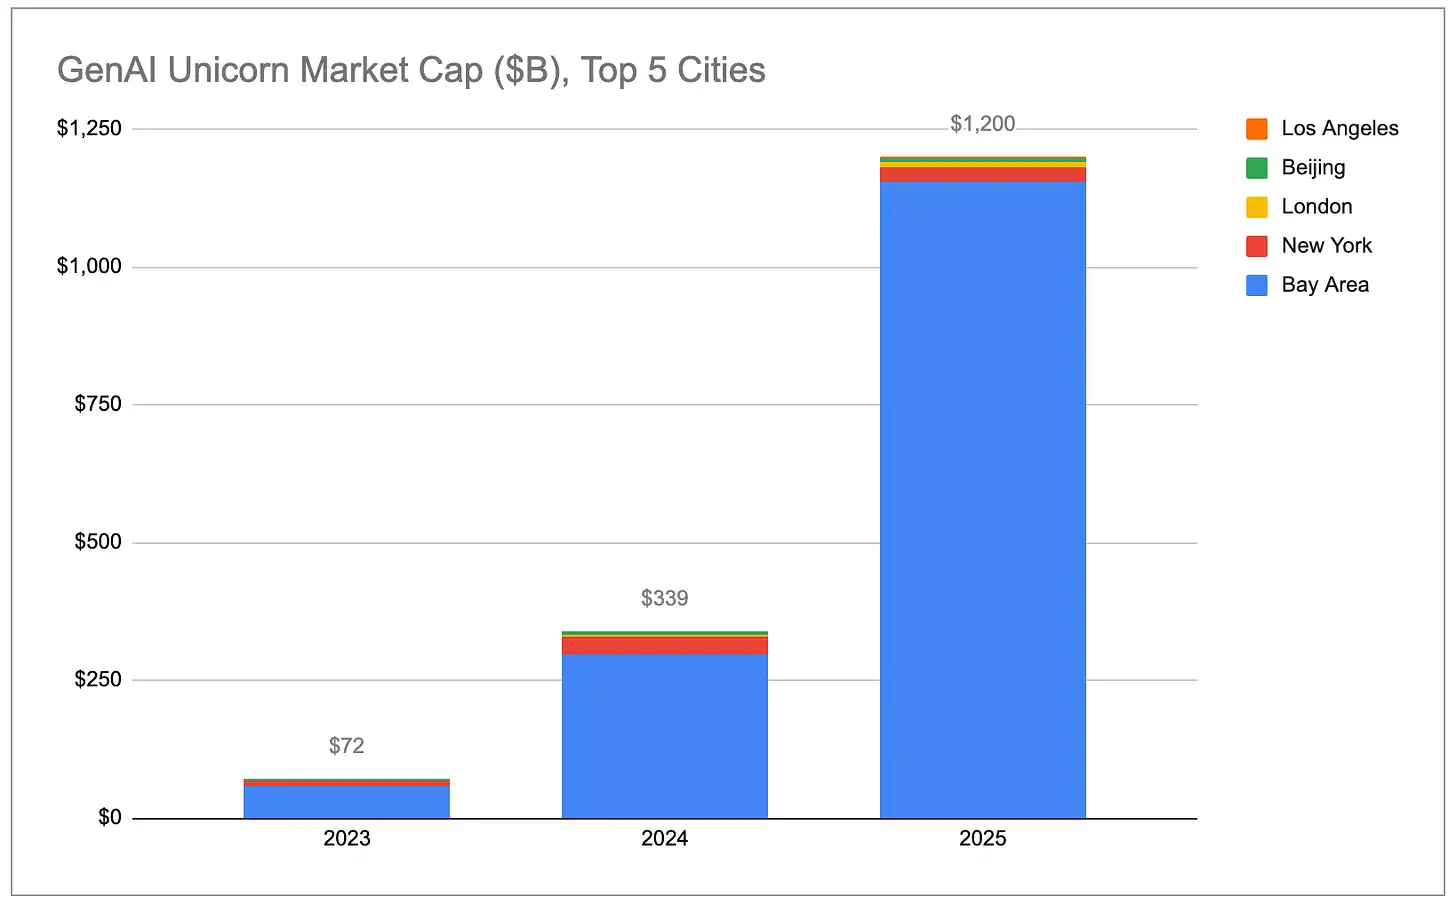
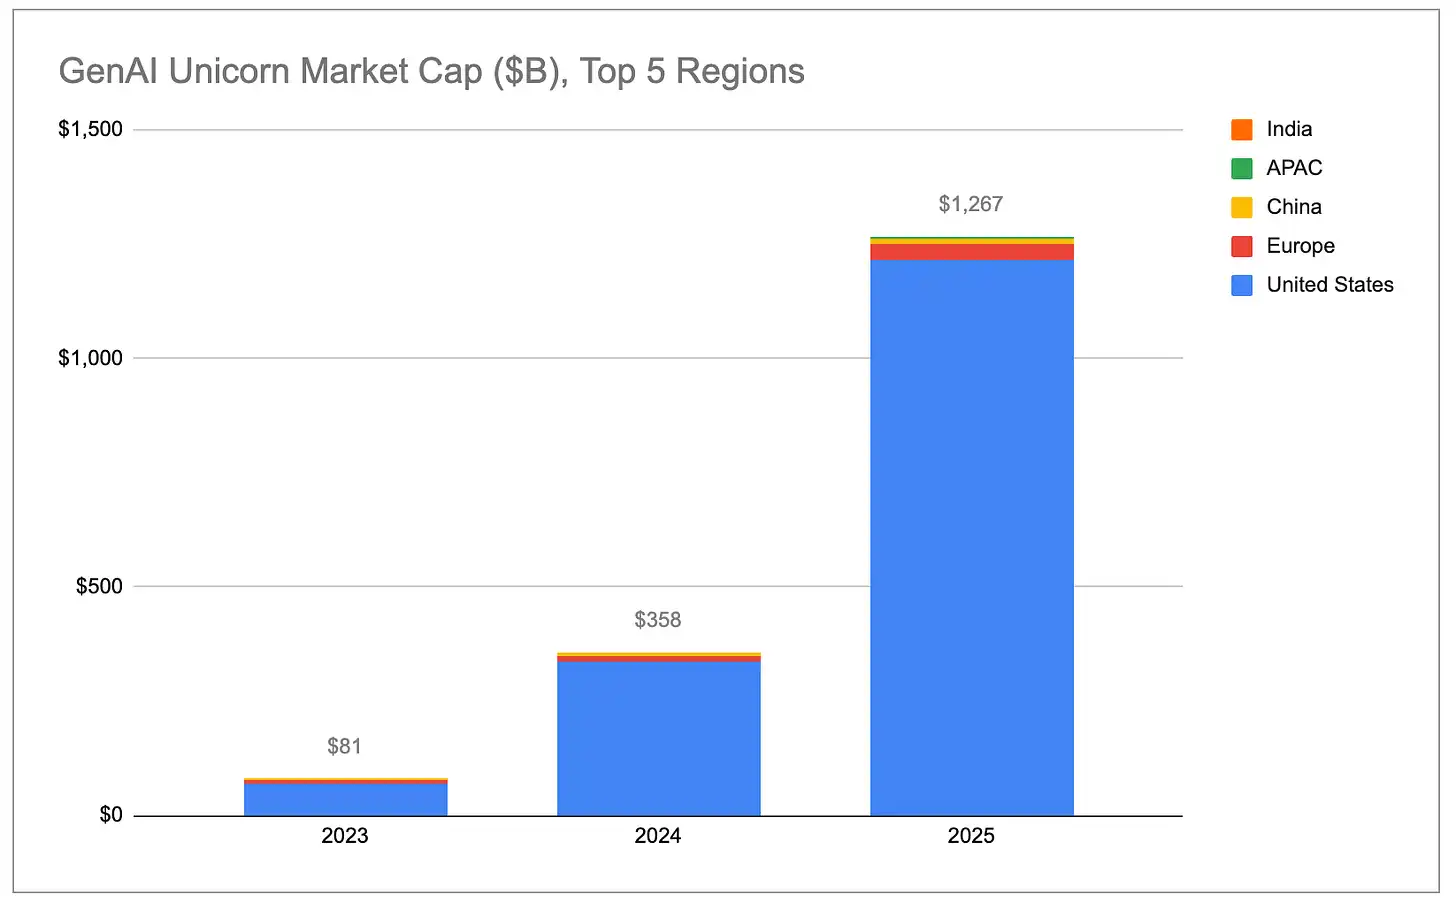
The total market capitalization of generative AI unicorns has grown exponentially, with nearly all growth coming from the United States, particularly the Bay Area.
Caption: Total market capitalization of generative AI unicorns by country
Caption: Total market capitalization of generative AI unicorns (by city)
The valuation growth rate of AI unicorns far exceeds that of non-AI unicorns. In 2025, the total market value of the 48 AI companies that became unicorns that year increased by $778 billion—more than the combined valuation increase of the remaining 1,100+ non-AI unicorns. Even after excluding OpenAI (which added approximately $343 billion) and Anthropic (which added approximately $334 billion), the average valuation growth of generative AI unicorns still reached about $2.2 billion year-over-year—five times the average growth of non-AI unicorns (approximately $440 million).
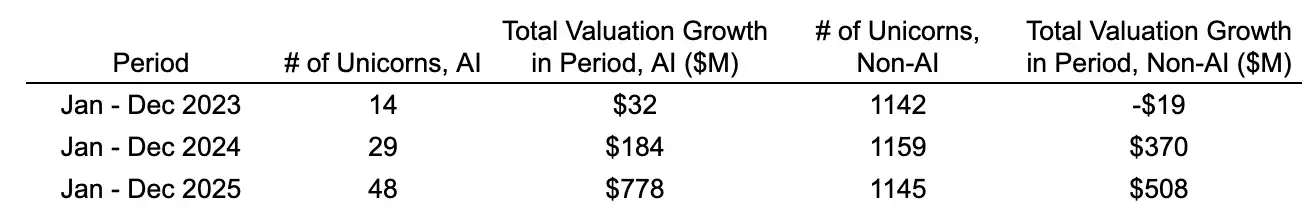
Caption: Market capitalization growth comparison between AI unicorns and non-AI unicorns
In relative terms, generative AI companies grew from accounting for 2% of global unicorn market capitalization in 2023 to 22%. If this trend continues, the Bay Area, due to its de facto monopoly on top AI companies and talent, will continue to expand its share of global unicorn market capitalization.
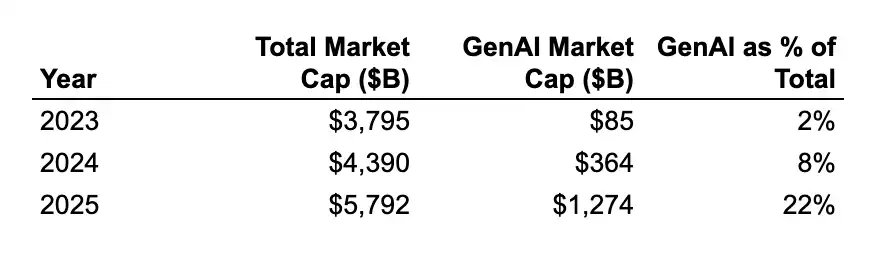
Caption: Change in the proportion of generative AI in the total market capitalization of unicorns
(Note: We classify companies as “Generative AI” only if their primary revenue directly comes from generative AI. The complete list of companies can be viewed here. We included chip/hardware companies such as Cerebras and TensTorrent, and infrastructure companies such as CoreWeave and Crusoe, but did not include data infrastructure companies like Databricks that broadly support AI/ML workloads, or robotics/defense companies like Anduril that use AI/ML for autonomous systems.
New unicorn
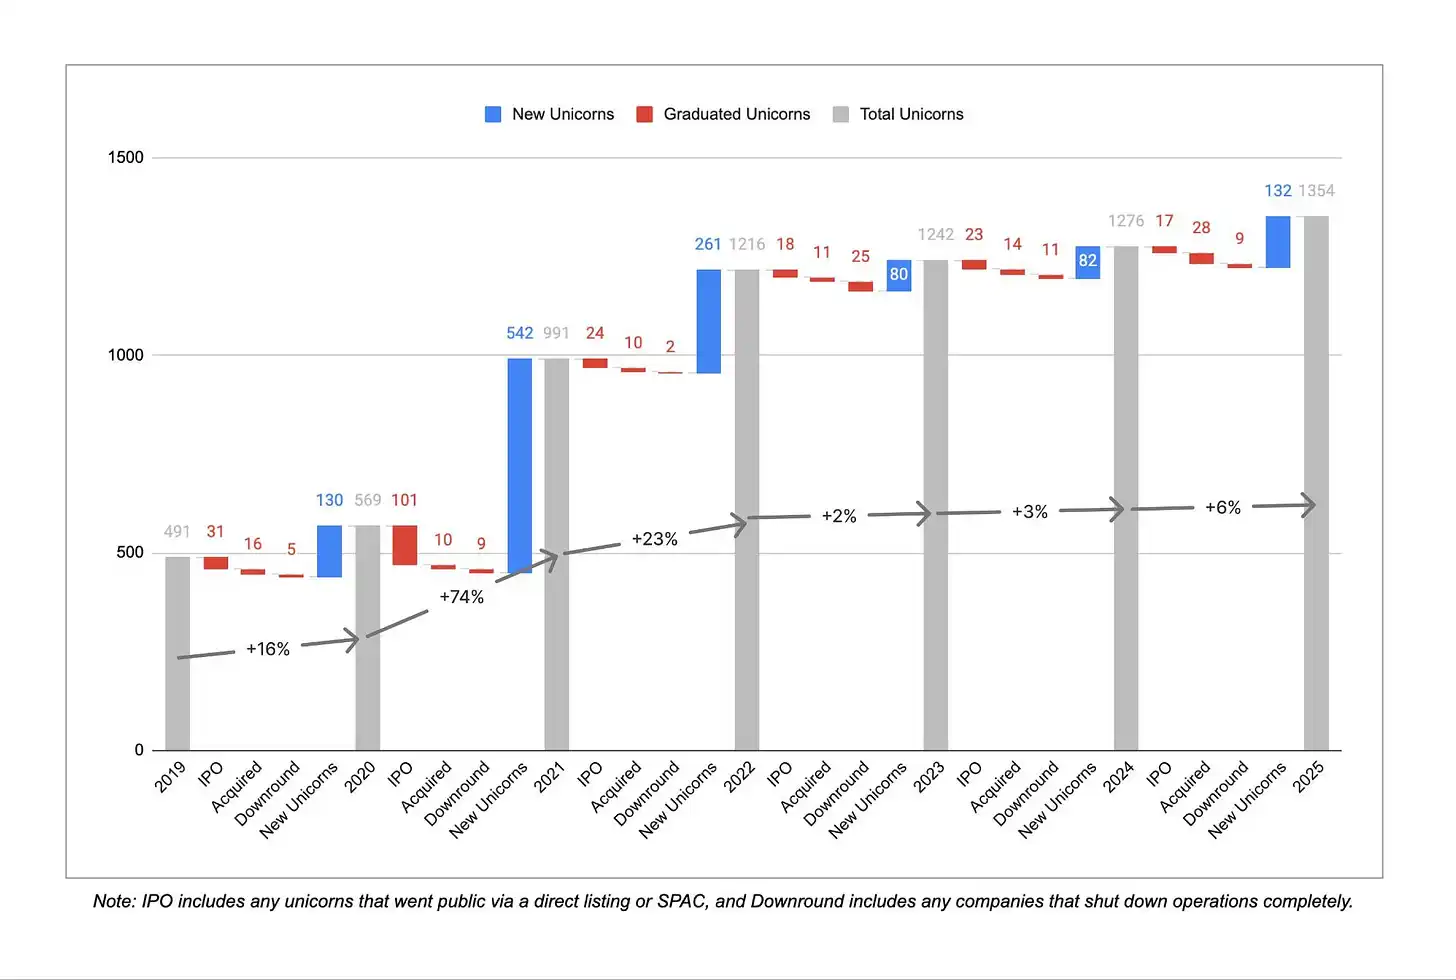
Caption: Number of new unicorns added annually
After three consecutive years of high growth, the rate of new unicorn creation has significantly slowed over the past three years. Between December 2019 and December 2022, an average of more than 300 companies joined the unicorn ranks each year. From December 2022 to December 2025, this number dropped to about 100 companies per year, although 2025 saw a modest rebound compared to the previous two years. Meanwhile, 45 companies lost their unicorn status over the past three years due to valuation adjustments or shutdowns, compared to only 16 in the prior three-year period, indicating that corrections to inflated valuations from the zero-interest-rate era of 2021/2022 are still ongoing.
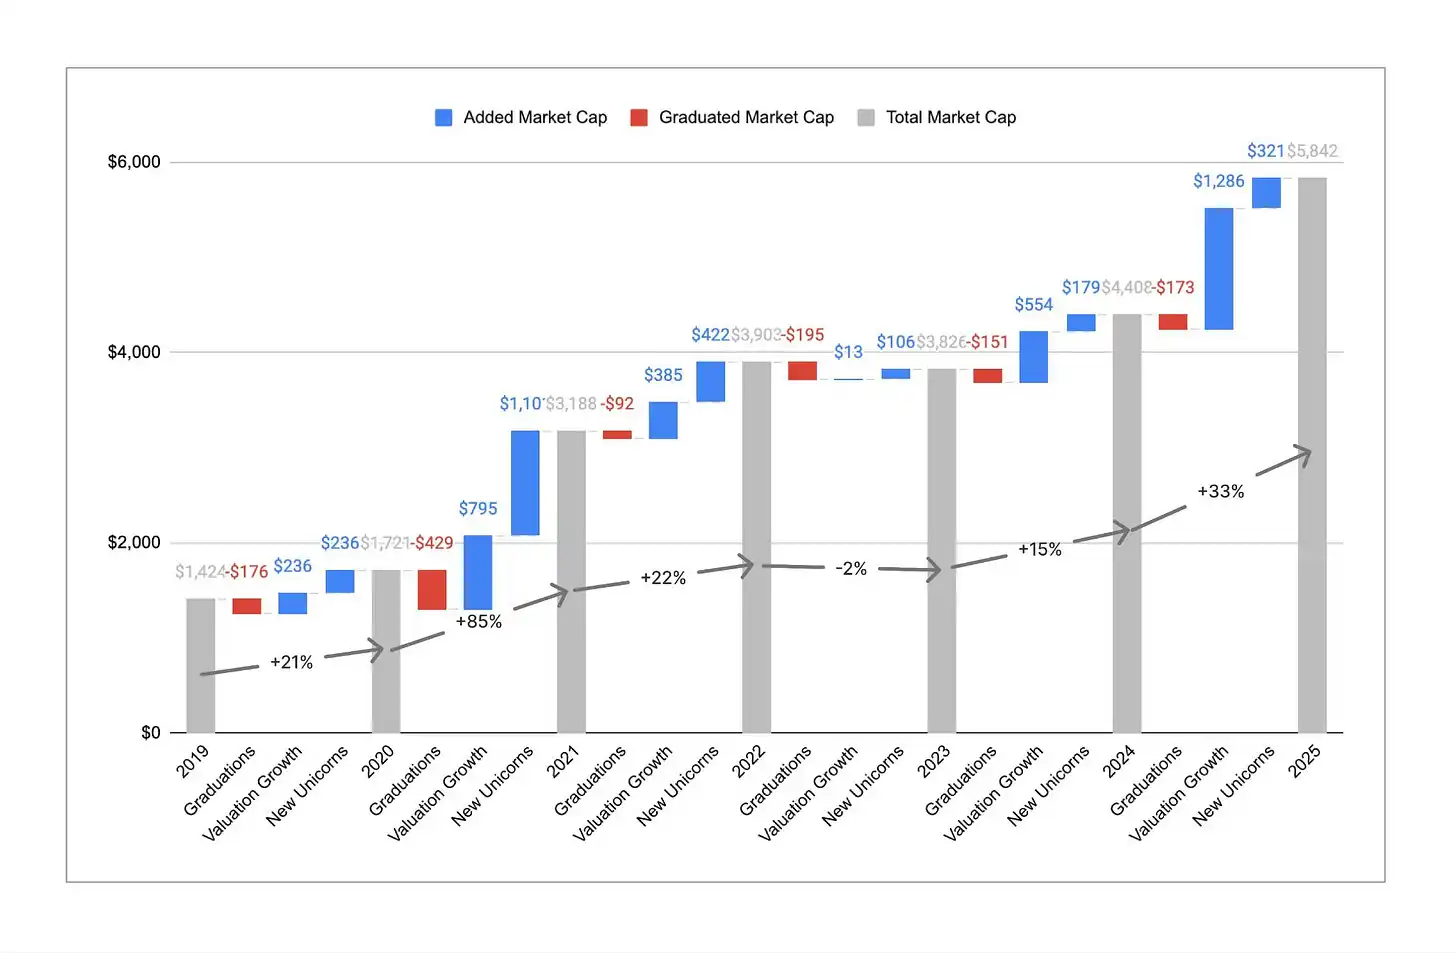
Caption: Number of unicorns vs. total market capitalization trend
Although the number of unicorns has remained largely flat, total market capitalization has grown significantly. Over the past year, global unicorn market capitalization increased from approximately $4.4 trillion to about $5.8 trillion, a 33% rise. This represents a strong rebound, especially compared to the actual year-over-year decline in total market value in 2023. Historically, market cap growth was driven primarily by new companies entering the unicorn club, but in 2025, approximately 80% of the market cap growth came from valuation increases among existing unicorns. As a result, the average market cap per unicorn rose from about $3 billion to approximately $4.4 billion—the highest level in the six years we’ve conducted this analysis. It’s harder than ever to become a unicorn, but once companies cross the $1 billion threshold, they are on average more valuable and growing faster.
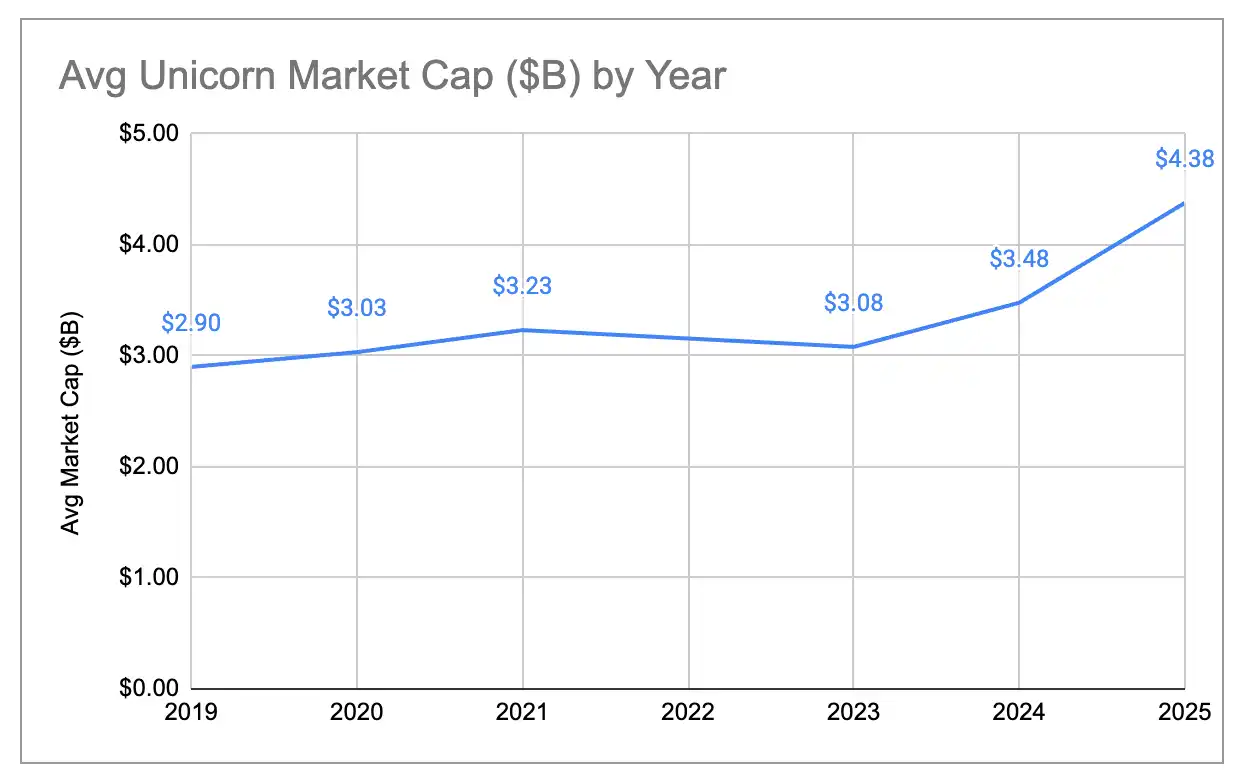
Caption: Trend in average market capitalization of unicorns
New Generation vs. Old Generation Unicorns
One way to remove the impact of inflated valuations from the zero-interest-rate era is to look only at unicorns founded after 2023. Below is a comparison of the market value distributions of unicorns from before and after 2023:
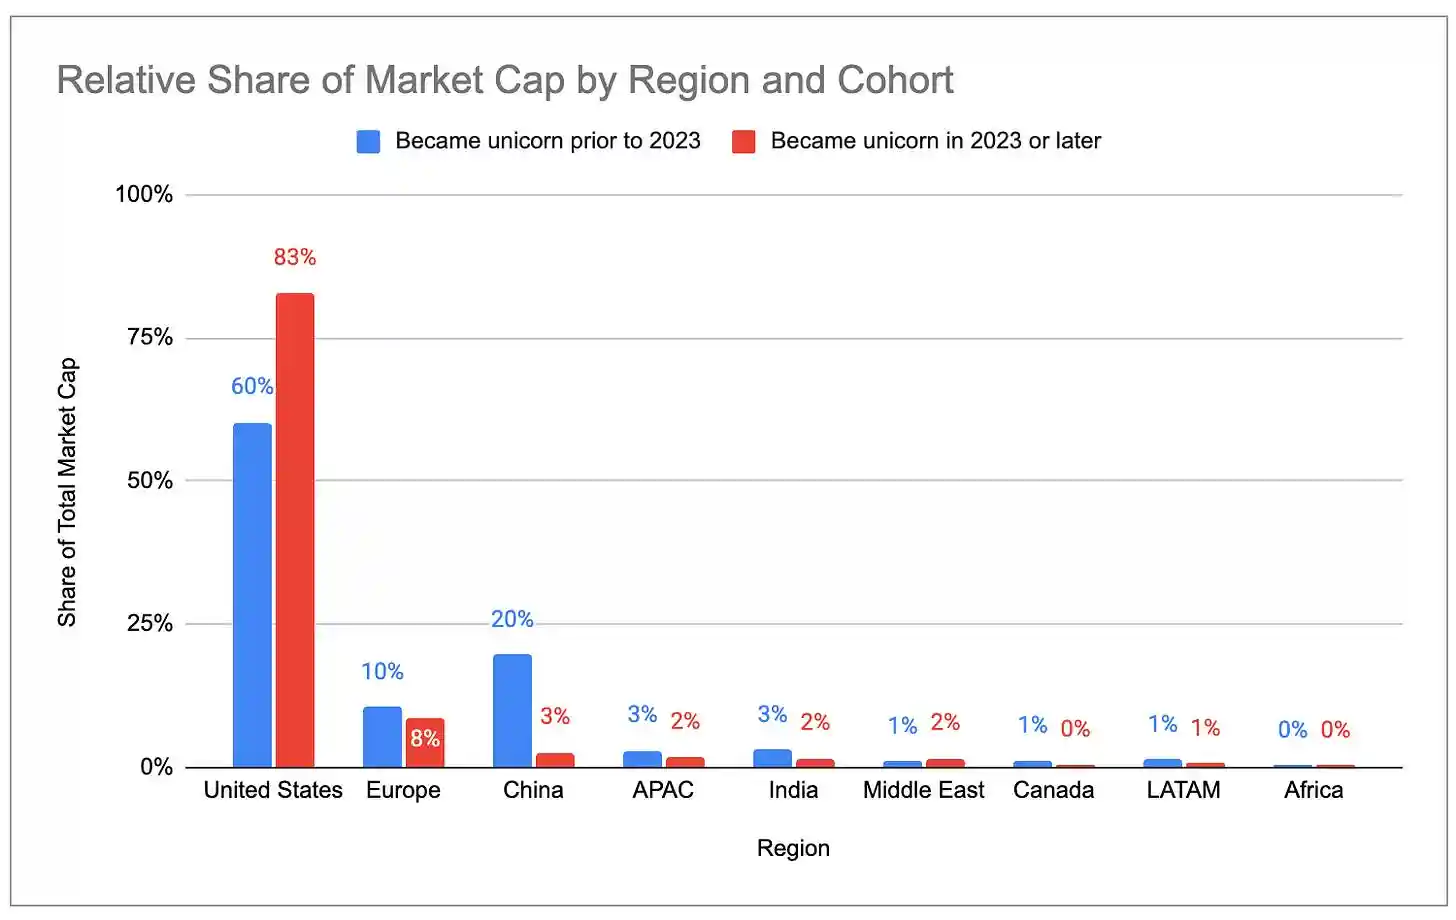
Caption: Unicorn market capitalization distribution by country/city for those founded before 2023
Caption: Valuation distribution of unicorns founded in 2023 and later (by country/city)
The new generation of unicorns is more concentrated in the United States, while the shares of Europe and China have declined. Since 2023, the Bay Area accounts for 63% of the market value of newly added unicorns, compared to just 33% among the older cohort of unicorns.
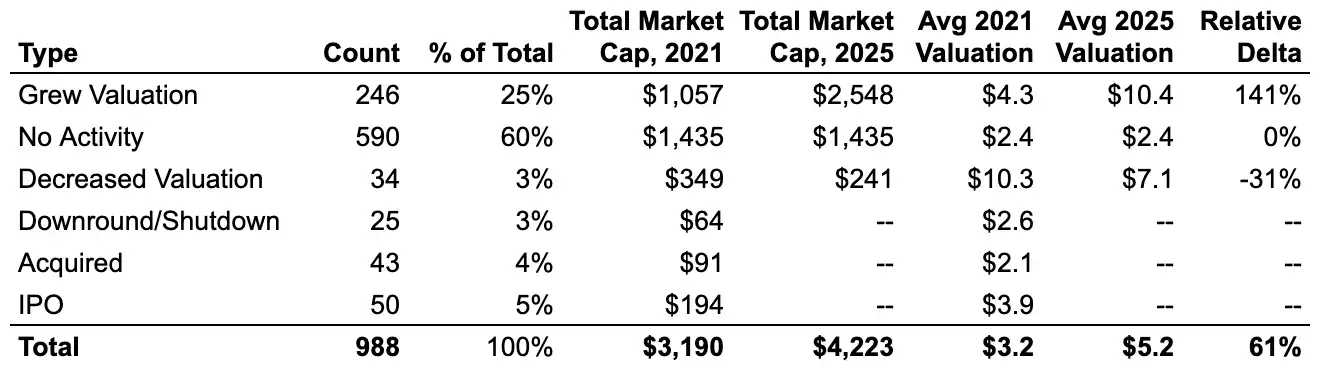
Zombie unicorn
Of the nearly 1,000 unicorns in December 2021, about 60% have maintained their unicorn status to this day without completing any new funding rounds. These "zombie" unicorns raised enough capital during the zero-interest-rate era to survive, but have been unable to surpass their valuations from that time. Together, they account for approximately $1.4 trillion in global unicorn market value, nearly 25% of the global total.
Caption: Ratio of "zombie" to "active" unicorns in 2021
The proportion of "active" unicorns (those that have completed a new funding round since 2021) is much higher in the U.S. and the Bay Area than "zombie" unicorns. In contrast, Europe, India, Latin America, and New York have a higher concentration of "zombie" unicorns.
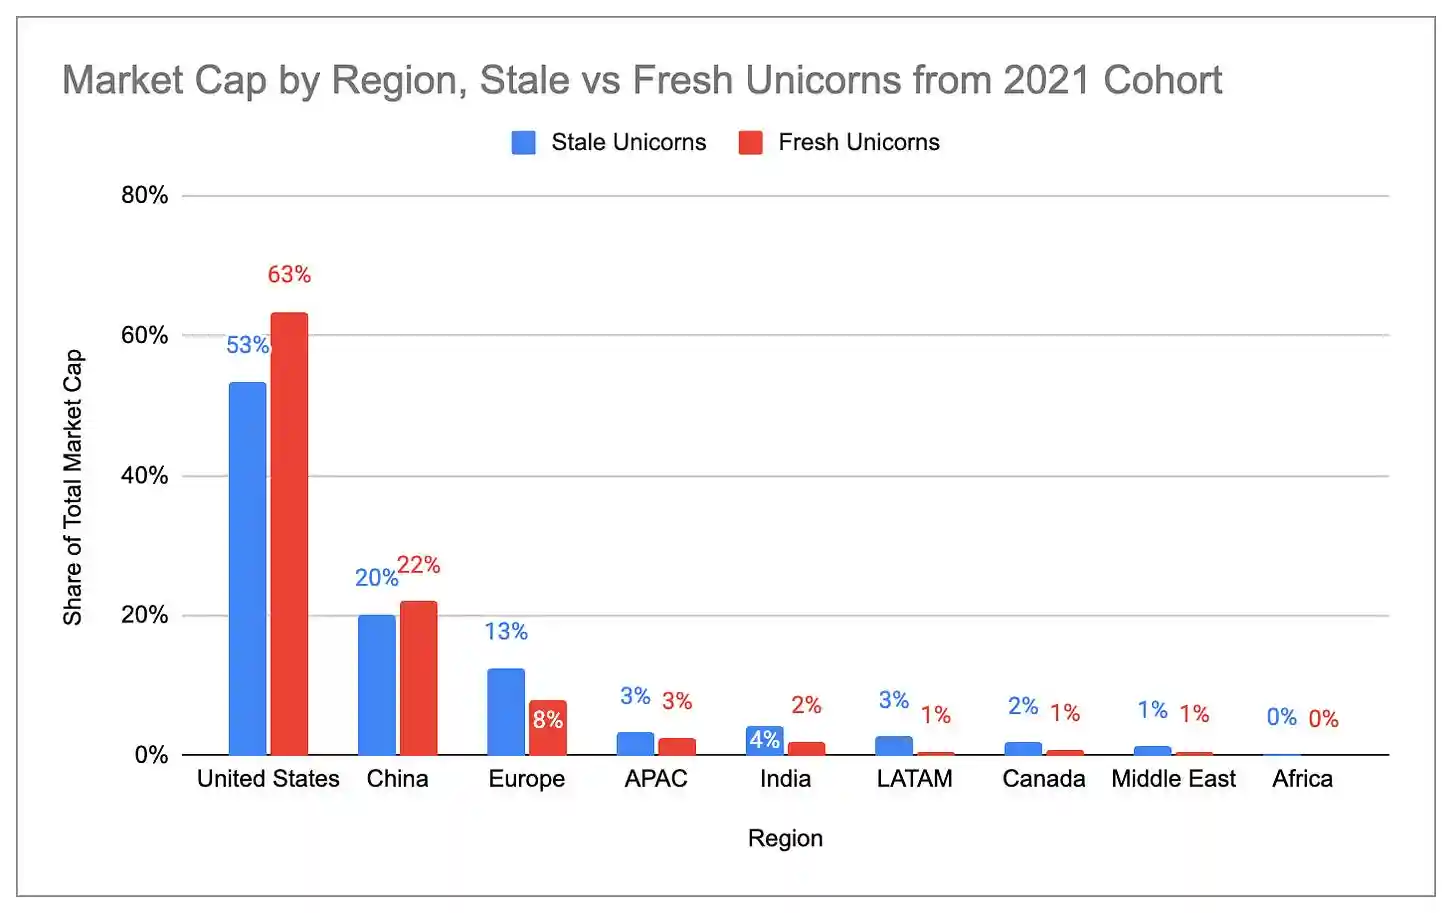
Caption: Distribution of zombie vs. active unicorn market values by country
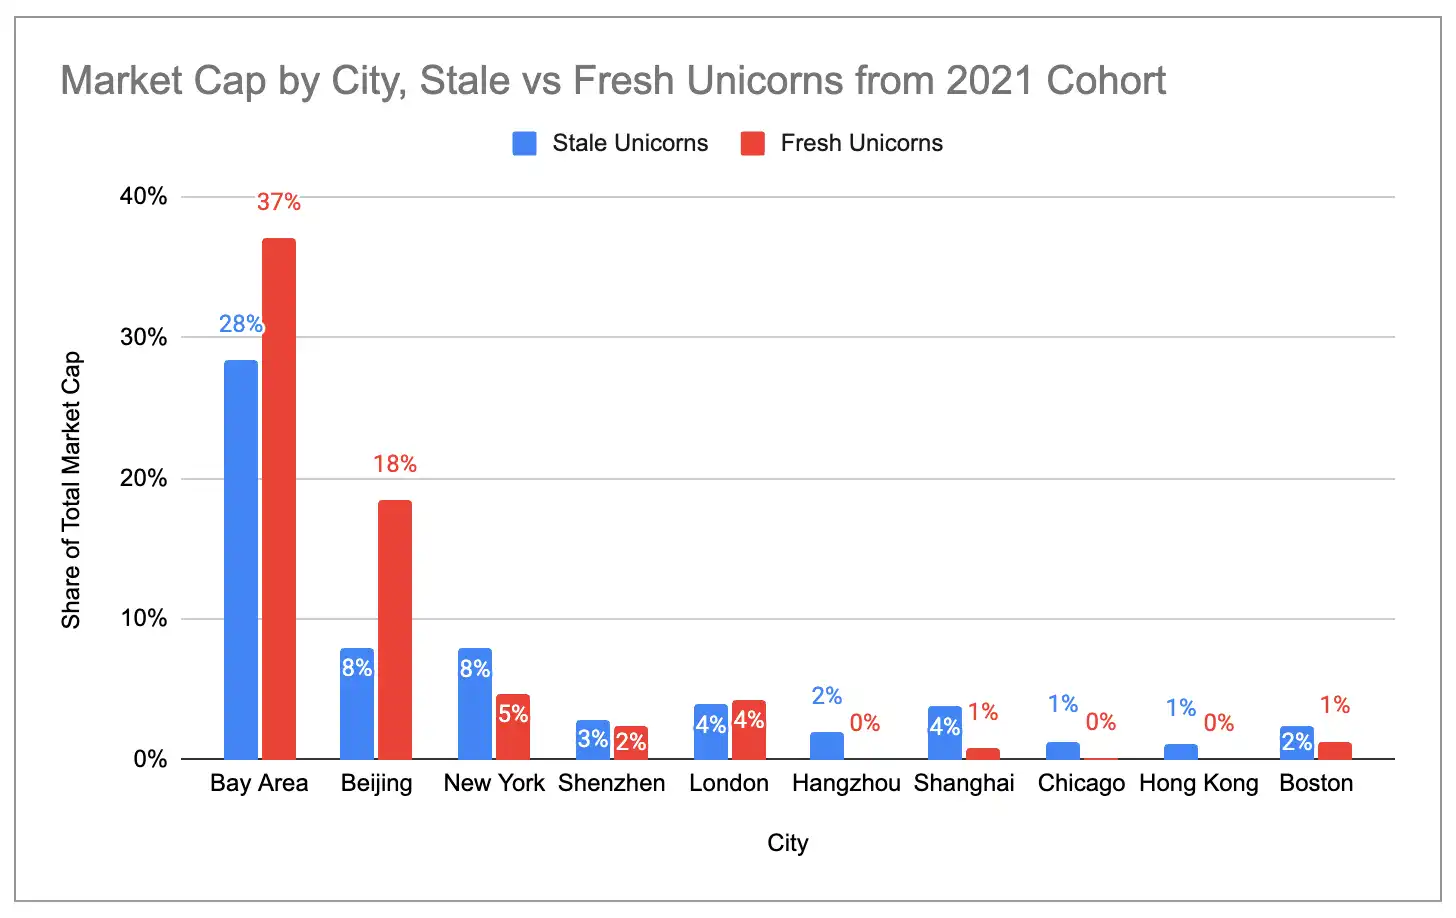
Caption: Market value distribution of "zombie" vs. "active" unicorns in each city
The four major unicorn clusters in the United States
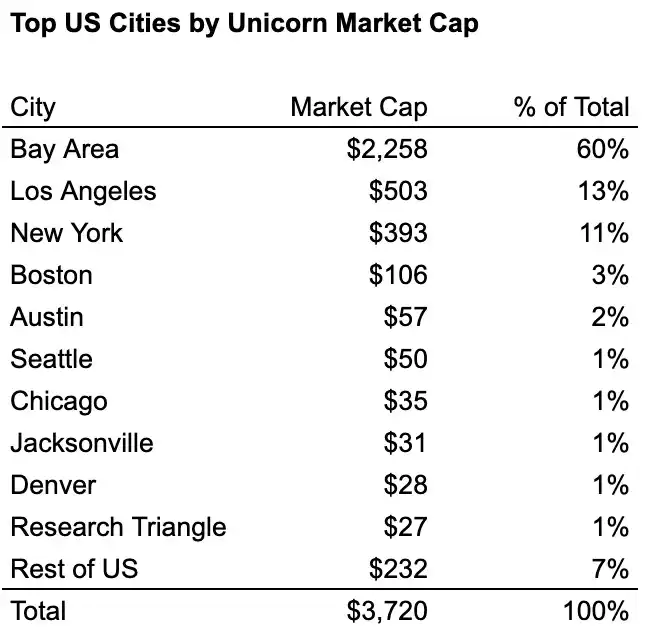
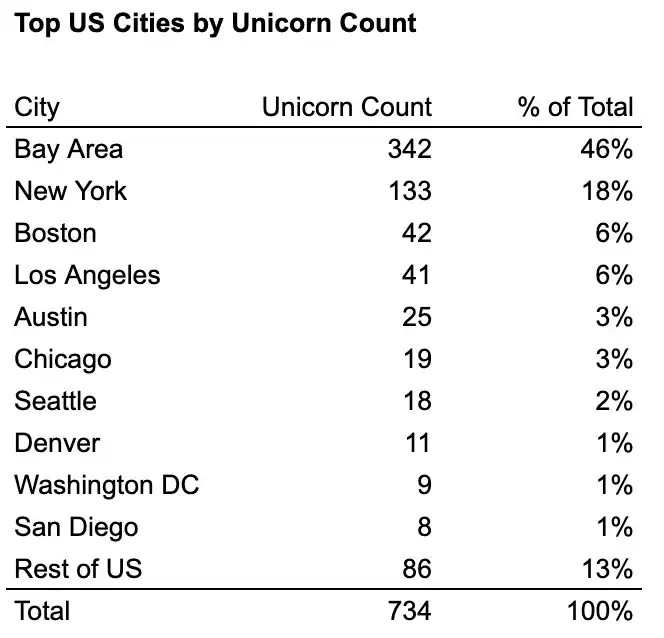
Within the United States, four "industry cities" account for approximately 76% of unicorns and about 87% of unicorn market capitalization: the Bay Area, New York, Los Angeles, and Boston. The Bay Area is the clear leader, with more than twice the number of unicorns and over four times the market capitalization of the second-place city.
Caption: Number of unicorns in major U.S. cities
Caption: Unicorn market capitalization in major U.S. cities
By examining the industry distribution of the top ten unicorns in each city, the clustering effect of industry-focused cities is clearly evident:
- Bay Area = AI cluster (6 of the top 10 are generative AI)
- New York = FinTech/crypto cluster (7 of the top 10)
- Los Angeles = Defense/Aerospace + Consumer clusters (3 of the top 6 are defense/aerospace, 4 of the top 10 are consumer)
- Boston = Relatively balanced, but skewed toward biotech/healthcare (3 of the top 10)
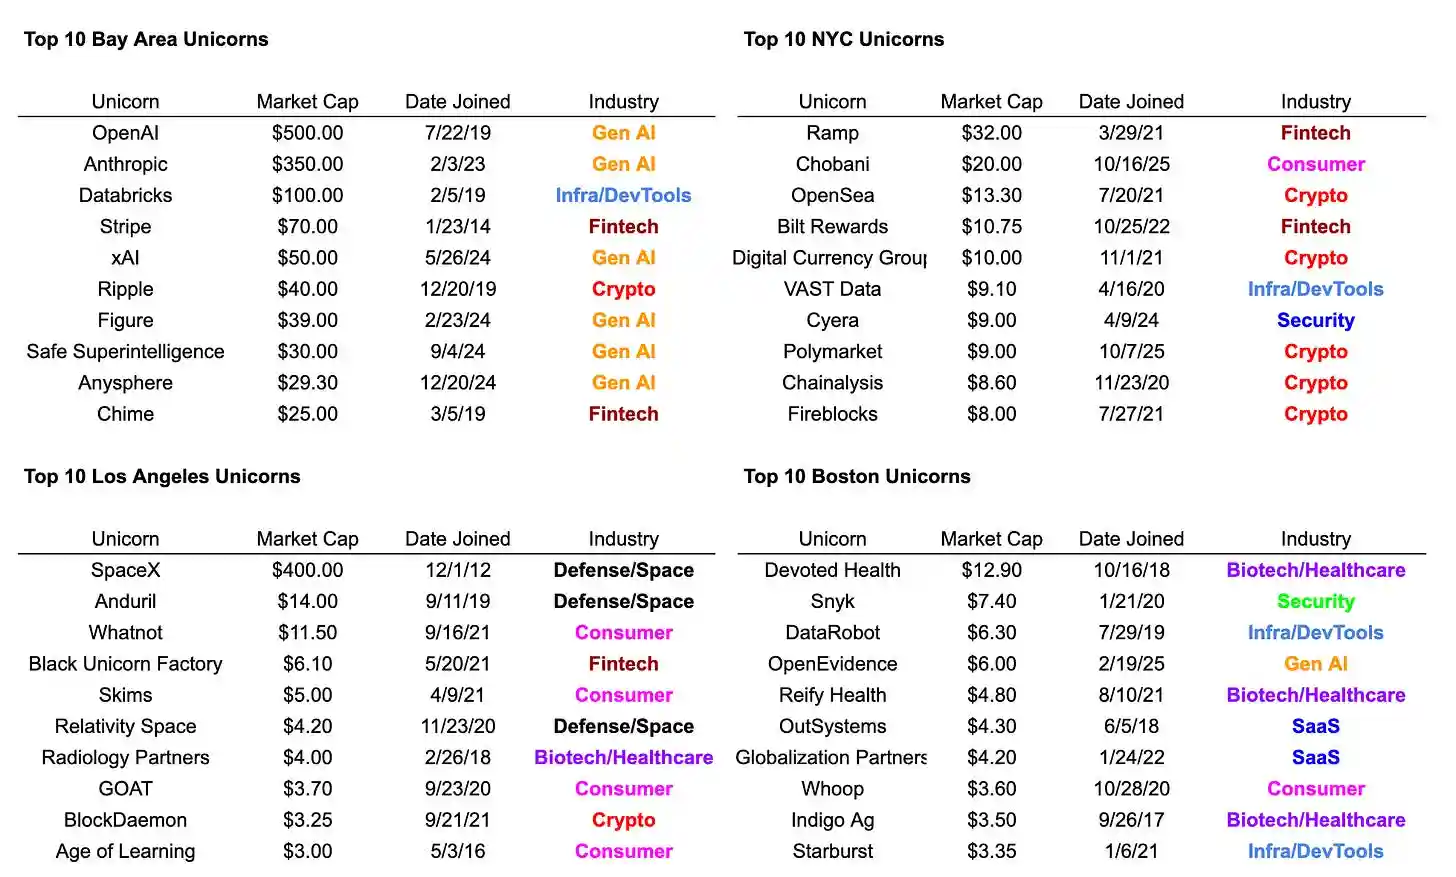
Caption: Distribution of Top 10 unicorn industries in four major U.S. cities