


Key Insights
- Polygon price has crashed sharply in the past few weeks.
- The network’s stablecoin transactions have soared.
- Technical analysis suggests it is about to form a double bottom pattern.
Polygon’s price has suffered a steep reversal over the past few days, falling from a high of $0.1853 on January 10 to the current $0.1050. It has slipped to the lowest level since January 2 despite having some of the best fundamentals, including its USDC transactions. Still, the token may be on the cusp of a strong bullish breakout as it slowly forms a highly bullish chart pattern.
Polygon USDC Transactions are Soaring as its Payment Emphasis Pays Off
Polygon, one of the earliest layer-2 networks, has become one of the biggest players in the payments industry, thanks to partnerships with major financial services companies like Revolut, Shift4 Payments, Mastercard, and Stripe.
Data shows that the network’s USDC peer-to-peer USDC volume jumped to over $1.69 billion this week, the second-best month on record. This performance is notable because it occurred during a week when crypto prices remained under intense pressure.
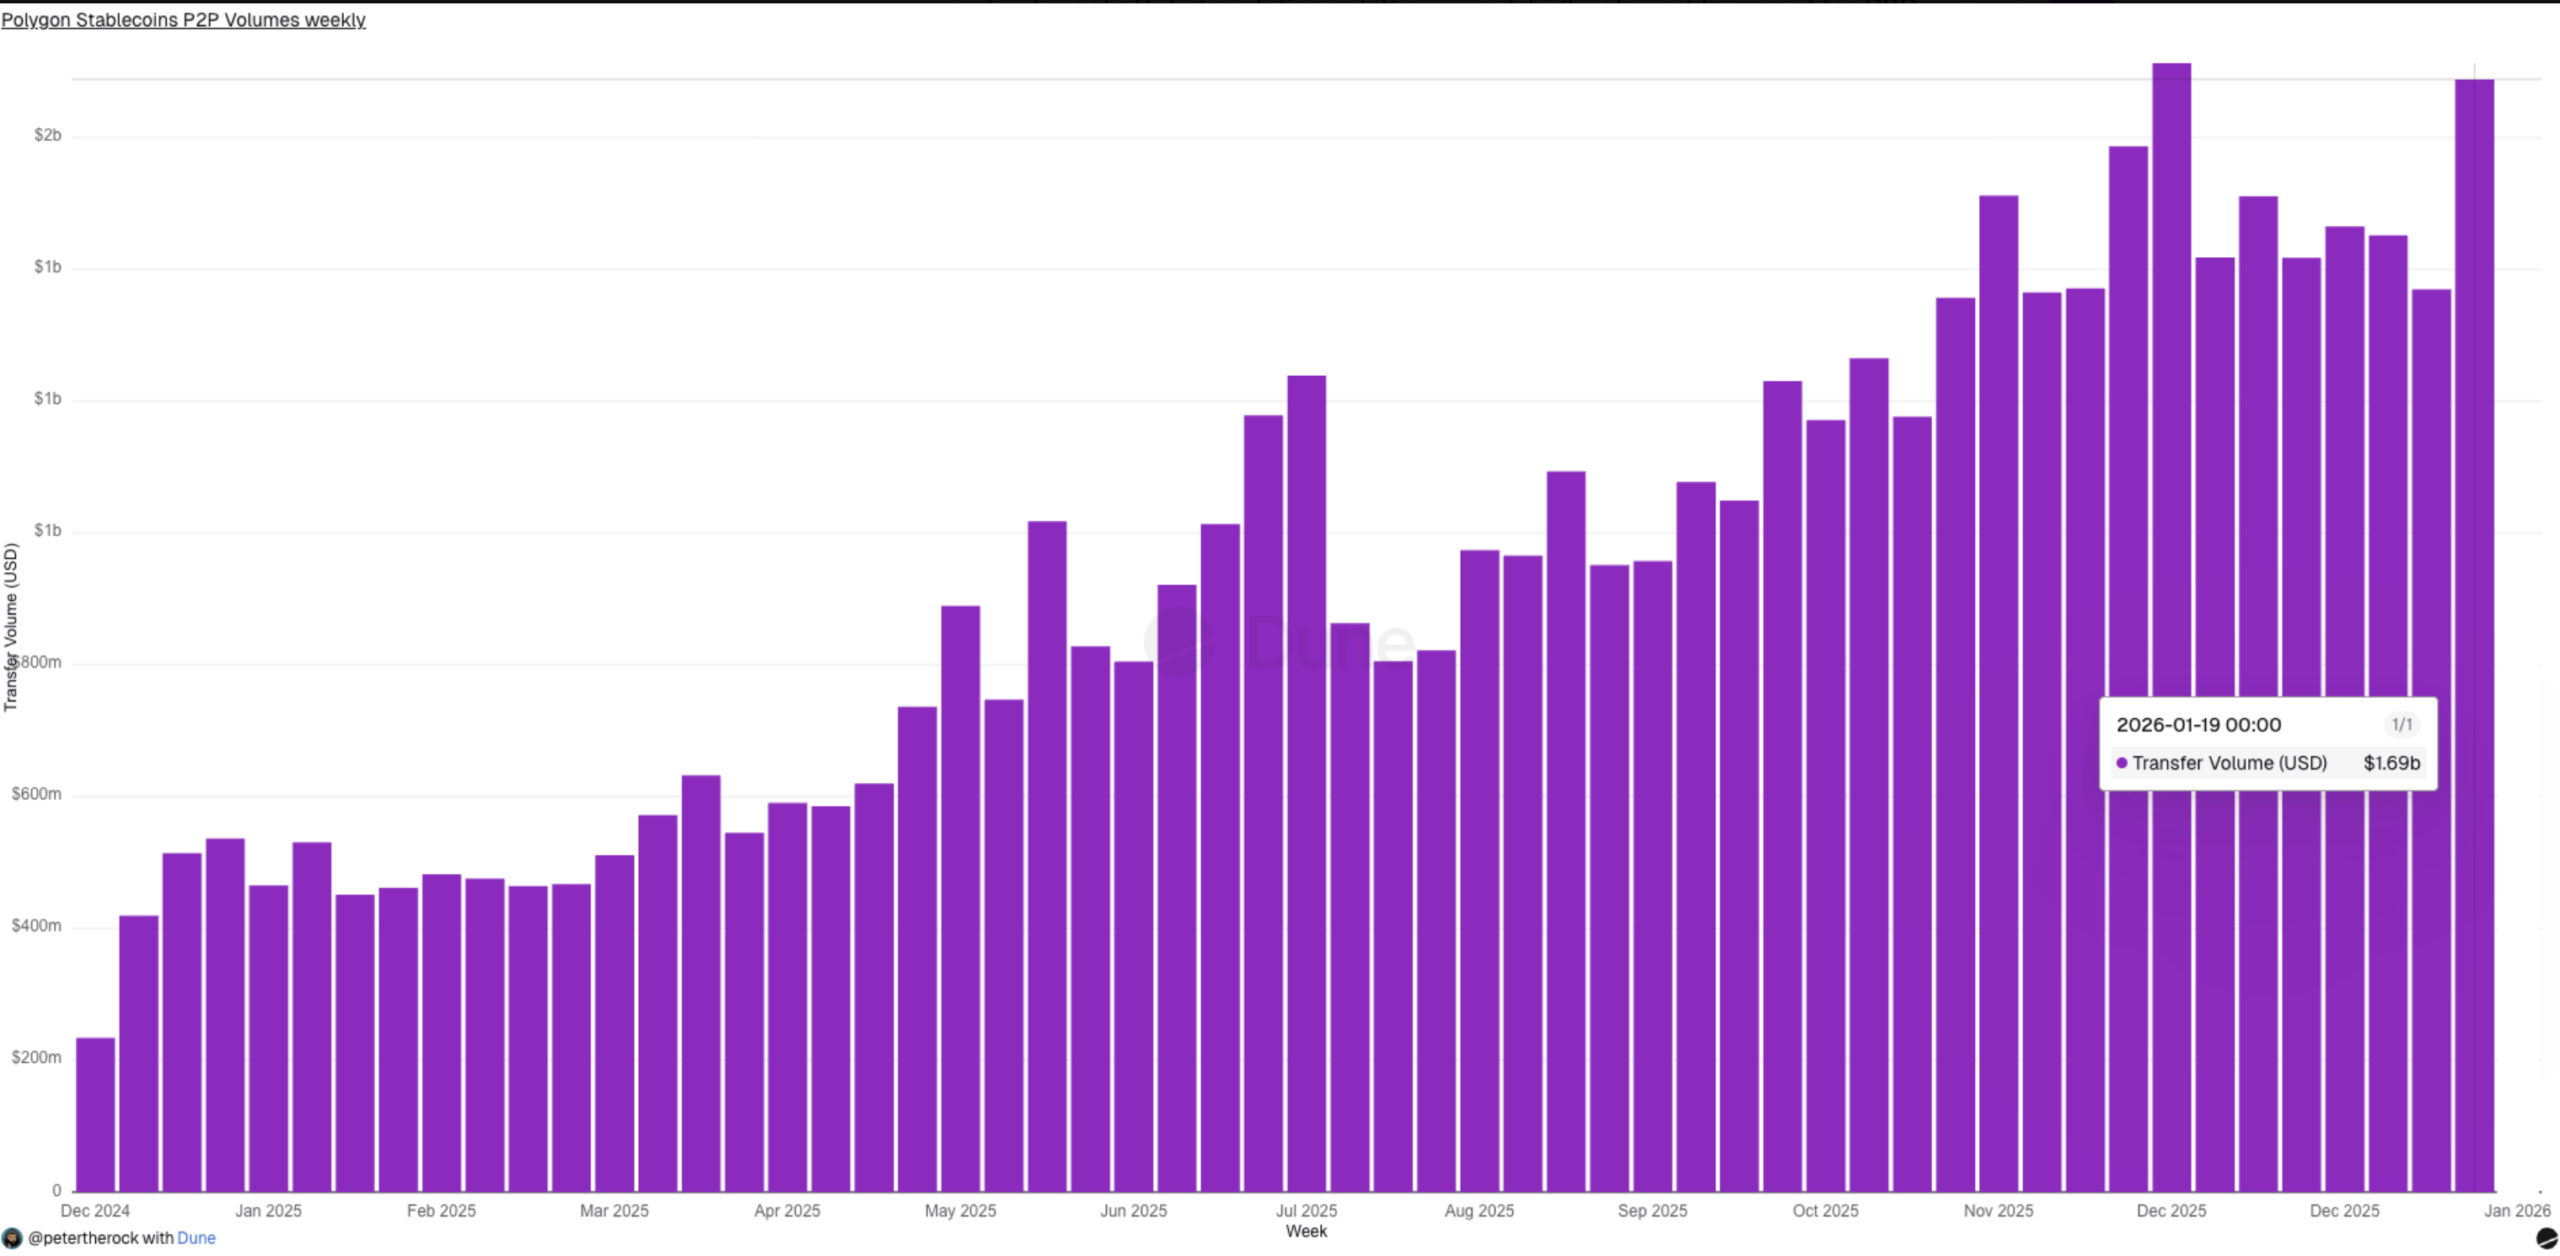
As the chart below shows, the volume of P2P payments on Polygon has continued rising in the past few months, a sign that its adoption is accelerating.
This growth will likely continue now that Polygon has launched its Open Money Stack, an open, integrated service for instantly moving money anywhere. As part of this emphasis, the developers acquired Coinme and Sequence, which gave it a foothold in the US-regulated markets.
Meanwhile, data compiled by Artemis shows that the volume of stablecoins transactions on the network has continued to rise over the past few weeks.
Polygon’s stablecoin volume jumped to over $31 billion in the last 30 days. Most notably, this growth occurred as the number of transactions soared to 336 million and stablecoin addresses reached over 5.1 million. The growing transaction count is a sign of greater user adoption.
Stablecoins have become popular assets in the crypto industry, a trend that may accelerate if the United States passes the GENIUS Act, which was introduced last year. It will also accelerate if the US passes the CLARITY Act, which made some progress this week.
Users are turning to stablecoins because they are relatively low-cost compared to fiat currencies. For example, sending 1000 USDT will cost you virtually nothing, while sending $1,000 using PayPal will cost you over $30.
The ongoing growth in stablecoin transactions and users has led to a surge in Polygon’s key metrics. For example, it made over $3.59 million in fees in the last 30 days, up by 461%.
This growth means that it is catching up to Base, a layer-2 network that made $4.56 million. It is also making more money than Arbitrum, which made over $649k in the same period.
Most importantly, rising fees on Polygon have led to a surge in its burn rate, as the network incinerates most of the fees it generates.
Polygon Price Technical Analysis
The daily timeframe chart shows that the POL price has been in a strong downward trend in the past few days. It has erased most of the gains it made earlier this year, a move that has coincided with the ongoing crypto market crash.
Polygon price has slipped below all moving averages and the Supertrend indicator, a sign that bears are in control for now. It has also moved below the weak stop-and-reverse level of the Murrey Math Lines tool.
On the positive side, there are signs that the token is dropping as bears target the key support level at $0.0985, its lowest level in December last year. This price coincides with the ultimate support of the Murrey Math Lines tool.
Therefore, there are signs that it is slowly forming a double bottom pattern, a common bullish reversal pattern. In this case, the neckline is at the year-to-date high of $0.1853.
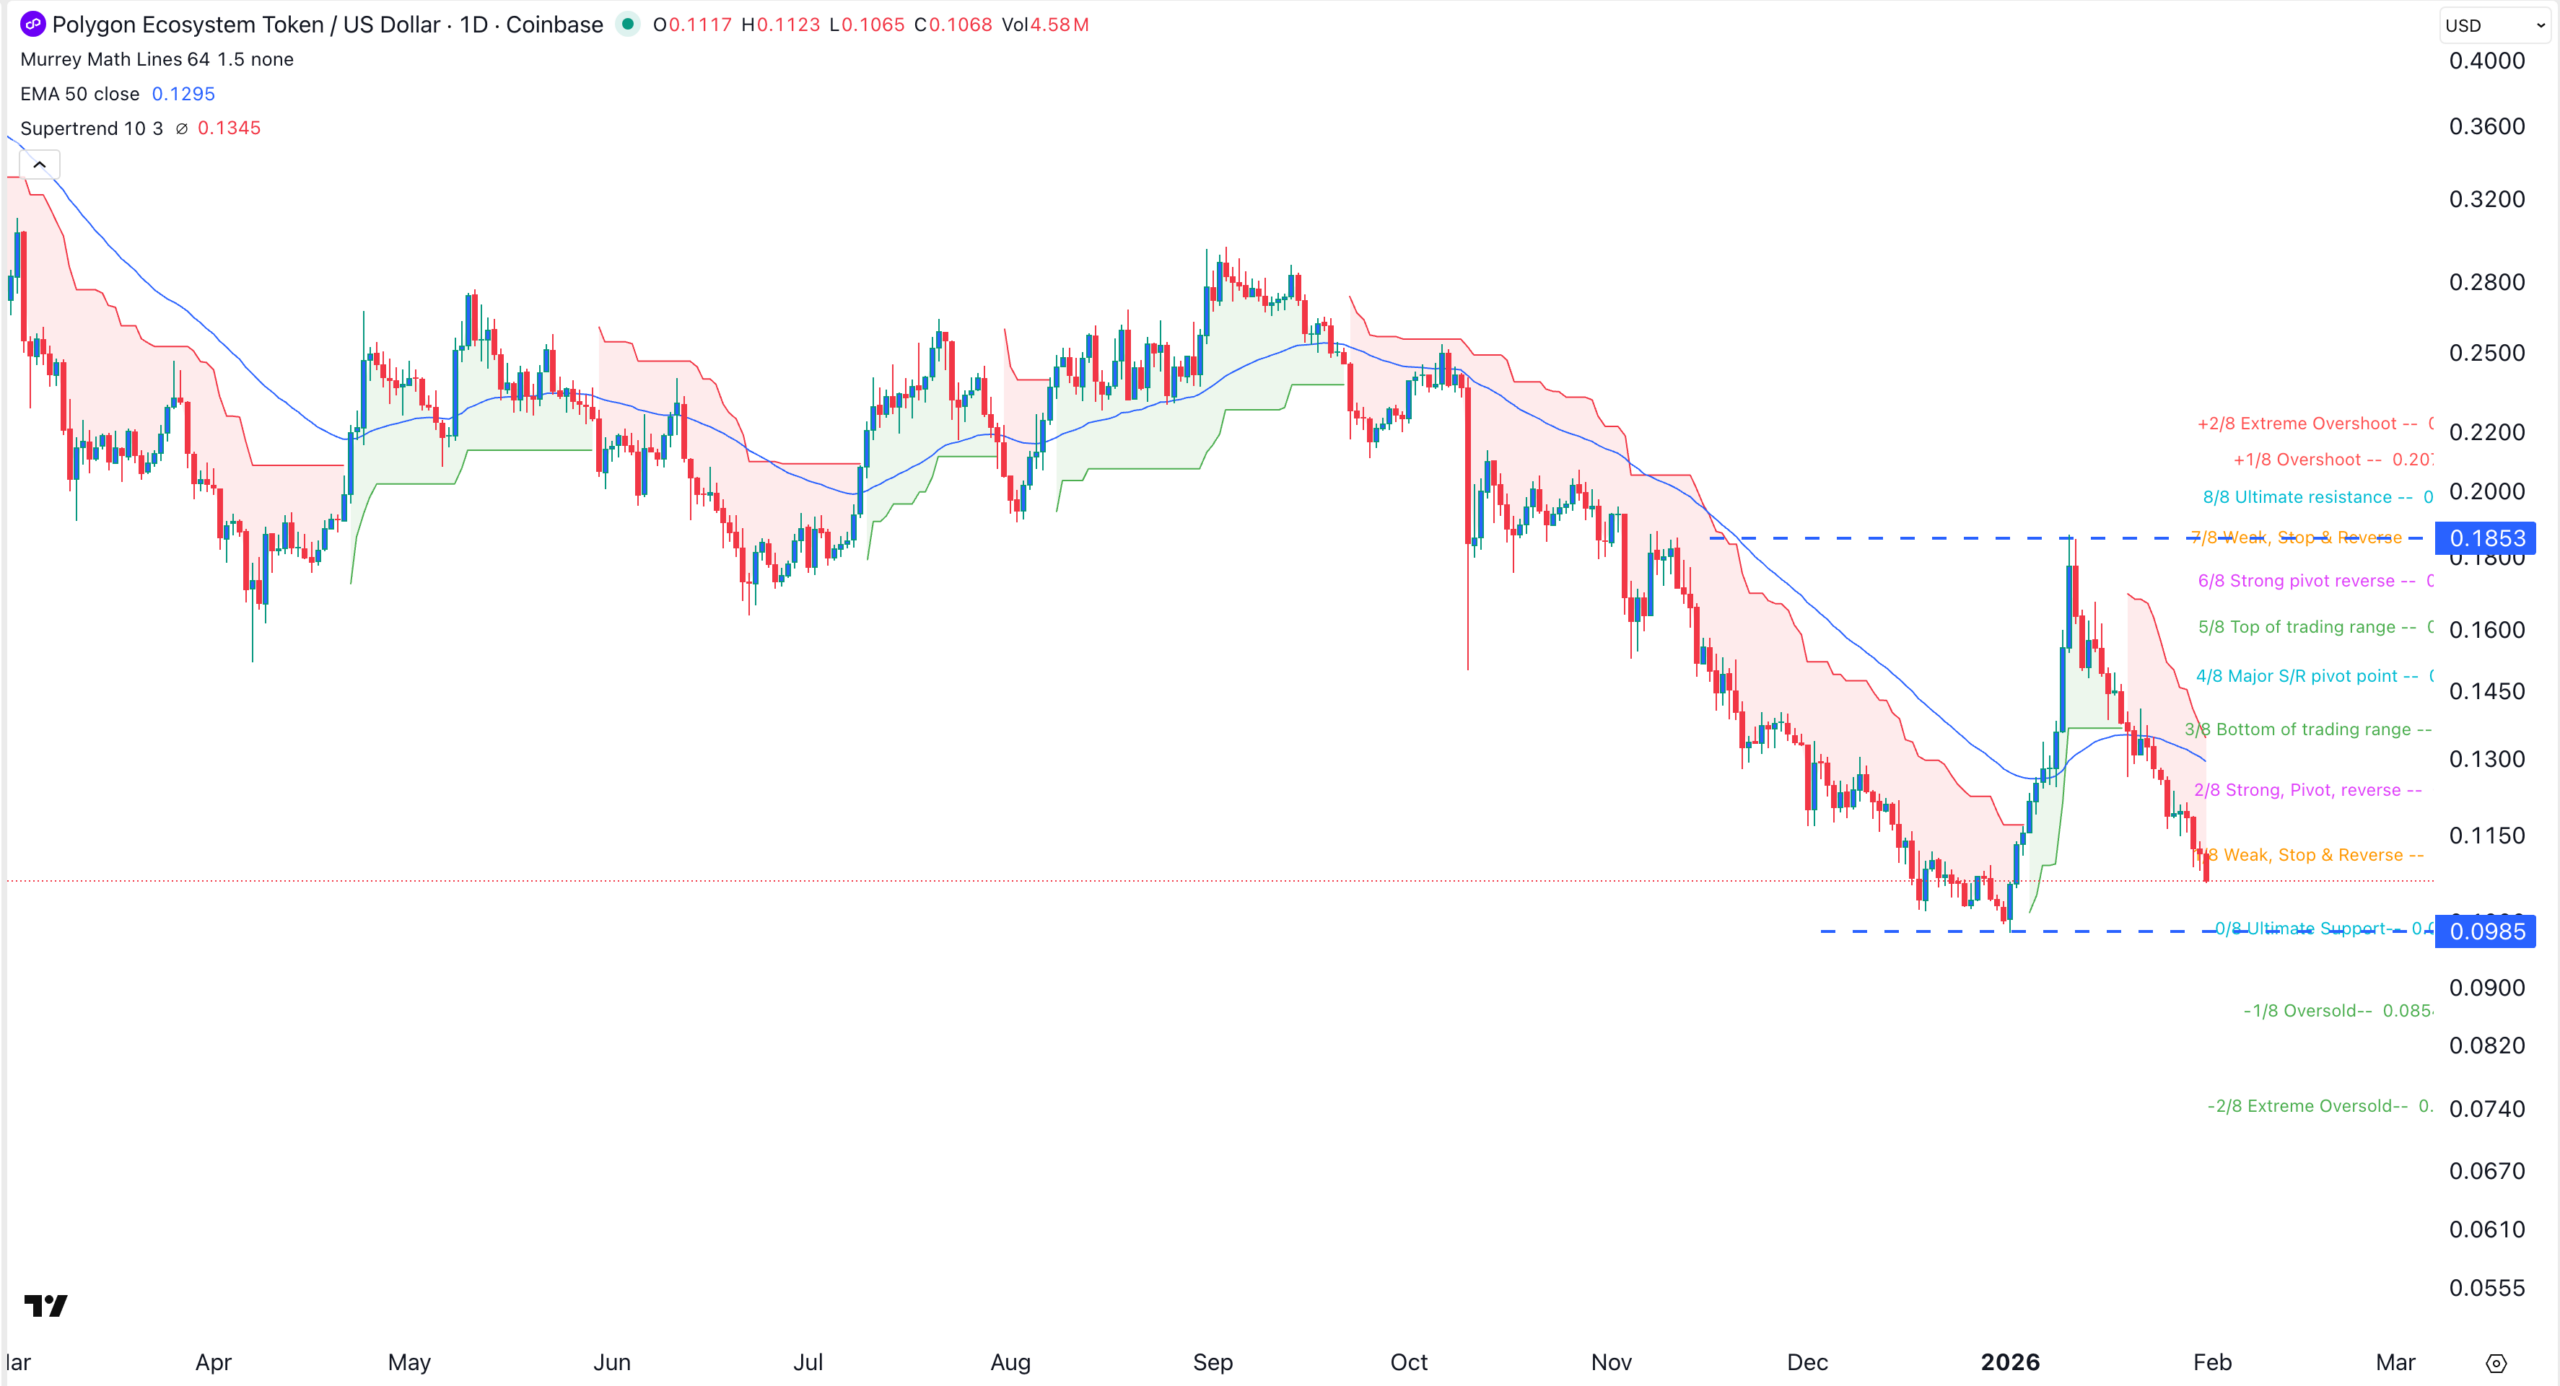
Therefore, the most likely Polygon price forecast is bullish as long as it remains above the key support level at $0.0985.
The post Polygon Price Slowly Flags a Bullish Pattern as USDC Payments Soar appeared first on The Market Periodical.