


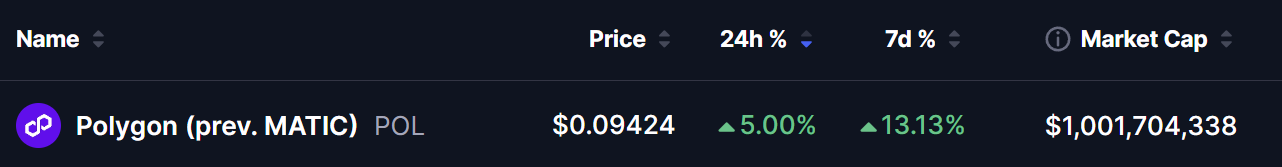
As of April 2026, Polygon’s native token POL is showing early signs of recovery after a prolonged downtrend. The token is currently trading around $0.0942, posting a +5% daily gain and +13% over the past week, with its market capitalization climbing to approximately $1 billion.
While price action remains below key resistance levels, on-chain activity tells a much stronger story — suggesting that momentum could be building beneath the surface.
Polygon Network Activity Surges to All-Time High
One of the biggest catalysts behind renewed interest in POL is its explosive network growth.
Polygon ended Q1 2026 with 711 million transactions, marking a new all-time high. This represents a massive +49% increase compared to Q4 2025, highlighting strong user demand and growing ecosystem adoption.
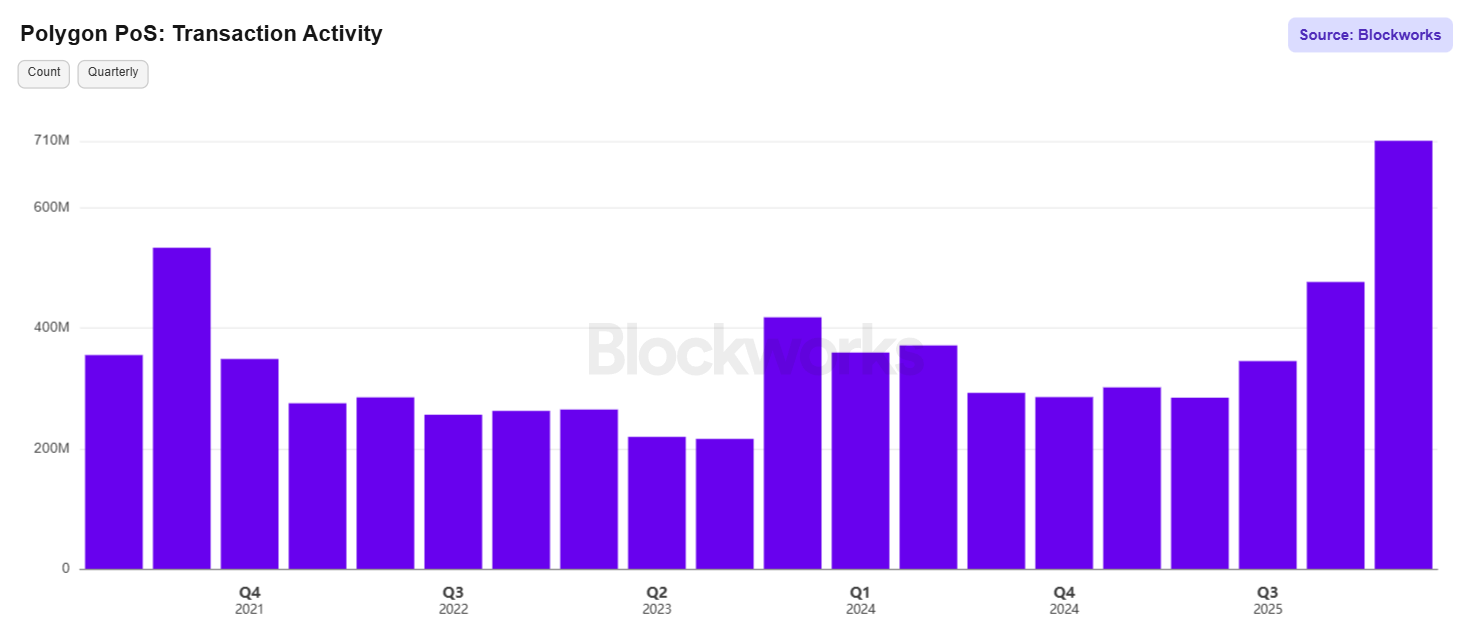
Even as price lagged, the network continued to expand — often a leading indicator of future price movements.
POL Technical Analysis: Falling Wedge Signals Potential Breakout
On the daily chart, POL is forming a Falling Wedge pattern — a classic bullish reversal structure that typically appears after extended downtrends.
This pattern has been developing since September 2025, with price consistently making lower highs and lower lows within converging trendlines.
Key observations:
- Previous rejection near $0.1864 resistance
- Strong bounce from $0.08118 support
- Current price hovering near $0.0942
- Still trading below:
- Resistance trendline (~$0.10)
- 100-day moving average (~$0.1053)
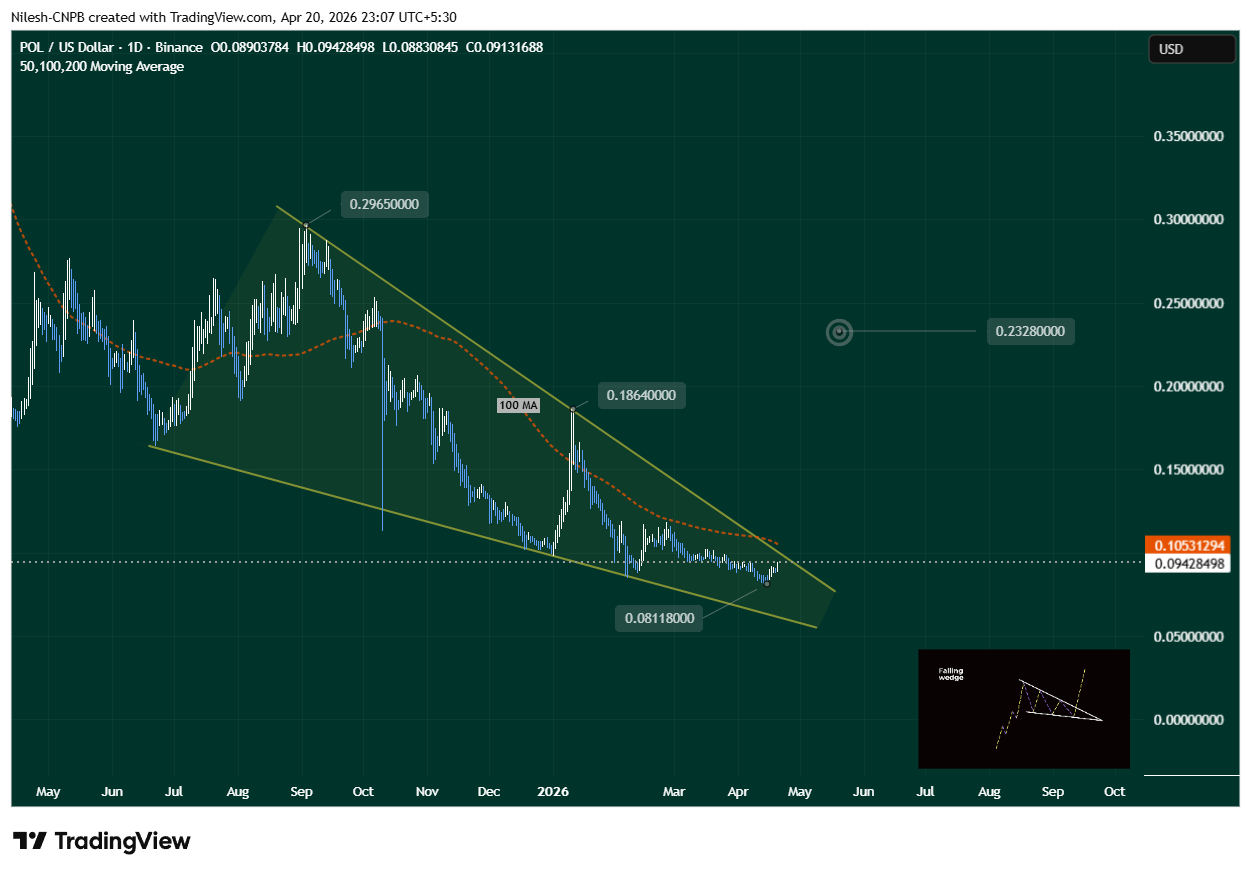
The structure suggests that selling pressure is weakening, and a breakout attempt could be approaching.
What’s Next for POL?
Bullish Scenario
If POL successfully breaks above the $0.10 resistance trendline, the next key confirmation level is the 100-day moving average (~$0.1053).
A strong move above both levels could trigger a bullish breakout, with the next major upside target around $0.2328 — representing a significant recovery from current levels.
Bearish Scenario
If POL fails to break resistance, the immediate support remains at $0.08118.
A breakdown below this level could:
- Delay the bullish setup
- Lead to further consolidation
- Retest lower support zones
However, as long as higher lows continue forming, the broader structure may still remain constructive.
Bottom Line
Polygon is showing a strong divergence between price and fundamentals.
- On-chain activity is hitting record highs
- Price is still compressed within a bullish pattern
If momentum continues and resistance levels break, POL could be setting up for a meaningful recovery phase.
Frequently Asked Questions (FAQ)
Why is Polygon (POL) gaining attention?
Polygon recorded 711M transactions in Q1 2026, an all-time high, signaling strong network growth.
What pattern is POL forming?
POL is forming a falling wedge, a bullish reversal pattern.
What is the key breakout level for POL?
The key resistance lies around $0.10, followed by the 100-day MA near $0.1053.